How Industrial Policies Shaped the Global Electric Vehicle Supply Chain
Governments worldwide are spending billions to attract electric vehicle (EV) and battery manufacturing to their shores. The US Inflation Reduction Act, Canadian production subsidies, and European Union tariffs on Chinese EVs all aim to build domestic supply chains in an industry characterized by massive fixed costs and complex, multistage production. Average investment costs are substantial—$660 million for an EV assembly plant and $1.85 billion for a battery plant.
In Industrial Policies for Multi-Stage Production: The Battle for Battery-Powered Vehicles (NBER Working Paper 34884), Keith Head, Thierry Mayer, Marc Melitz, and Chenying Yang develop a quantitative framework to analyze how industrial policies reshape plant location decisions and EV adoption across the global value chain. They model two key production stages, battery cell manufacturing and vehicle assembly, along with final distribution to consumers. They estimate fixed and marginal costs of production, and use their estimates to simulate how firms might reorganize their global supply chains in response to policy shocks.
Industrial policies that tie EV subsidies to domestic production requirements can boost local battery manufacturing but undercut the expansion of EV adoption.
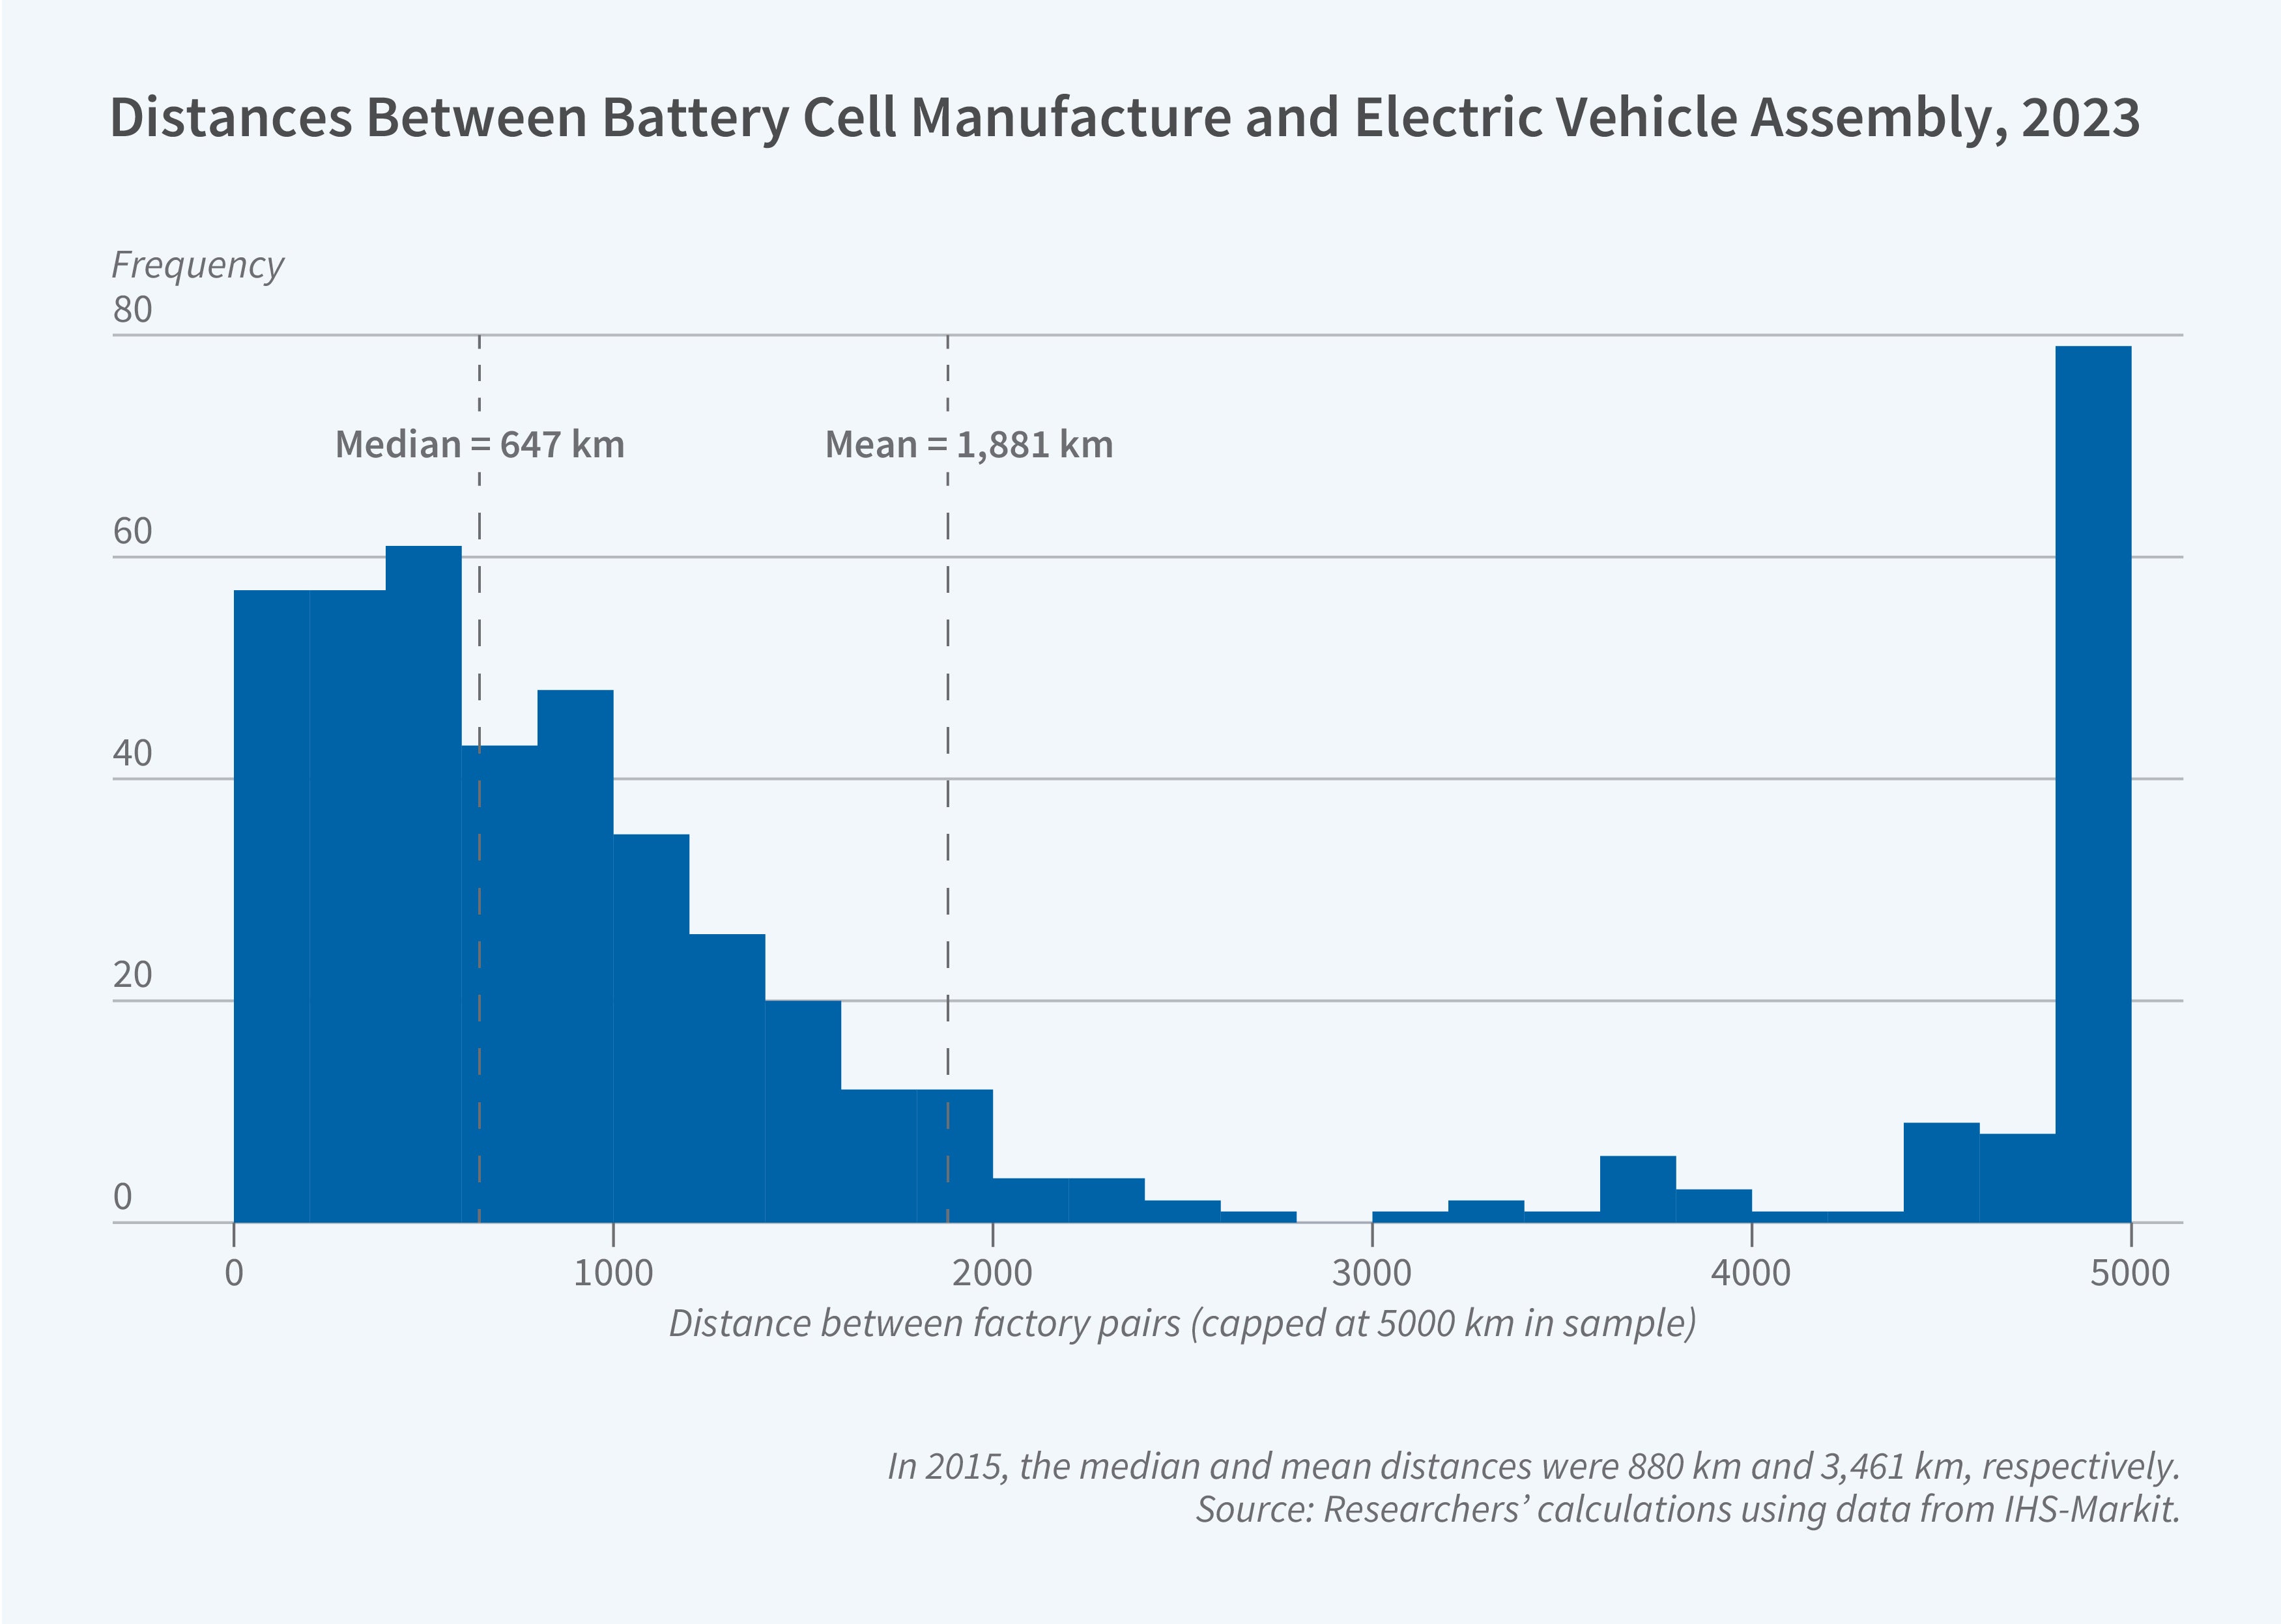
The researchers construct a novel dataset by combining three proprietary sources from S&P Global Mobility that track production paths from battery cells to assembly to final sales destinations for all EV models sold in 24 major markets from 2015 to 2023. They find that for most car models and battery specifications, single sourcing is the norm. Less than 5 percent of battery cell or vehicle production involves multiple suppliers.
The simulations compare three policy scenarios, each involving a 20 percent consumer subsidy: an unconditional subsidy, one conditional on domestic assembly, and one conditional on both domestic assembly and domestic cell production. For North America, the unconditional subsidy increases EV expenditure by 86 percent while also raising the number of assembly production lines by 16 percent and cell production lines by 7 percent. Conditioning the subsidy on domestic assembly reduces the EV adoption effect to 71 percent, while requiring both domestic assembly and cells cuts it further to 32 percent.
The full supply chain requirement quadruples the expansion of cell factories in North America relative to the unconditional subsidy, a 27 percent increase, but raises the marginal cost of the average delivered vehicle by just over 2 percent.
For Europe, the unconditional subsidy increases EV expenditure by 63 percent. Requiring the full supply chain to be in Europe reduces that to about 31 percent. The trade-offs are less severe than in North America because European cell manufacturing costs are roughly 39 percent below North American levels and only about 6 percent above those in Asia.
The researchers acknowledge funding from their respective institutions.


