
Research

The NBER conducts and disseminates independent, cutting-edge, non-partisan research that advances economic knowledge and informs policy makers and the business community.

New NBER Papers

- Working Paper
What are a country's policy options in the face of emerging technologies development in a global economy? To answer...
- Working Paper
We estimate the impact of more stringent minimum lot size restrictions across small border areas of neighboring...
- Working Paper
Many countries subsidize agricultural inputs but require farmers to travel to retailers to access inputs, just as for...
- Working Paper
This paper discusses the importance of incorporating personal assistance into interventions aimed at improving long-...
- Working Paper
Infrastructure costs in the United States are high and rising. The procurement process is one potential cost driver....
Keep Track of New NBER Working Papers with New This Week

The Digest

The Digest is a free monthly publication featuring non-technical summaries of research on topics of broad public interest.

Subscribe to the Free Digest

    This figure is a vertical stacked bar graph titled, Source of Inflation, 2020 Q1 to 2023 Q1. The y-axis represents percent and ranges from negative four to positive ten percent, increasing in increments of 2. The x-axis is time and ranges from 2020 quarter 1 until 2023 quarter 1.  There are 5 categories of bars on the figure: Initial conditions, Energy prices, food prices, vacancy to unemployment ratio, and shortages. Additionally, there are two lines. One is a solid line labeled, Actual price inflation, an
    Article
    After several decades of relatively low and stable inflation, in 2021 the US experienced a sharp rise in the pace of price increases. The annual inflation rate, as measured by the Consumer Price Index, was 1.7 percent in February 2021 but rose to more than 5 percent in June 2021. It continued rising for another year, peaking at about 9 percent in June 2022. The rise in the inflation rate has been attributed to many factors. The US response to the COVID-19 pandemic...
    This figure is a line graph titled, Inflation in Food product Groups, 2006 to 2015. The y-axis is labeled, Food price index normalized to 1 in quarter 4 2006. It ranges from 1 to 1.09, increasing in increments of 0.01 The x-axis is time and ranges from 2006 quarter 4 to 2015 quarter 4, increasing in increments of one year. There are two lines on the graph: traditional index and hedonic index. From 2006 quarter 4 to 2008 quarter 4. Both lines are nearly identical before diverging. They follow the same trajec
    Article
    One of the perennial challenges of constructing price indices like the Consumer Price Index (CPI) is that products change over time. This is often cited as a concern with regard to rapidly evolving products on the technological frontier, such as personal computers, cellphones, and automobiles. One standard approach to adjusting for quality change, the “hedonic method,” involves relating product prices to product characteristics, such as memory size and CPU speed for...

The Reporter

The Reporter is a free quarterly publication featuring program updates, affiliates writing about their research, and news about the NBER.

Subscribe to the Free Reporter

    This figure is a line graph titled Timeline of the Trump Administration’s Tariffs The y-axis is labeled percent and ranges from 1 to 6, increasing in increments of 1. The x-axis represents time and ranges from December 2017 to October 2019, increasing in increments of two months.  There are 8 dashed vertical lines representing eight major waves of tariffs. In order from left to right, those tariffs are: Solar & wash. Mach. (ten billion USD), Steel & alum. (18 billion USD), Steel & alum. CAN, MEX, EU (22 bil
    Article
    Author(s): Stephen J. Redding
    The International Trade and Investment (ITI) Program holds three regular meetings annually, in winter, spring, and at the NBER Summer Institute. The ITI Program has 85 research associates, 11 faculty research fellows, two research economists, and 34 members with primary affiliations in other NBER programs, making a total of 132 members. Research within the group covers a wide range of topics, such as explaining patterns of international trade and foreign direct investment,...
    Governments Figure 1
    Article
    Author(s): Jeffrey Clemens
    Economic crises bring questions about the design and implications of fiscal systems to the forefront. In the United States, state and local governments employ roughly one in seven workers and spend an amount equivalent to one-fifth of GDP. Because many of these entities operate with balanced budget requirements, downturns create pressure because declines in revenue coincide with a rise in demand for public services. These pressures come with some urgency, as state and local...

The Bulletin on Retirement & Disability

The Bulletin on Retirement and Disability summarizes research in the NBER's Retirement and Disabiy Research Center. A quarterly, it is distributed digitally and is free.

Subscribe to the Free Bulletin on Retirement & Disability

    Pandemic Mortality Differentials and the Racial and Ethnic Wealth Gap
    Article
    Mortality rates among Black Americans are substantially higher than rates among White Americans. Factors linked to structural racism contribute to this outcome, including differences in health care access and quality, poverty, education, neighborhood, and lifestyle. While the racial mortality gap has narrowed over time, there was a sharp widening of the differential during the COVID-19 pandemic. Disparities in mortality play a key role in accounting for racial and...
    This figure is a vertical bar graph titled Preferred Method of Communication about Social Security Benefits among Non-Retirees. The y-axis represents a share. It is labeled in percentages, ranging from 0 to 100 percent, increasing in increments of 20.  The x-axis has 6 categories of labels, that read from left to right: Information mailed by SSA to my home, Information provided at my place of work, Information posted in community spaces, Web-based tutorials by SSA on YouTube, SSA smartphone app, Public serv
    Article
    Workers need to prepare for their future as retirees. This is a complex task that is influenced by workers’ retirement knowledge, financial literacy, preferences, expectations, and opportunities.  In Racial and Ethnic Disparities in Retirement Outcomes: Impacts of Outreach (NBER Working Paper 30456), researchers Angelino Viceisza, Amaia Calhoun, and Gabriella Lee review literature on disparities in retirement outcomes and the potential for outreach and service...

The Bulletin on Health

The Bulletin on Health summarizes recent NBER Working Papers pertaining to health topics. It is distributed digitally three times a year and is free.

Subscribe to the Free Bulletin on Health

    blue laws
    Article
    A sharp increase in “deaths of despair” — deaths from poisonings, suicides, and alcoholic liver disease — occurred in the US in the early 2000s, but the initial rise began a decade earlier for middle-aged Whites. These developments are studied in Opiates of the Masses? Deaths of Despair and the Decline of American Religion (NBER Working Paper 30840). In this paper, Tyler Giles, Daniel M. Hungerman, and Tamar Oostrom examine the relationship between the increase in such...
    Unemployment Insurance, Birth Rates, and Infant Health Figure
    Article
    Falling birth rates in the US and other advanced economies have raised questions about the links between economic conditions, government safety nets, and fertility and infant health. In The Cyclicality of Births and Babies’ Health, Revisited: Evidence from Unemployment Insurance (NBER Working Paper 30937), Lisa Dettling and Melissa Kearney find that fertility rates and infant health are influenced by the mother’s financial circumstances during economic downturns....

The Bulletin on Entrepreneurship

Introducing recent NBER entrepreneurship research and the scholars who conduct it
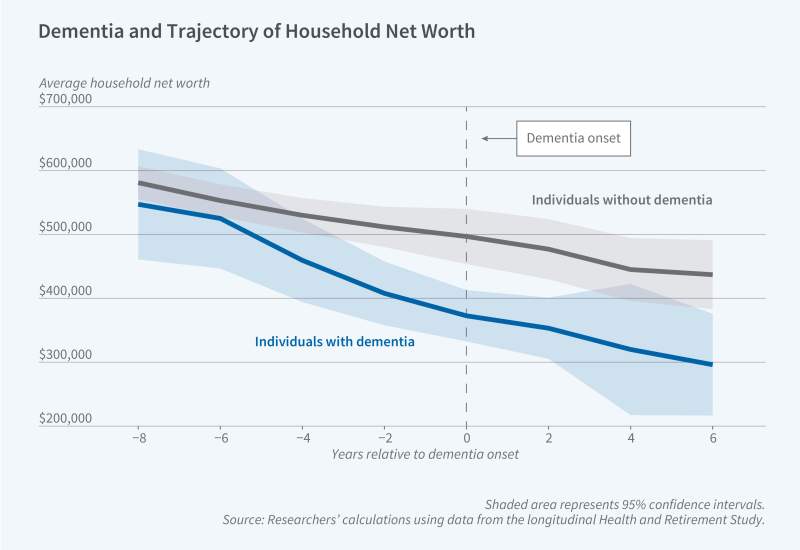
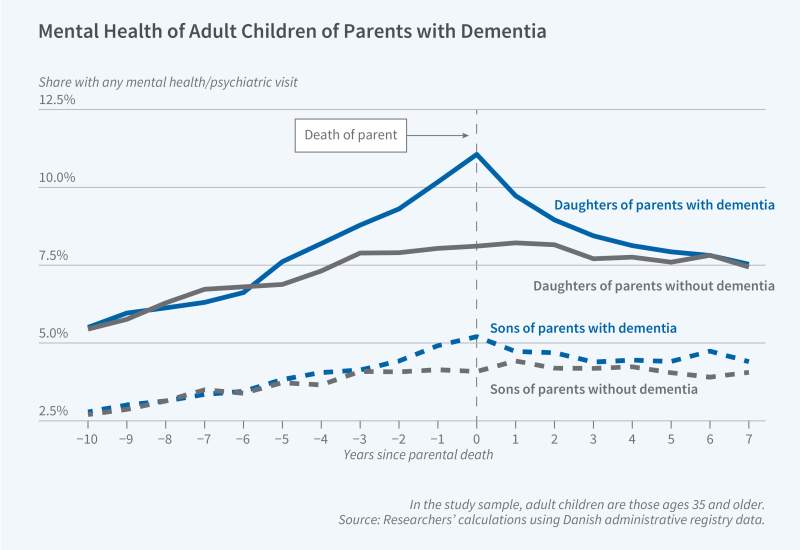
 Subscribe to the Free Bulletin on Entrepreneurship
    Startups Drive Commercialization of High-Impact Innovations figure
    Article
    Startups have more incentive than incumbent firms to engage in potentially disruptive R&D because large, established firms have more to lose from the discovery of new technologies that replace traditional ways of doing things. With no existing operations, startups have nothing to lose and much to gain from disruptive innovation. In Of Academics and Creative Destruction: Startup Advantage in the Process of Innovation (NBER Working Paper 30362), Julian Kolev, Alexis...
    Gender and Race Gaps on the Path to Startup Success figure
    Article
    Depending on the data source, 12 and 28 percent of high-growth startups are run by women, although women make up 45 percent of the overall labor force. Fewer than 10 percent of entrepreneurs are Black. In Race and Gender in Entrepreneurial Finance (NBER Working Paper 30444), Michael Ewens surveys available data and presents a framework for assessing gender and race gaps in startup founding, financing, and growth.   The startup path is complex: individual...
Explore NBER-Based Research Projects
Learn about NBER Affiliated Scholars