Co-Directors

Christopher "Kitt" Carpenter is the E. Bronson Ingram Chair and Professor of Economics at Vanderbilt University, where he also holds courtesy appointments in the schools of law and medicine. His research focuses on the effects of public policies on health and family outcomes. He has been an NBER affiliate since 2005.

Amy Finkelstein is the John and Jennie S. MacDonald Professor of Economics at the Massachusetts Institute of Technology and the co-founder and Co-Scientific Director of the Jameel Poverty Action Lab-North America. Her research interests focus on public finance and health economics, particularly market failures and government intervention in insurance and health care markets. She has been an NBER affiliate since 2001.
Featured Program Content

Before 2011, Medicare paid durable medical equipment (DME) suppliers a fixed, administratively set price that often resulted in high profit margins. In some...
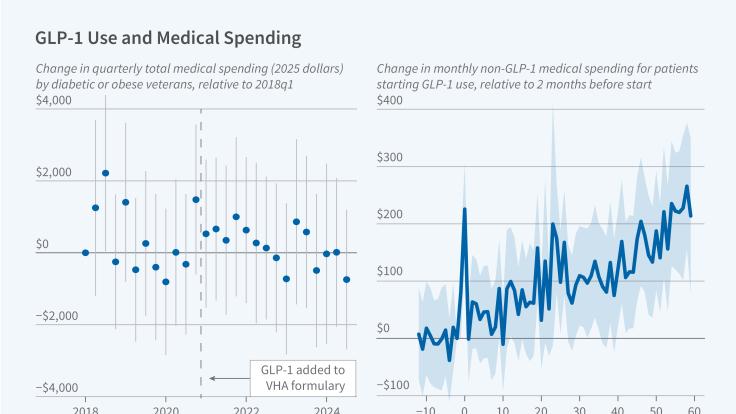
Glucagon-like peptide-1 receptor agonists (GLP-1s), better known by brand names such as Ozempic and Wegovy, have generated intense interest as...
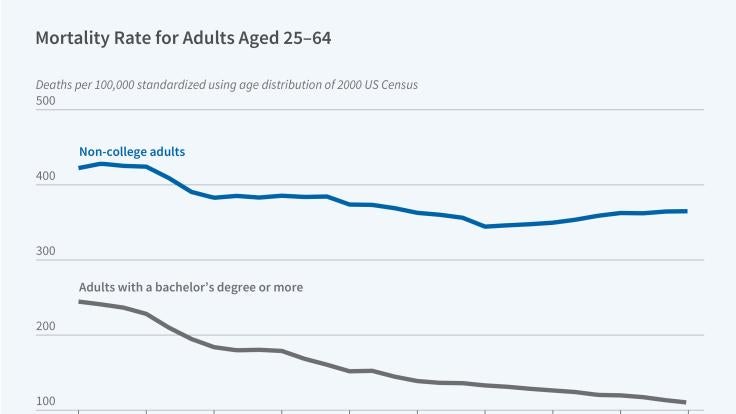
Over the past three decades, the life expectancy gap between Americans with and without college degrees widened from 2.6 years in 1992 to 6.3 years. At...