Housing, Climate Risk, and Insurance
Homeowners are especially vulnerable to climate change. Their homes are commonly the largest investment in their portfolio, but houses are immovable assets. With the US housing market worth approximately $48 trillion, the choices homeowners, home builders, insurers, and mortgage lenders make around climate risk also affect the macroeconomy. In this article, I summarize the work that my coauthors and I have conducted on the topic of housing and climate risk.
How environmental risks associated with climate change are reflected in the market value of properties is known as “capitalization.” House prices shifting due to climate risk signal where and how quickly adaptation must occur. When property values fail to promptly or accurately capture these risks, it creates a gap between perceived value and long-term vulnerability. The timing and extent of home price adjustment are critical for understanding whether assets are valued correctly and ultimately the true economic impact of climate risk.
My work explores changes in long-term risk perceptions and in direct financial costs of insurance. Perceptions of risk may operate on different timescales, which are subject to disagreement. Insurance prices, as a direct financial signal, are a primary pathway by which housing markets can adjust to climate risk. Premium changes today may cause homeowners to update their beliefs about today’s risks as well as the future path of risks.
In the face of more frequent and severe climate events, many homeowners are uninsured or underinsured. Climate-induced disasters are a further destabilizing event for housing markets—post-disaster aid can help affected households. Insurance markets alone thus offer an incomplete picture, as capitalization is additionally influenced by households’ ability to recover in the aftermath of a disaster. A holistic analysis of climate risk transfer programs, such as insurance and post-disaster aid, which may face different adverse selection and moral hazard challenges, represents a potential direction for future research.
Do House Prices Reflect Climate Risk?
As 42 percent of the US population resides in shoreline counties, whether housing markets incorporate information on the risk of sea level rise (SLR) is of critical importance. Philip Mulder and I study the relationship between exposure to SLR and changes in housing and mortgage markets over the 2001–19 period.1 We focus on the coastal Florida market, where the Union of Concerned Scientists projects that more than 1 million properties are at risk of chronic inundation due to SLR by 2100.
To examine how climate risks are incorporated into housing markets, we link combined data on home transactions, sales listings, mortgage applications, and insurance premiums to climate forecasts at the census tract level. Our analysis focuses on similar housing markets within one mile of the Florida coast that are differentially exposed to SLR because of differences in elevation.
We document a demand-driven decline in transaction volumes and home prices over a period of increasing risk salience. As shown in Figure 1, transaction volumes began to diverge in 2013, with prices declining only gradually thereafter. Using listings data, we find that the transaction decline can be attributed to sellers continuing to list their homes at the same prices as their less exposed coastal neighbors. As a result, SLR-exposed homes spent more days on the market before selling and accumulated as unsold inventory. Only gradually did sellers lower their list prices to meet the falling demand of buyers.
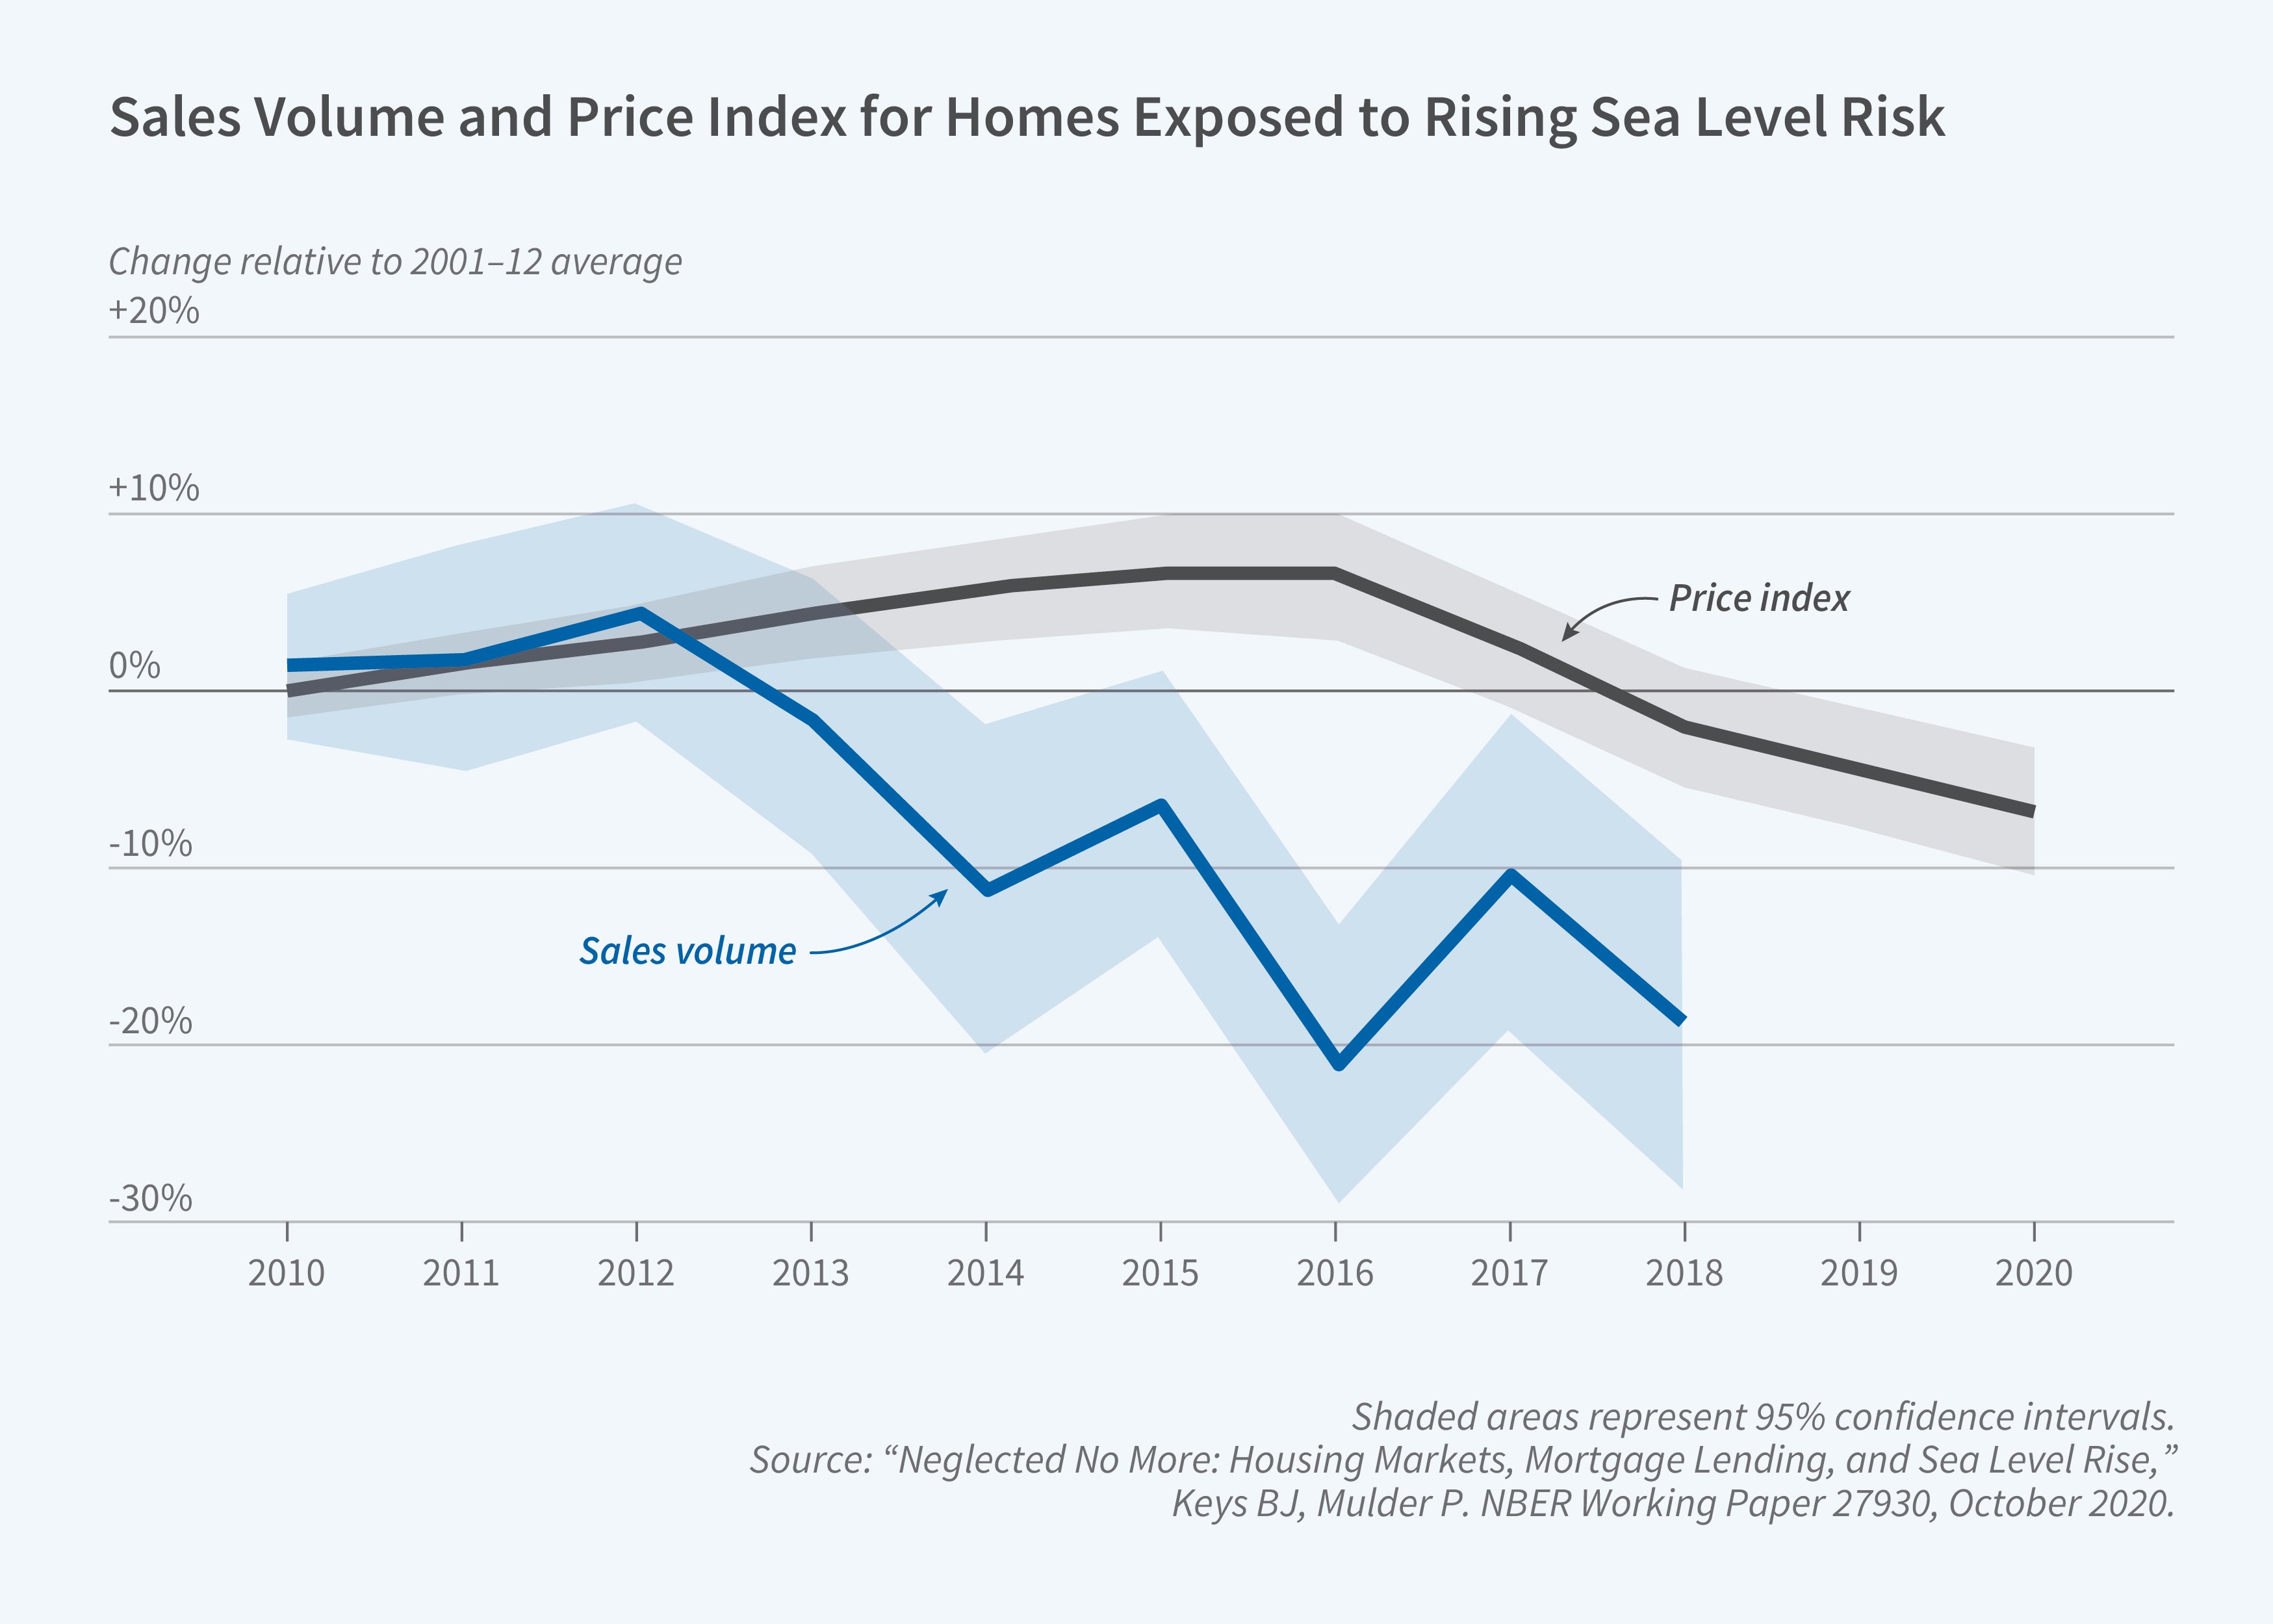
Calibrating a housing market model of transaction volume and prices where sellers incorporate negative climate news into their list prices with a delay, we find that by 2019, buyers demanded a 6.7 percent price discount to accept SLR risks. Interpreted through the model, a discount of this magnitude implies that buyers expect at-risk coastal homes to be underwater 20 years earlier than suggested by home prices alone.
Our findings suggest that capitalization of new information about risks into house prices is neither instantaneous nor automatic. In addition, the results point to a potential area for further research in decomposing the influence of frictions that delay adjustment. Possible channels include sluggish updating of beliefs, the effects of subsidized flood insurance, and the choice of mortgage lenders to not price regional risk.2
What Is Driving the Increased Cost of Property Insurance?
Property insurance plays a critical role in housing markets. Few homeowners can afford to pay out of pocket when disaster strikes. Most home transactions are facilitated by mortgage credit, and mortgage lenders and guarantors like Fannie Mae and Freddie Mac require sufficient insurance coverage to protect their collateral.
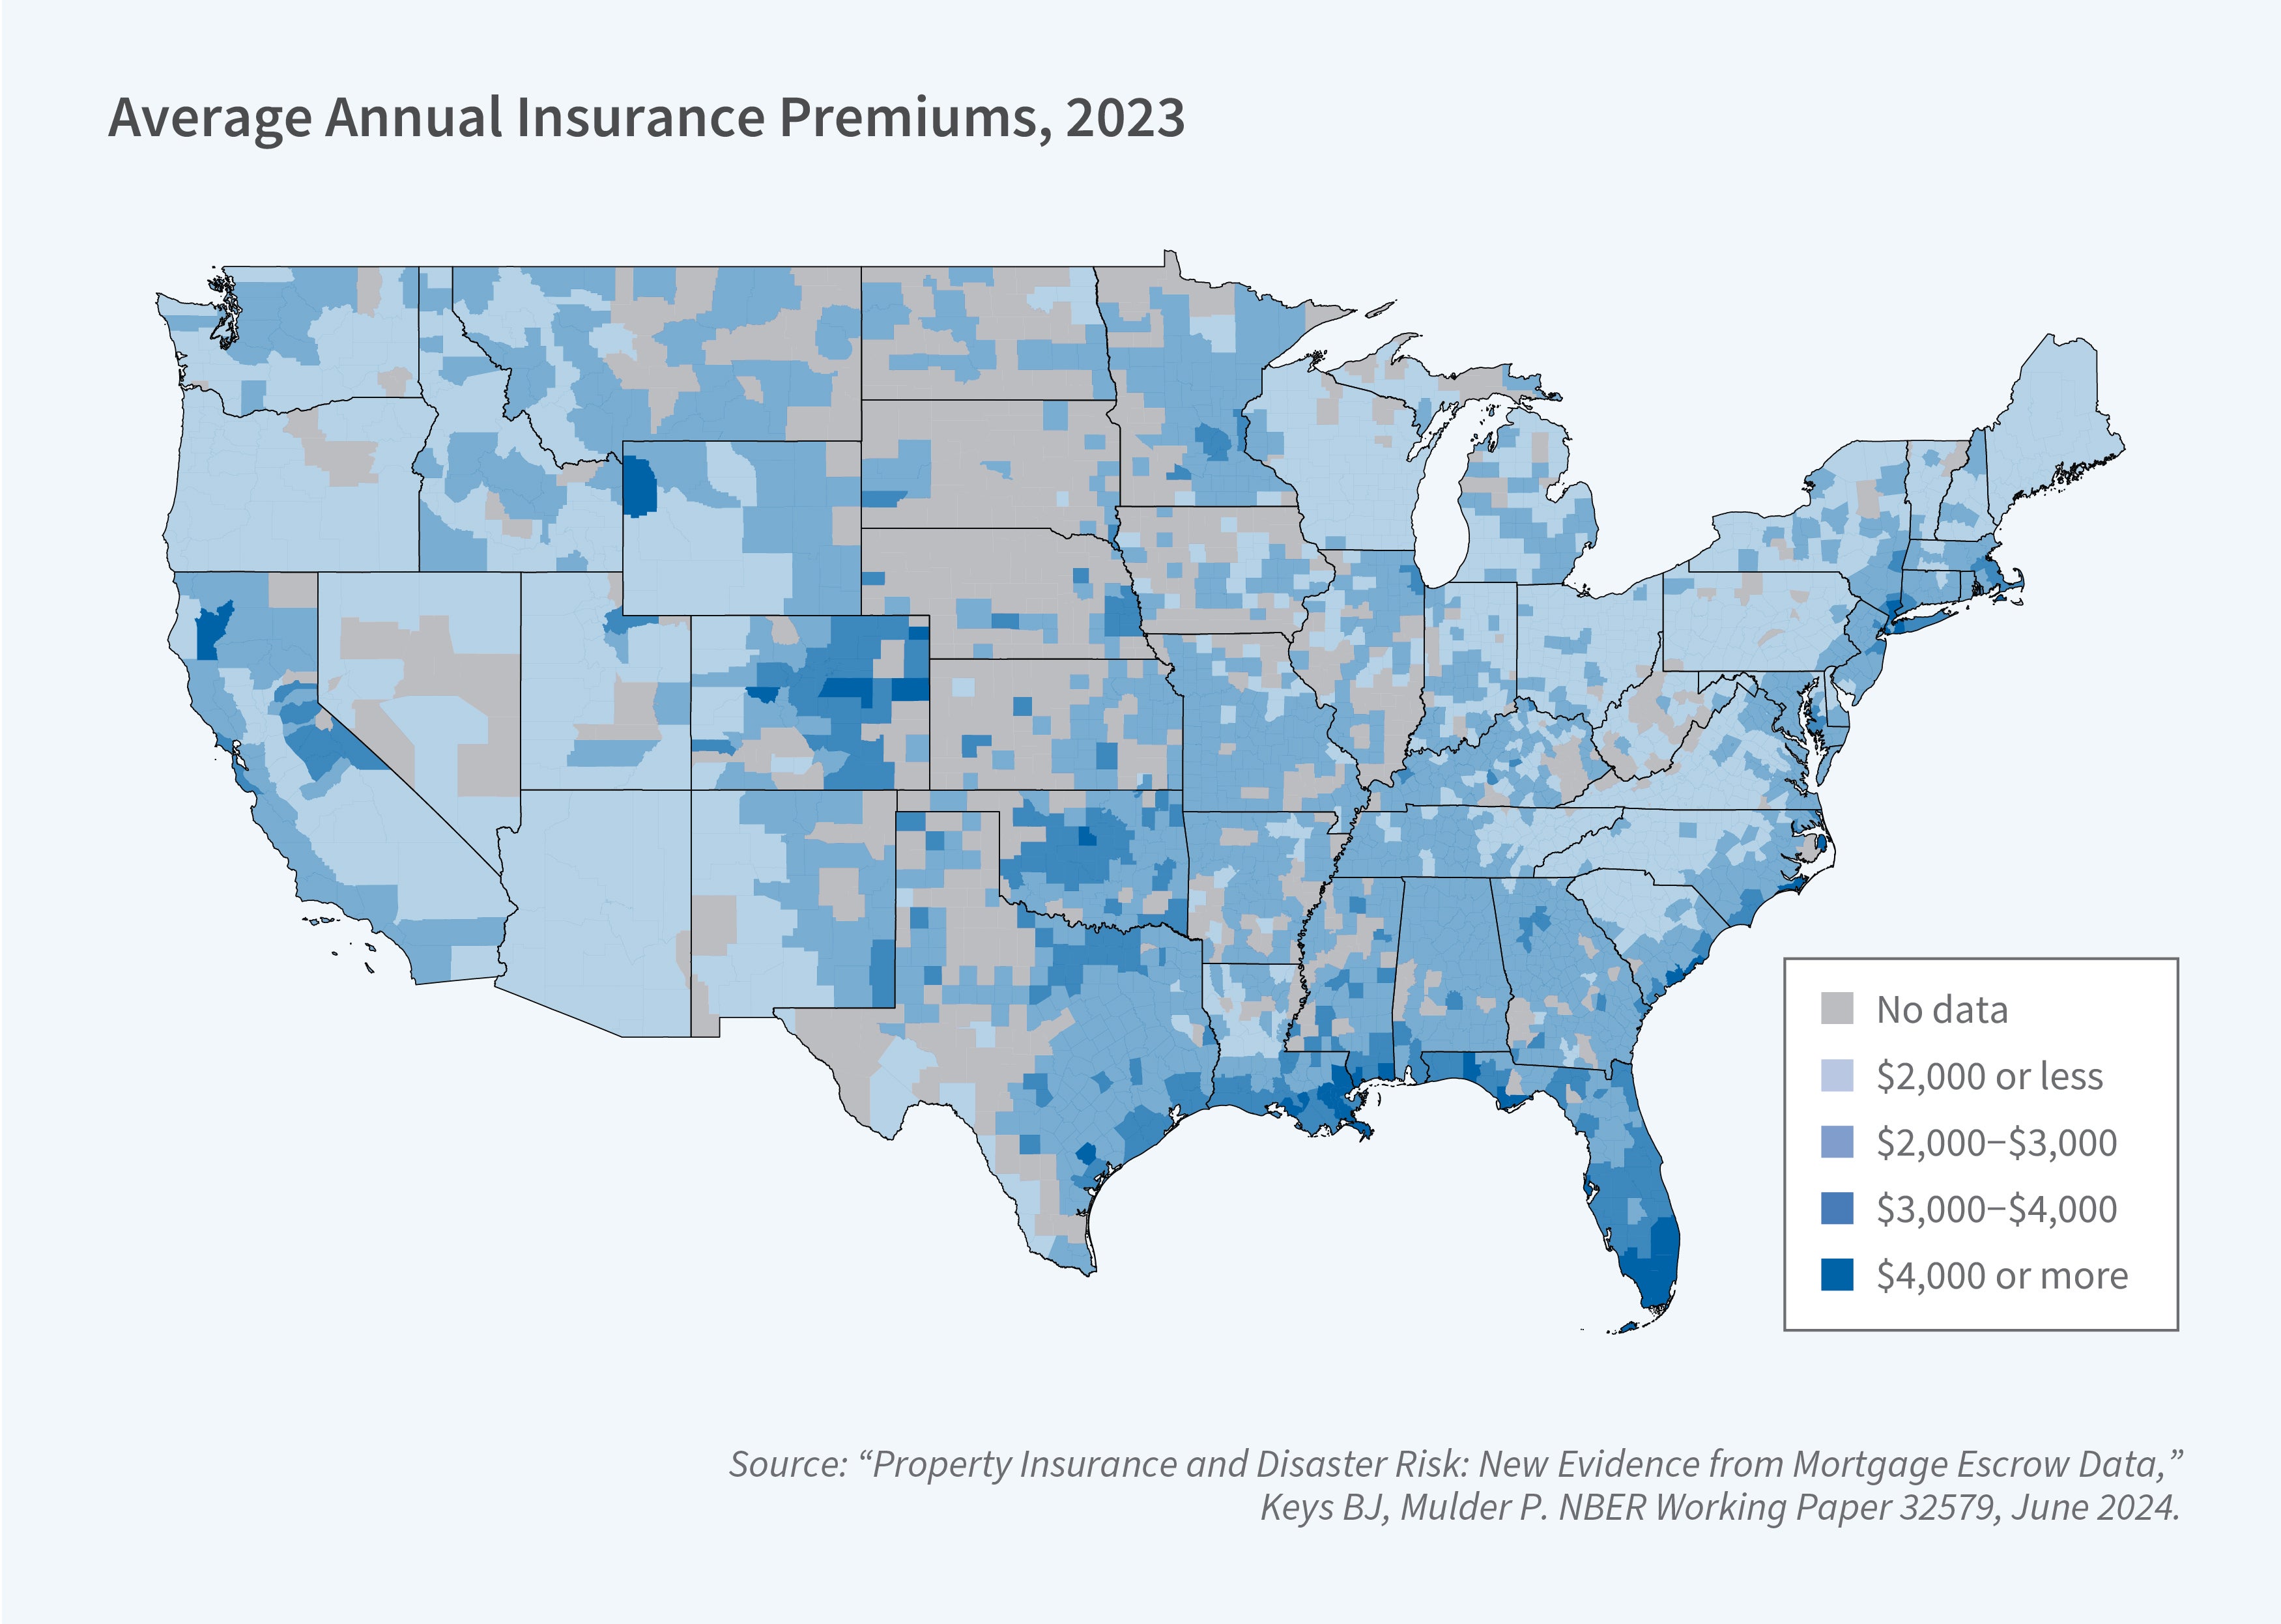
However, how property insurance markets are adapting to rising climate risk is understudied due to a lack of granular data on how much households pay for coverage. Mulder and I develop a new approach to measuring homeowners’ insurance premiums.3 We decompose mortgage escrow payments into their primary components (principal + interest + taxes + insurance) to isolate homeowners’ property insurance expenditure. Using a large database of mortgage escrow payments, we construct over 47 million observations from 2014 to 2023.
We find that average nominal premiums increased by 33 percent from 2020 to 2023, a 13 percent real increase. With the granularity of our data, we are able to produce county-level maps of the cost of insurance (shown in Figure 2) and analyze trends in premiums at the ZIP code level. We provide the first estimate of the relationship between disaster risk and premiums using within-state variation in expected disaster losses. While we find that the increase in construction costs can explain slightly over half of the rise in premiums, we also show that the largest increases were concentrated in ZIP codes with the greatest disaster risk (see Figure 3). Our estimates show that the relationship between disaster risk and premiums sharply increased, such that a 1 standard deviation increase in disaster risk is associated with a $425 increase in premiums, up from $250 in 2018. This tightening of the relationship between risk and premiums explains nearly 20 percent of the increase in premiums.
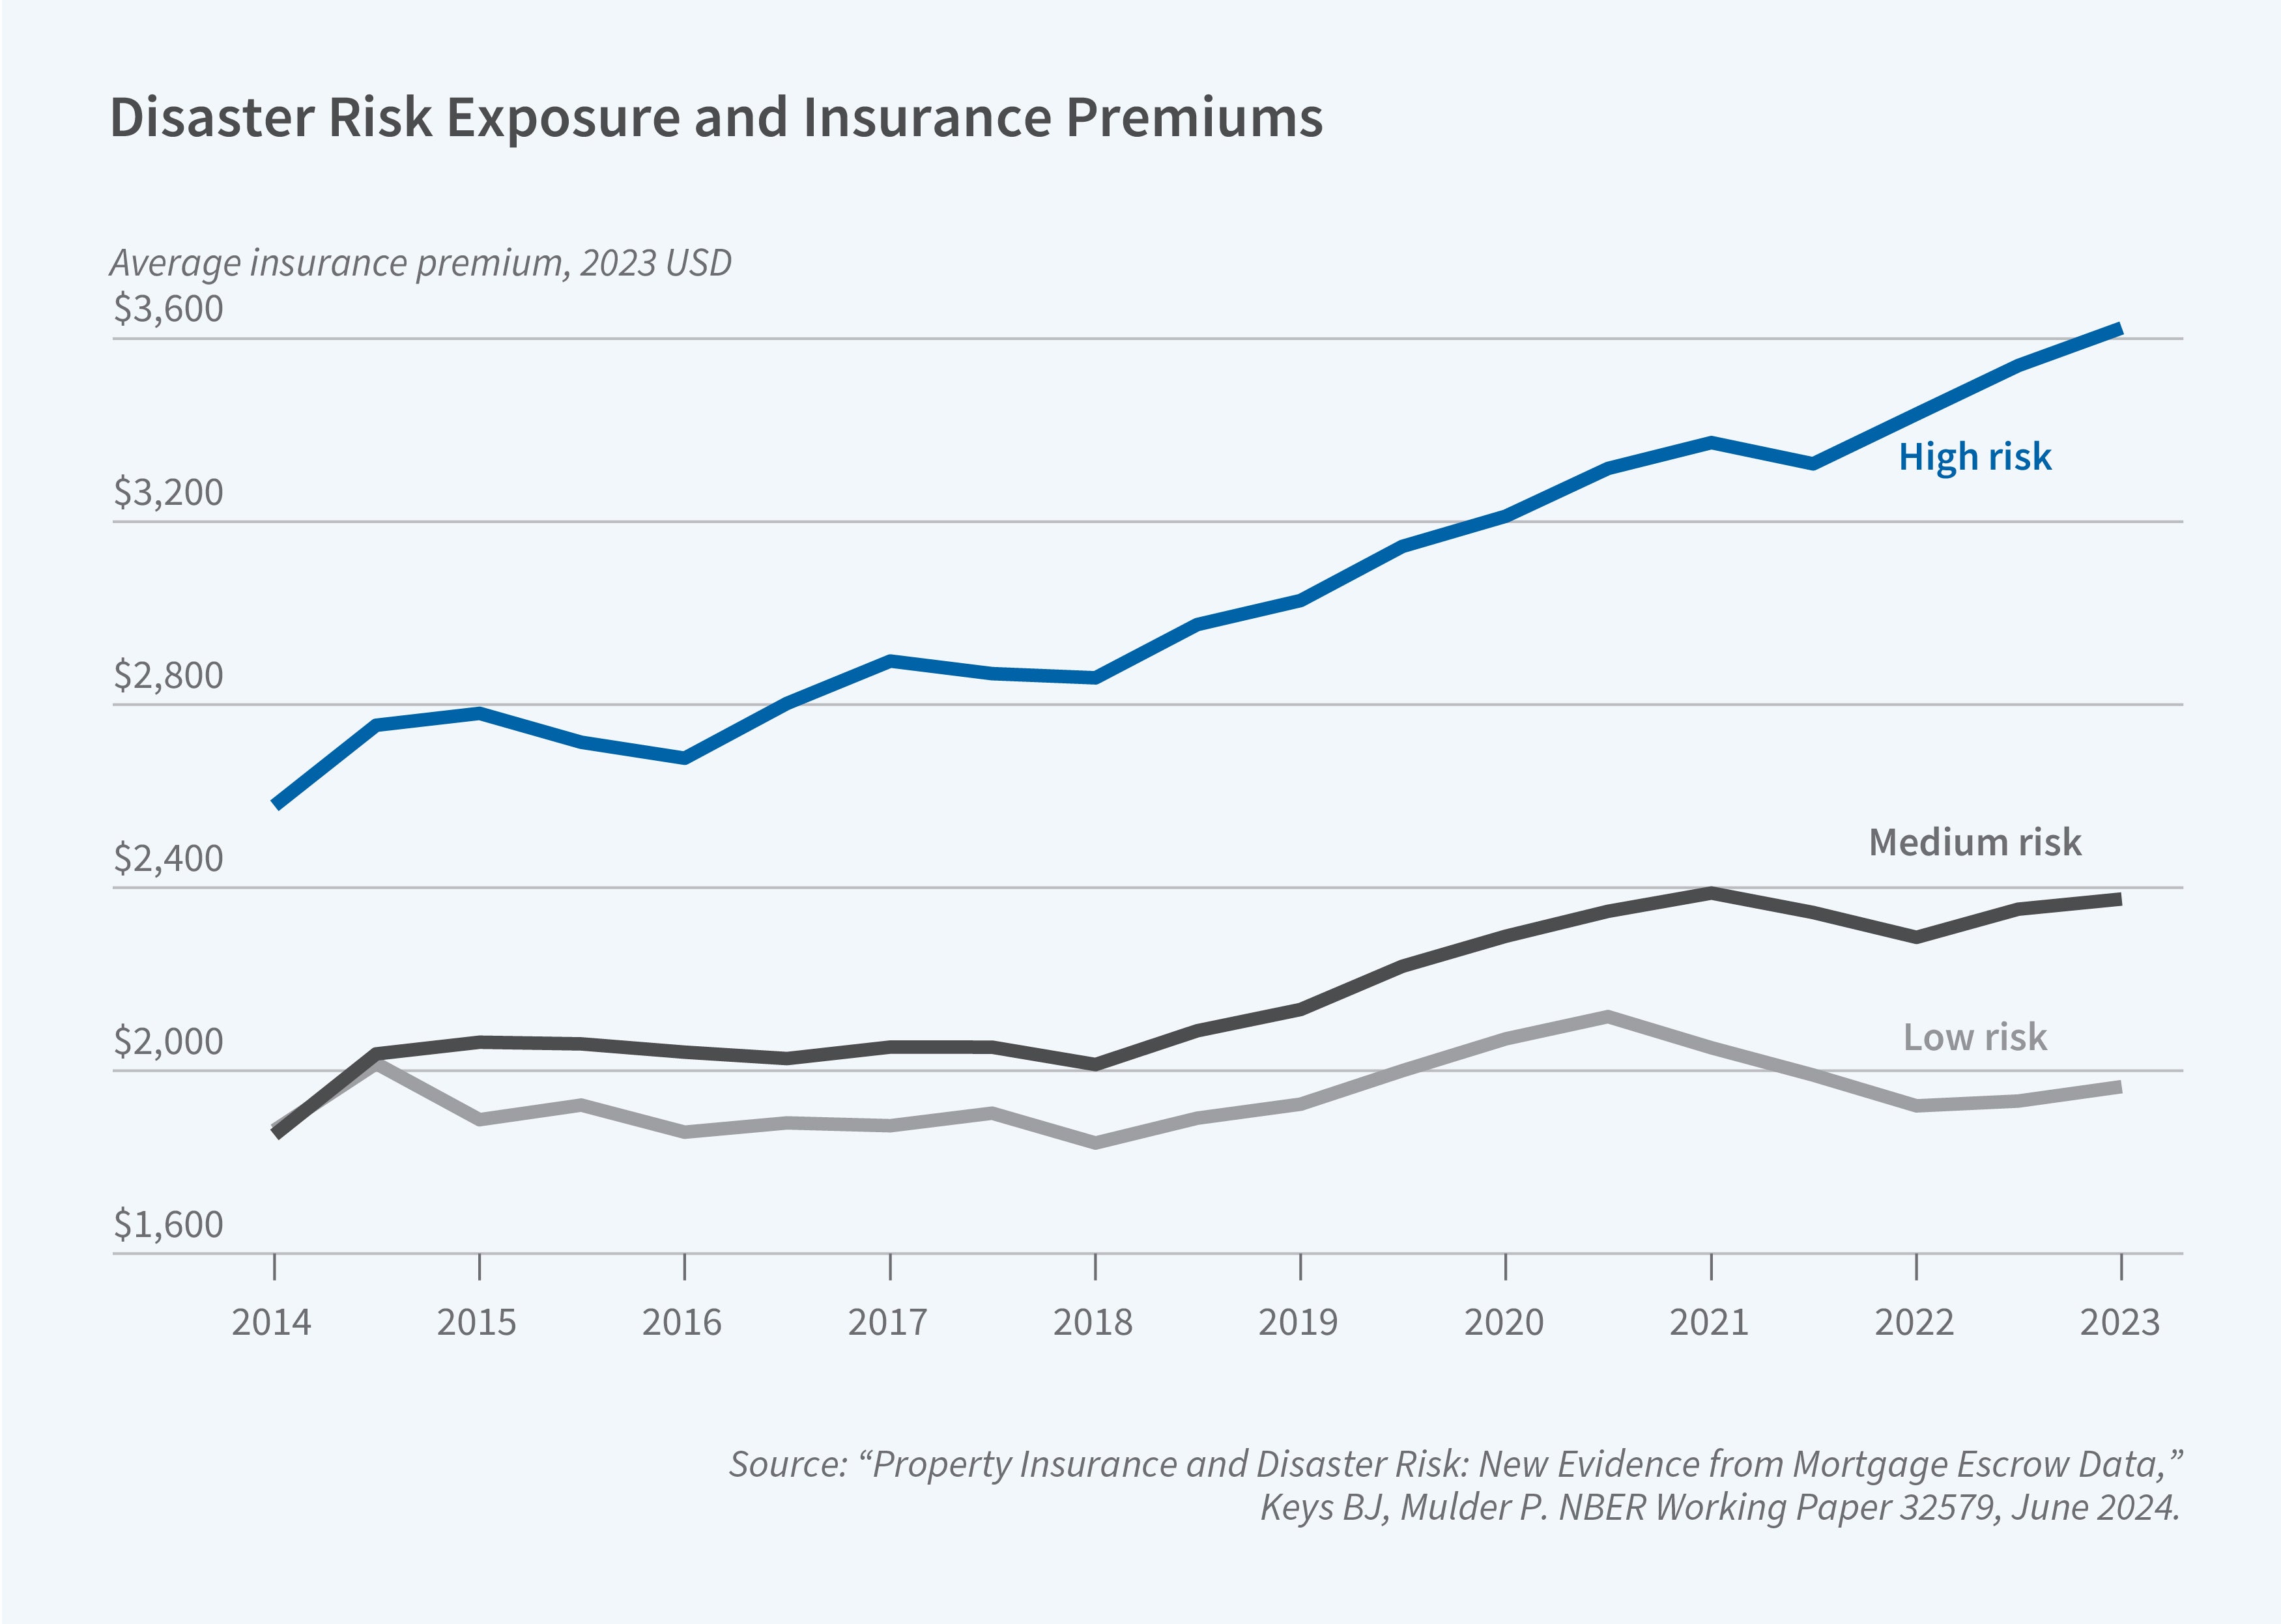
This increase in the risk-to-premium gradient coincides with a doubling of reinsurance prices between 2018 and 2023. Reinsurance draws from a global pool of capital to protect the insurance industry from insolvency and especially to insure it against concentrated catastrophe risk. We show that the dramatic shifts in reinsurance pricing associated with more frequent and severe climate-induced disasters, increased construction costs (materials and labor), and the effects of a changing interest rate environment are being passed through to homeowners’ policies in dense high-risk areas. Among the most heavily exposed ZIP codes, we estimate that the reinsurance shock increased annual premiums by nearly $300 in 2023.
Finally, we examine the capitalization of the reinsurance shock into house prices. House prices should reflect long-term expectations about the costs of insuring the home. If market participants expect this reinsurance shock to be a temporary blip, then we should expect to see little effect on home values. Instead, we find that the reinsurance shock reduced 2023 home values by an average of $8,400. The capitalization of premiums into home prices is even stronger in markets where climate risk is growing, suggesting that the reinsurance shock has shifted real estate market participants’ expectations about future premium growth.
Our work provides new estimates of the relationship between expected disaster losses and insurance premiums in the midst of recent market turmoil, and the degree of pass-through from secondary reinsurance markets to primary homeowners insurance premiums to house prices. A key takeaway is that capital market disruptions affect what homeowners ultimately pay for climate risk, thereby shaping the price signal for other adaptation or resiliency investments. Households face not only changing climate risks but also changes in the price to insure those risks.
How Do Uninsured or Underinsured Households Manage Disaster Losses?
In the aftermath of disasters, many households who are uninsured or underinsured experience large shocks to their balance sheets. In coauthored work with Benjamin L. Collier, Daniel A. Hartley, and Jing Xian Ng, I examine the effects of credit supplied by the US federal disaster loan program, which provides loans to households with uninsured damages from a federally declared natural disaster.4
The federal disaster loan program is one of the primary sources of disaster assistance to households, lending over $60 billion since its inception. Our data include 315,000 households who applied for assistance across 614 distinct federally declared disasters between 2005 and 2013. These households experienced large shocks to their balance sheets, with average uninsured damages of $80,000, or more than 110 percent of average annual income.
Using the program’s administrative data linked to credit records, we exploit a discontinuity in loan approval around a debt-service-to-income (DTI) threshold of 40 percent, which is codified in the program’s loan underwriting handbook. Applicants with a DTI just below this threshold are 20 percentage points more likely to be approved than those applicants just above it. We find that receiving a federal disaster loan persistently reduces financial distress, with approved applicants around the discontinuity 61 percent less likely to file for bankruptcy in the three years following the disaster compared to denied applicants with similar economic need and creditworthiness (see Figure 4). In addition, these loans act as complements to other private borrowing. For example, approved applicants are persistently more likely to take out a new auto loan in the years after the disaster.
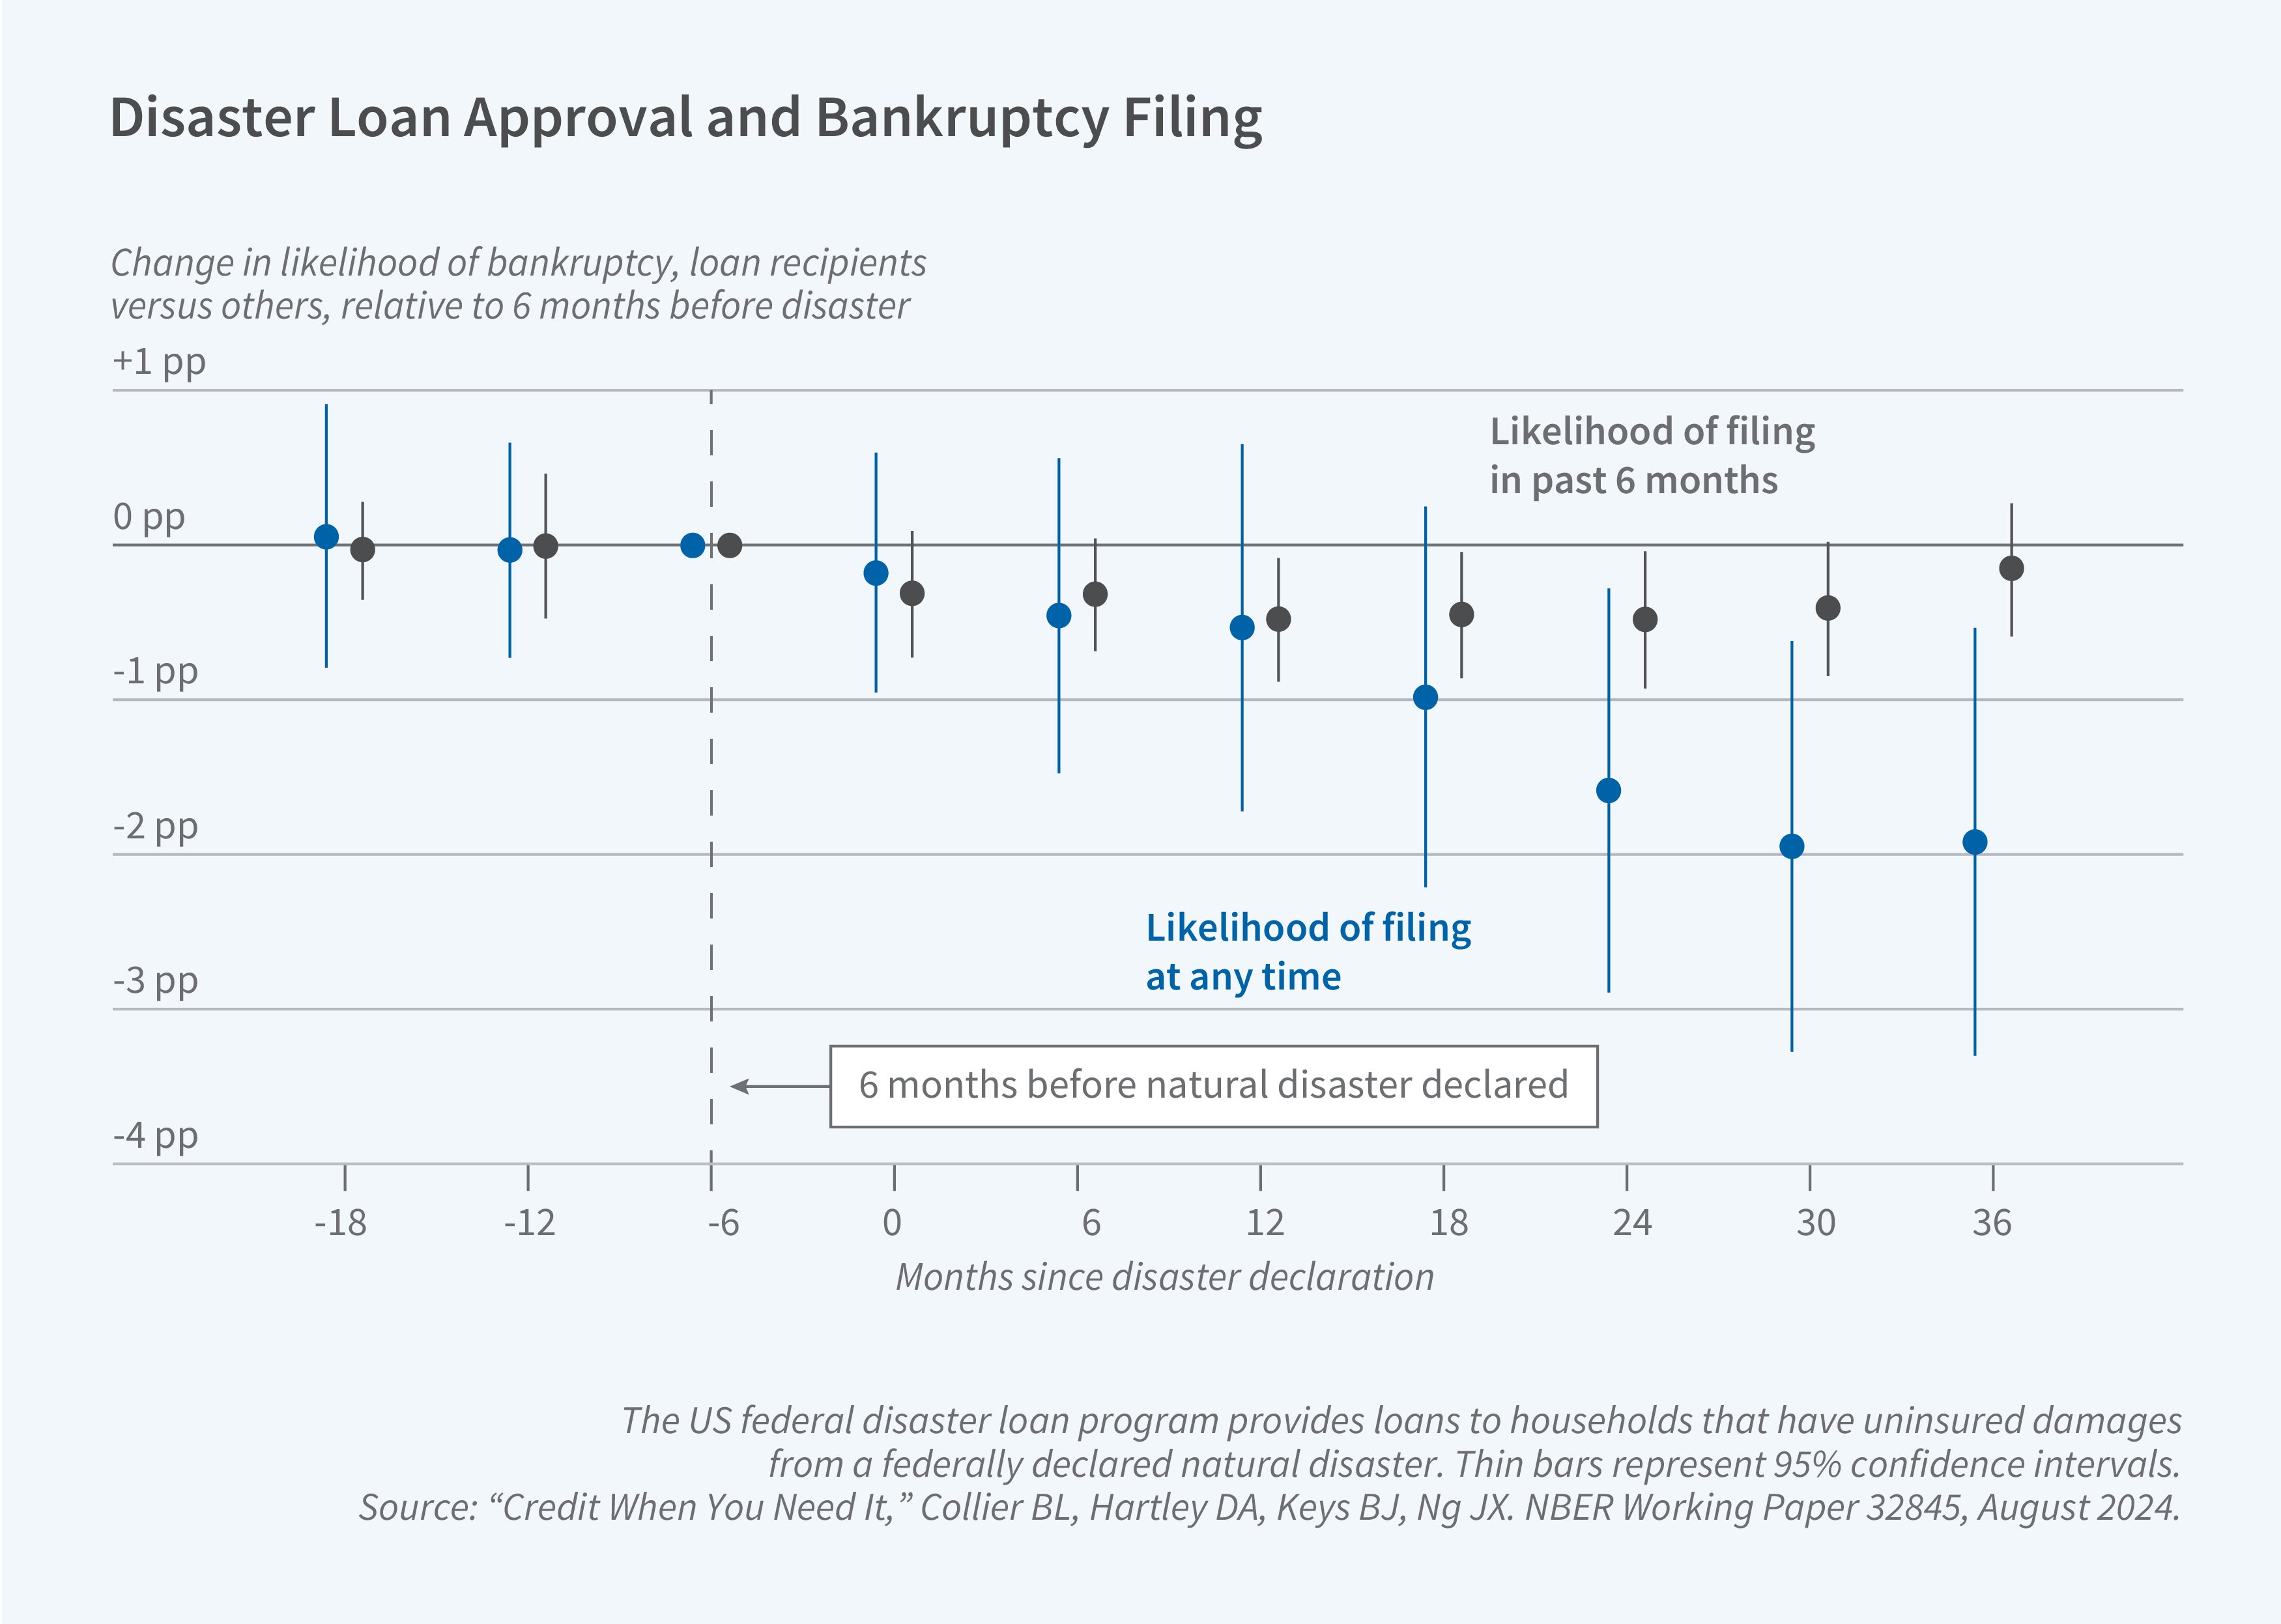
How does the program target benefits? We examine the mechanisms behind the effects of emergency credit and financial distress. The program has a number of unique features, such as a borrowing amount above which the loan must be collateralized by a lien on the house5 and two different interest rate regimes depending on household creditworthiness. Examining variation around the interest rate regime cutoff (a FICO score of 700), we find that the loan’s benefits arise from the provision of emergency liquidity rather than through the subsidization of a lower interest rate.
By matching detailed disaster loan applications with consumer credit reports for the first time, we show the benefits of liquidity provision precisely when it is most needed, a situation that is increasingly relevant as natural disasters become more frequent and severe.
A Continuing Research Agenda on Housing and Climate Risk
In a world of growing climate-induced disasters, the challenges for property markets will only intensify. Rising insurance costs are creating dilemmas both for households managing their pocketbooks and policymakers who wish to guarantee the availability of some form of insurance. Without insurance, homebuyers would be unable to qualify for a mortgage. Thus, research on how housing, mortgage, and insurance markets are being reshaped by climate risk has the potential to inform policy. Price signals from insurance premiums are the most direct information most households have on their risk, and these signals should induce responses in the form of resilience investments or exit. Further research is needed to understand the competitive forces at play in the insurance and reinsurance markets, the role of information provision in influencing home building and home buying decisions, and the trade-offs faced by regulators around the availability and affordability of protection against growing physical risk.
Endnotes
“Neglected No More: Housing Markets, Mortgage Lending, and Sea Level Rise,” Keys BJ, Mulder P. NBER Working Paper 27930, October 2020.
“Regional Redistribution Through the US Mortgage Market,” Hurst E, Keys BJ, Seru A, Vavra JS. NBER Working Paper 21007, March 2016, and American Economic Review 106(10), October 2016, pp. 2982–3028.
“Property Insurance and Disaster Risk: New Evidence from Mortgage Escrow Data,” Keys BJ, Mulder P. NBER Working Paper 32579, June 2024.
“Credit When You Need It,” Collier BL, Hartley DA, Keys BJ, Ng JX. NBER Working Paper 32845, August 2024.
“The Cost of Consumer Collateral: Evidence from Bunching,” Collier BL, Ellis C, Keys BJ. NBER Working Paper 29527, November 2021, and forthcoming in Econometrica.


