Safety Net Program Interactions and Impacts on Low-Income Families
The US safety net is a patchwork of interacting programs providing cash and in-kind transfers to low-income individuals and families. Our research investigates how these programs interact with one another and how the generosity of the full safety net package affects well-being, taking into account these interactions.
The United States has a long history of federalism in its means-tested tax and transfer programs, as in other domains. The safety net includes a number of federally funded or partially state-funded programs with rules surrounding eligibility and generosity that vary at the state level. Among programs offering cash assistance, Temporary Assistance for Needy Families (TANF), which provides cash transfers and other supports to low-income families with children, is one in which states have particularly wide latitude to determine parameters. Supplemental Security Income (SSI) is a federal transfer program for low-income individuals with disabilities, but some states supplement the federal benefit with additional payments. Similarly, the Earned Income Tax Credit (EITC) is a federal refundable tax credit for low-income working households, and more than half of states offer additional EITC support through the state income tax code. The upshot is that similarly situated families may end up receiving different levels of cash transfers depending on the state in which they live.
In-kind safety net programs also exhibit differences across states. For example, the Supplemental Nutrition Assistance Program (SNAP, formerly known as the food stamp program) has consistent eligibility and benefit formulas across the continental United States, but benefit amounts are affected by state-varying cash transfer program generosity. The Medicaid program (including the Children’s Health Insurance Program, or CHIP) has varying income eligibility thresholds for public health insurance across states, partially driven by differential state expansion of eligibility under the 2010 Affordable Care Act (ACA).
Safety Net Generosity and the Relationships between Programs
Though each major safety net program has unique eligibility rules, there is considerable overlap in participation across programs, due in part to the fact that safety net programs target partially intersecting low-income populations. In addition, participation in one program may directly affect eligibility for others: recipients of one program may be categorically eligible for another program, or transfers received from one program may count as income in determining eligibility and benefits for another program. Programs may also incentivize or disincentivize labor supply, thereby affecting income and eligibility for other programs. Furthermore, the act of applying for one program may lower the information or transaction costs associated with applying to other programs, which may impact take-up conditional on eligibility.
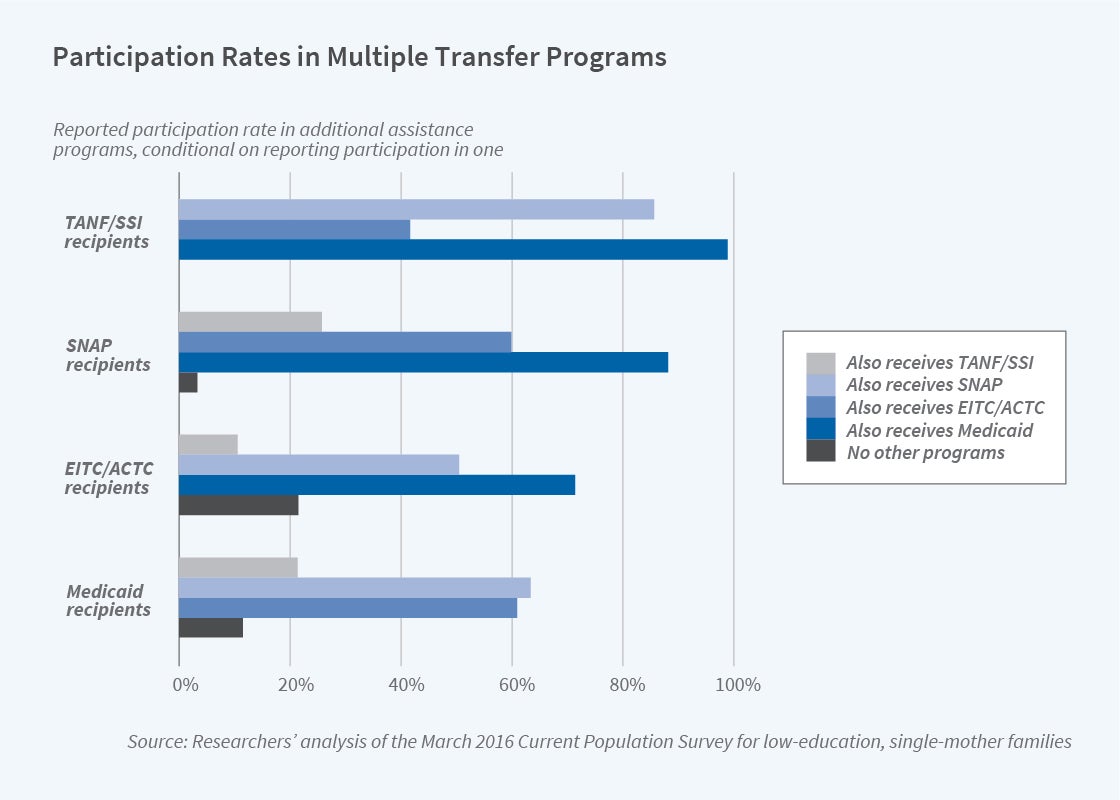
Figure 1 illustrates the 2016 participation in major safety net programs for a sample of single-mother families in which the mother has a high school degree or a lower level of education. For participants in each program, we show the conditional participation in other programs reported in the Current Population Survey (CPS), as well as the probability of participating in none of the other programs considered. (We assume 100 percent take-up conditional on imputed eligibility for the refundable tax credits, EITC, and the Additional Child Tax Credit [ACTC], because the CPS does not report take-up for tax-related benefits.) Among less-educated single-mother families with a family member enrolled in Medicaid, 63 percent also receive SNAP, 21 percent receive SSI or TANF transfers, and 61 percent of families are eligible for refundable tax credits. Only 11 percent of families with a member enrolled in Medicaid do not participate in any of these other programs. Similar patterns arise among participants of other major programs. It is therefore important to understand and account for these relationships across programs when considering the design and impact of the safety net.
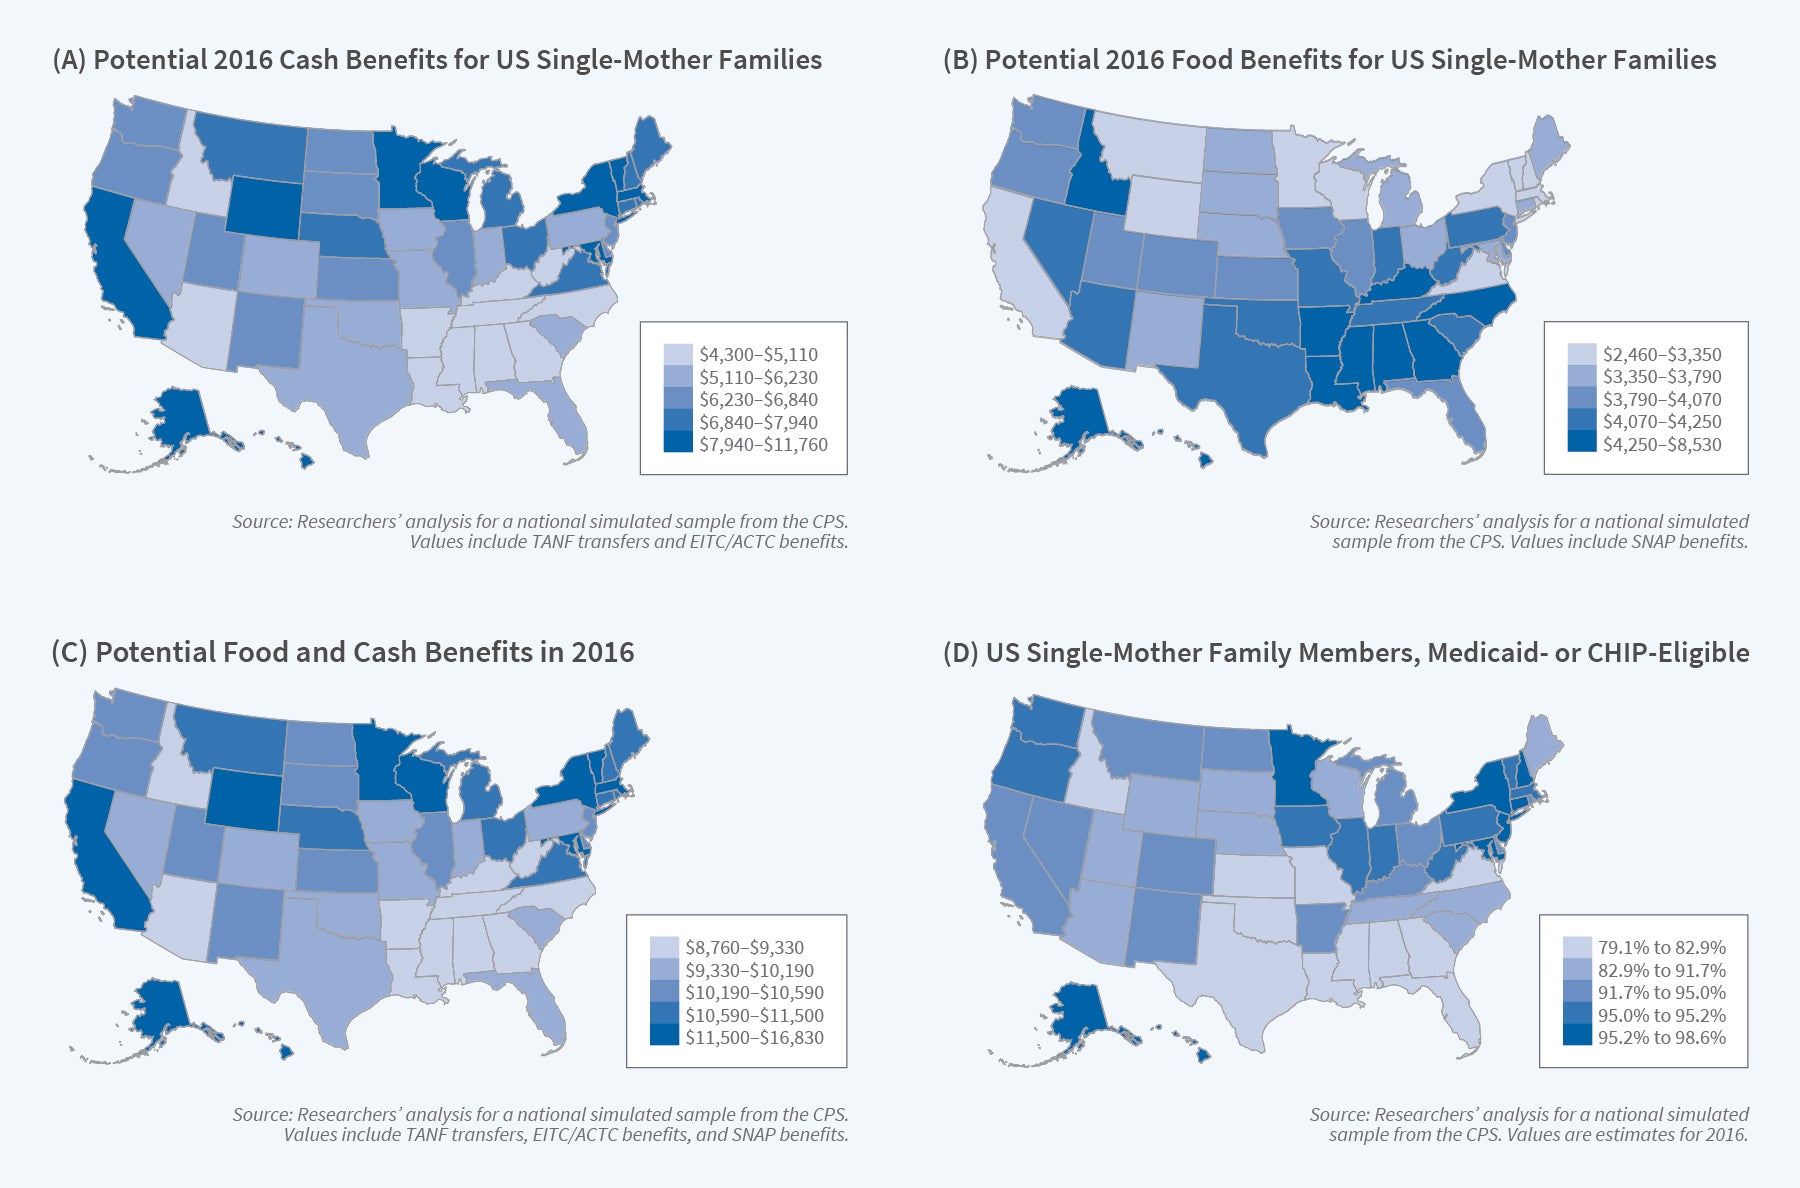
To model interactions across programs, we created a benefits calculator that accounts for these interactions for five major safety net programs (TANF, SSI, EITC/ACTC, SNAP, and Medicaid/CHIP). We use this calculator to illustrate state differences in safety net generosity in Figure 2. Specifically, we use the CPS to generate a national sample of single-mother families in which the mother is a US citizen and high school graduate without disabilities who has two or more children, including at least one under the age of 6. We then use our multiprogram calculator to estimate how much the families in this national sample would have been eligible for cash and in-kind benefits in each state in 2016 based on policy variation across states.
Panel A of Figure 2 shows the average annual potential cash benefits, including TANF transfers and state and federal refundable tax credits, for this simulated sample across the states. It reveals pronounced differences in state generosity. The bottom quintile of states in terms of generosity, which tend to be concentrated in the South, provide less than $5,110 on average, whereas the 10 most generous states offer at least $7,940 in average potential cash benefits to comparable families. State differences in TANF and EITC policies have a substantial impact on the average annual cash benefits available to low-income families.
In addition to these cash programs, in-kind benefits are an increasingly important component of the safety net. Though SNAP uses the same food assistance benefit formula across all states, other than Alaska and Hawaii, some state-varying cash transfers such as TANF are considered when determining SNAP eligibility and benefit amounts. The implication is that households in states with less generous cash welfare programs will tend to receive more in federal food benefits, as shown in Panel B of Figure 2. The southern states with low levels of cash benefits therefore have higher levels of food benefits. The federal food benefits only partially offset inequity in state generosity, however, as shown in Panel C of Figure 2. The $2,830 gap between the 20th and 80th percentile states in cash benefits is narrowed to $2,170 when cash and food benefits are combined.
Medicaid is another in-kind program with eligibility thresholds for public health insurance varying across states for children, parents, and other adults. Using the same simulated sample, Panel D of Figure 2 shows the average fraction of family members imputed to be eligible for Medicaid (or CHIP) in 2016. A 2012 Supreme Court decision made ACA Medicaid eligibility expansions to all those with income under 138 percent of the federal poverty line optional, and states that had not taken up the ACA expansion are concentrated in the bottom two quintiles of Medicaid generosity. In states that have generous eligibility rules for parents and children and have also implemented the ACA expansion, most family members in the simulated sample are eligible for public health insurance.
How Does the Safety Net Affect Well-Being?
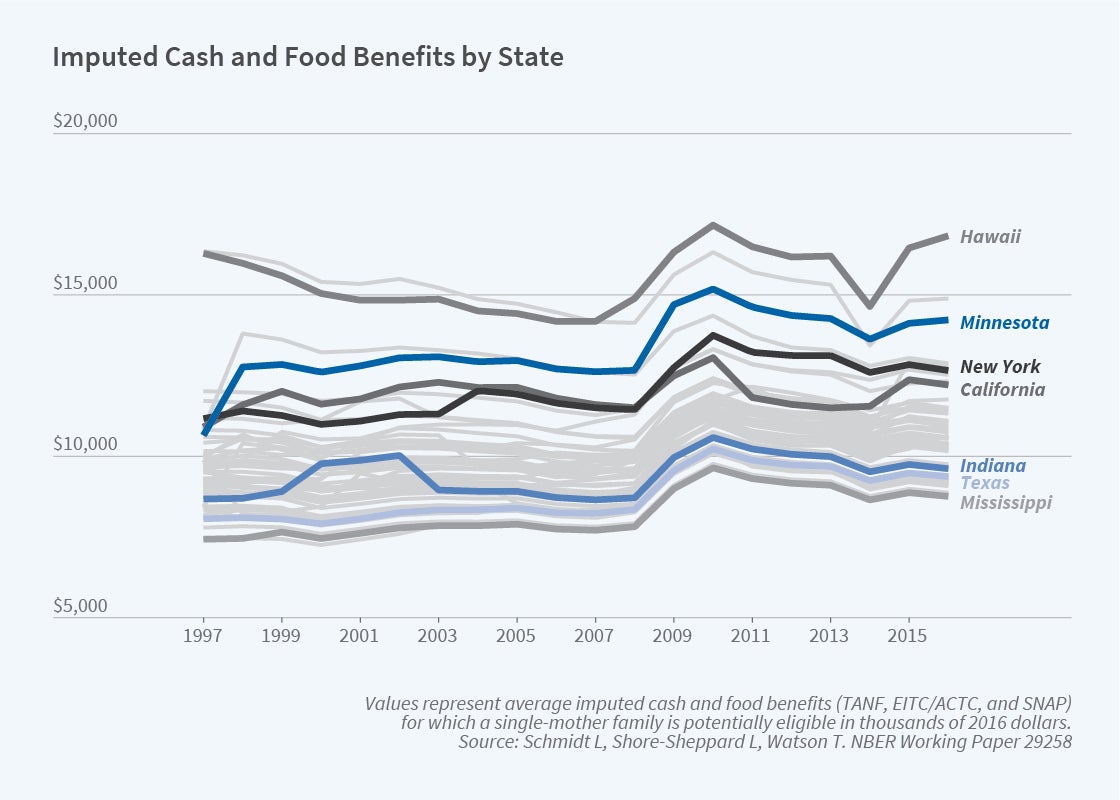
We use our multiprogram calculator to examine how the safety net affects the well-being of individuals and families. Taking into account interactions in program eligibility in the calculator, we use variation in generosity for a simulated sample. Figure 3 illustrates that policy-induced state safety net generosity varies not only across states but also differentially within states over time for a given demographic cell — in this case, single-mother families in which the mother is not disabled, has a high school degree, and has at least two children, at least one of whom is under age 6. Further variation arises because policy changes differentially affect families of different family structures and education levels.
In one study, we use the changing generosity of the package of cash and food benefits across states, years, and demographic cells to examine food insecurity in single-parent families.1 Food insecurity is measured by a standard battery of questions in the CPS and indicates inconsistent access to a sufficient quantity or quality of food for a healthy, active lifestyle. We estimate how the mean simulated benefits available in a state and year, and for a demographic cell, affect measured food insecurity. Among nonimmigrant, low-income single-parent families, $1,000 in potential cash and food benefits reduces the incidence of food insecurity by 1.1 percentage points from a baseline level of food insecurity of 33 percent.
In a more recent study, we use a similar approach to examine maternal mental health and risky health behaviors.2 The economic uncertainty that single parents face can lead both to mental health problems and to risky behaviors such as smoking and heavy drinking. By increasing family economic resources, the safety net may improve maternal well-being and mental health, but factors such as internalized stigma or a stressful assistance application process could cause psychological distress associated with program participation. The work incentives inherent in some programs may also have positive or negative mental health impacts. Mental health impacts may materialize as increased risky behaviors, or there may be direct effects of increased resources on these behaviors. Examining reported psychological distress, smoking, and drinking behavior from government survey data, we find that higher cash and food benefits are associated with reductions in severe psychological distress of single mothers. Further analyses indicate that tax credits play a substantial role in reducing psychological distress, especially in the first half of the year, when tax credits are typically received. Safety net benefits appear to have mixed effects on risky behaviors.
We are continuing our work in this area, using the calculator to explore impacts of the broad safety net on maternal labor supply, time use, and living arrangements, as well as examining the impact on the distribution of after-tax and transfer income.
How Changes in One Program Affect Participation in Others
A second strand of our recent work looks directly at the effects that a change in eligibility for one safety-net program can have on participation in other programs. We rely on quasi-experimental changes in Medicaid eligibility arising from differential state decisions regarding expansion under the ACA. Prior to the ACA, most working-age adults without dependent children were categorically ineligible for Medicaid, and many parents did not meet their state’s income eligibility criteria. The substantial change in eligibility for public health insurance could impact participation in other programs.
One investigation focuses on disability programs, SSI and SSDI (Social Security Disability Insurance, a disability insurance program that is not means-tested and requires sufficient work history).3 To qualify for both programs, individuals must demonstrate that they have a physical or mental disability that limits their ability to conduct substantial gainful activity. However, individuals with disabilities may be reluctant to leave a job and apply for benefits because they would lose their employer-sponsored insurance. By offering an alternative source of health insurance coverage during the application period, expansions in Medicaid could increase applications to disability programs. On the other hand, if individuals were using SSI and SSDI to gain access to public health insurance for which they confer eligibility, expanded access to Medicaid might discourage participation.
We use county-level administrative data to estimate the relationship between Medicaid eligibility and applications to disability programs. In addition to a two-way fixed effects design comparing changing income eligibility thresholds, we also implement a border county pair design, examining differential changes in Medicaid eligibility in adjacent counties on either side of a state border. This border county pair design limits spurious effects of local labor market conditions that may be correlated with Medicaid expansion decisions.
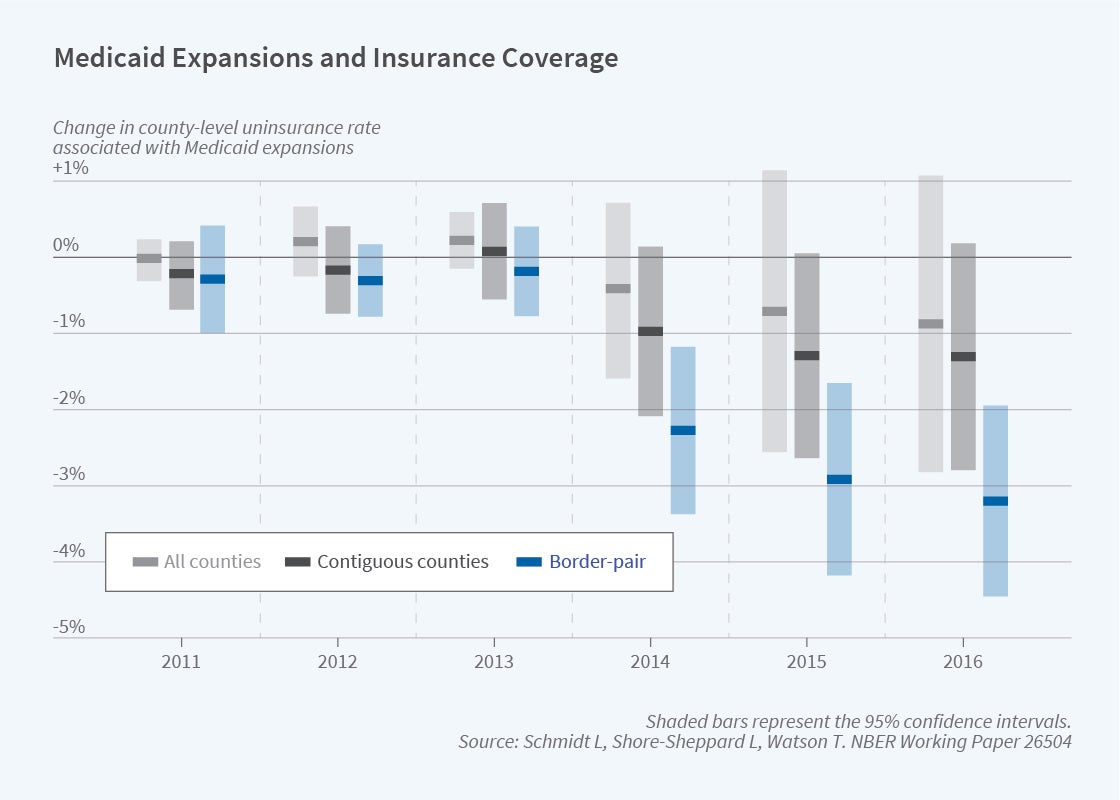
For example, Figure 4 illustrates the effect of being in an expansion state on uninsurance, based on the county-level Small Area Health Insurance Estimates produced by the US Census Bureau. The figure shows coefficients from a regression that interacts a binary “ever-expanded” variable with year dummies to show the evolution of expansion counties over time, relative to 2010. The typical state expanded in 2014; the full analysis reported in the study also takes into account differential expansion timing and differing income eligibility limits. For the simplified analysis shown in Figure 4, the estimates shown in light grey are based on county fixed-effect regressions that include all counties in the continental United States, and the estimates in dark grey are based on regressions restricted to border counties that have an adjacent county across state lines. Our preferred specification, graphed in blue, represents effects after controlling for border-pair-by-year effects. Compared to adjacent counties in nonexpansion states, there are pronounced reductions in the number of uninsured around 2014 in counties of expansion states.
How did ACA expansions affect other programs? The standard fixed effects approach hints at a positive relationship between Medicaid expansion and SSI disability program applications. However, using the preferred border county design, the results suggest no net effects of Medicaid expansion on applications to either program. SSI applications did not systematically differ between expansion counties and adjacent, nonexpansion counties. In the full study, a similar null effect is reported for SSDI.
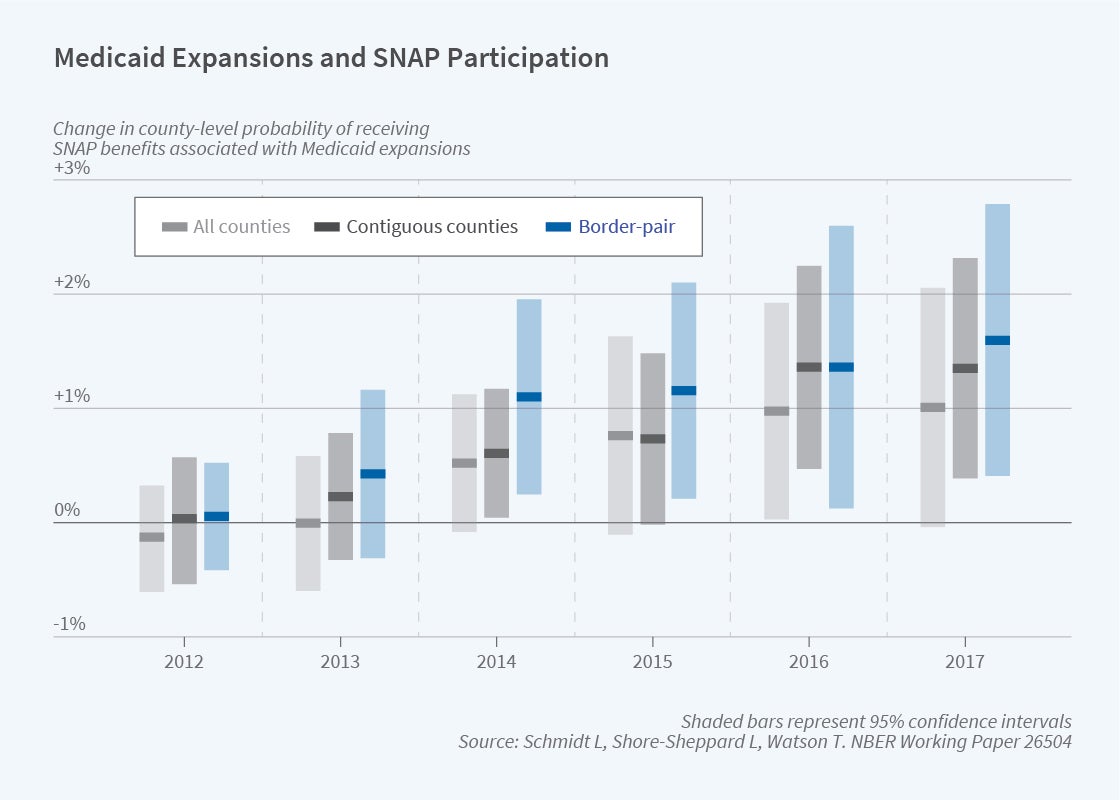
In a different project, we examine impacts of Medicaid expansions on SNAP, EITC, and TANF participation, again focusing on changes in eligibility at state borders.4 Given income eligibility limits, theory predicts that a change in labor supply arising from the expansion would likely increase SNAP and EITC participation. Medicaid eligibility could also affect take-up of the other programs conditional on eligibility by reducing information or transaction costs. In addition to using administrative counts for both programs, we explore SNAP participation using American Community Survey (ACS) data. Instead of a county-border pair design, we rely on borders of consistently identified Public Use Microdata Areas. Using the preferred specification shown in blue in Figure 5, the results suggest substantial positive impacts on SNAP participation. We also find positive impacts on TANF and modest but imprecise impacts on EITC. We see little to no labor supply response; the results are driven primarily by Medicaid eligibility increasing SNAP participation among those who are income eligible.
Conclusion
There are three broad lessons we take away from this research. First, interactions across programs can be important and should not be overlooked. It is tempting for researchers to analyze one program at a time, but this misses the full picture in a system of partially overlapping safety net programs. For example, more generous cash benefits mechanically reduce food assistance, so related programs should be considered simultaneously when evaluating the impact of a policy change to one program. Second, it is important to take into account program interactions and integration when considering a change in policy. For example, states considering expanding public health insurance eligibility might take into account spillovers onto rates of participation in federal food assistance. Such broad considerations can pose a challenge when programs have different historical origins, serve only partially overlapping client bases, and are institutionally housed in different agencies. Finally, taken as a whole, our research contributes to a growing body of evidence demonstrating that the safety net has measurable impacts on the well-being of low-income families.
Endnotes
“The Effect of Safety Net Programs on Food Insecurity,” Schmidt L, Shore-Sheppard L, Watson T. NBER Working Paper 19558, October 2013, and Journal of Human Resources 51(3), Summer 2016, pp. 589–614.
“The Effect of Safety Net Generosity on Maternal Mental Health and Risky Health Behaviors,” Schmidt L, Shore-Sheppard L, Watson T. NBER Working Paper 29258, September 2021.
“The Impact of the ACA Medicaid Expansion on Disability Program Applications,” Schmidt L, Shore-Sheppard L, Watson T. NBER Working Paper 26192, August 2019, and American Journal of Health Economics 6(4), Fall 2020, pp. 444–476.
“The Impact of Expanding Public Health Insurance on Safety Net Program Participation: Evidence from the ACA Medicaid Expansion,” Schmidt L, Shore-Sheppard L, Watson T. NBER Working Paper 26504, revised December 2021.


