Program Report: Productivity, Innovation, and Entrepreneurship, 2021
The Productivity, Innovation, and Entrepreneurship (PIE) Program was founded as the Productivity Program, with Zvi Griliches as the inaugural program director, in 1978. The program benefited tremendously from Griliches’ inspirational leadership, which was continued by Ernst Berndt. In recent years, the program has expanded to incorporate the vibrant and growing body of research in the affiliated fields of innovation and entrepreneurship.
With the generous support of the Ewing Marion Kauffman and Alfred P. Sloan Foundations, the program has generated a large and diverse volume of research activity. Currently, 128 researchers are affiliated with the PIE Program. Since the last program report, in September 2013, affiliates have distributed more than 1,050 working papers and edited or contributed to several research volumes, including the annual Innovation Policy and the Economy series.
The activities of the program are organized into four large project areas: economic research on the measurement and drivers of productivity growth; innovation, which examines R&D, patenting, and creative activities; entrepreneurship, which focuses on the measurement, causes, and effects of new business creation; and digitization, which focuses on the creation, use, and impact of digital information. This review summarizes the research in the first three of these areas.1 In the interest of space, we will not detail the PIE group’s many activities, including boot camps for graduate students and an annual conference in Washington that communicates research findings to the policy community.
Productivity
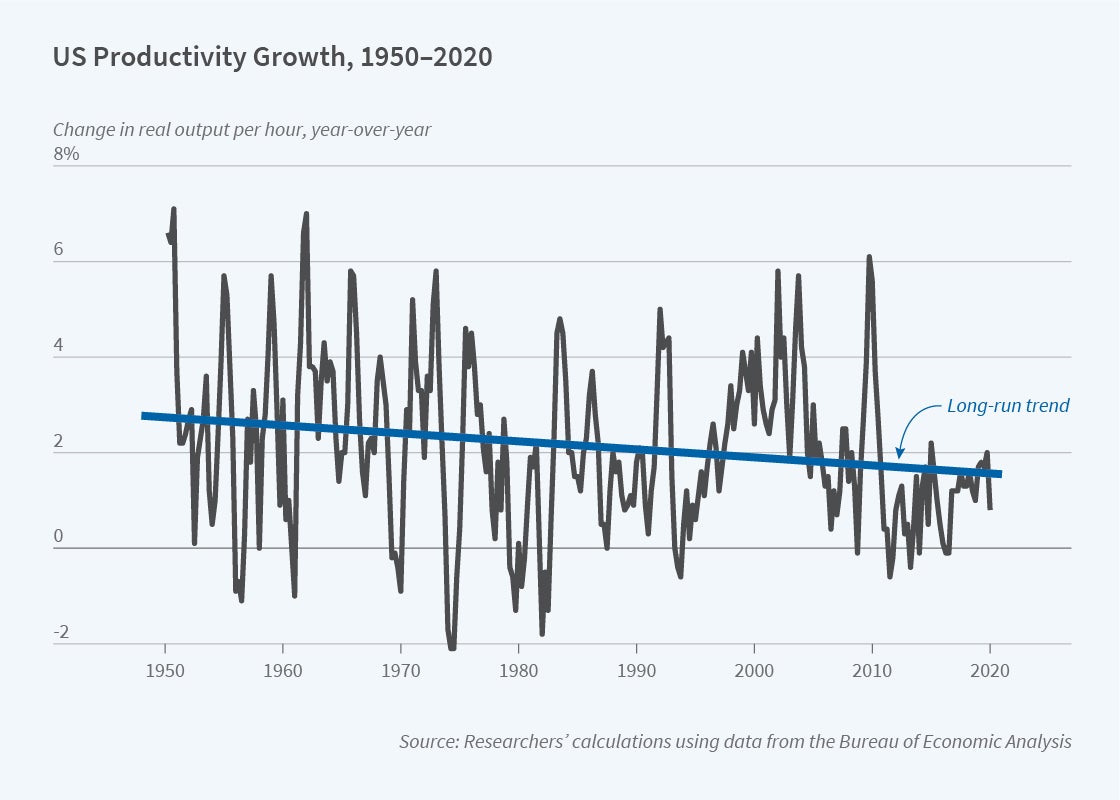
Recent years have seen growing concerns that US gross domestic product (GDP) growth is slowing. A factor that accounts for about half of this slowdown is the decline of labor productivity growth [Figure 1], which fell by roughly half, from 3 percent to 1.5 percent, between 1950 and 2019. The other half of slowing growth is due to declining growth of labor hours, due roughly equally to declining population growth and declining labor force participation.2 National productivity is defined as the amount of GDP that can be obtained with a given set of inputs. In this sense, productivity growth is “growth by inspiration” in that it yields more from less, in contrast to growth from increasing the use of inputs, which has been labeled “growth by perspiration.” As such, productivity growth is critical to driving long-run increases in the standard of living.
One immediate question is whether the productivity growth slowdown is real. An alternative view is that the observed slowdown in productivity growth could be an artifact of some measurement issue such as the increasing importance of online activity, much of which may not be recorded in conventional GDP statistics. Several recent studies argue against this view: they conclude that the decline in productivity growth is real, rather than due to measurement issues in inputs and outputs, transfer pricing, or cyclical issues related to the end of the 1990s information technology boom.3
This then leads to another question: what is driving the fall in productivity? Robert Gordon argues that a combination of headwinds accounts for this slowdown.4 One is the slowing growth of educational attainment, which began around 1980 with the annual growth rate of the percentage of the population completing high school falling from 3.3 percent per year until 1980 to only 0.2 percent after 1980, with similar slowdowns in college enrollment growth.
The second headwind Gordon highlights is the slowdown of productivity growth after the end of the Great Inventions Era. He argues that inventions such as sanitation, antibiotics, steam and electric power, radio, telephone, and air conditioning drove rapid national growth during the first part of the 20th century, and that comparably high-impact inventions have not been produced as frequently in recent years. Nicholas Bloom, Charles Jones, John Van Reenen, and Michael Webb build on this idea, arguing empirically that new ideas like these great inventions are becoming increasingly hard to find.5 They document that innovation output per R&D dollar or per scientist is falling, perhaps because the lower-hanging fruits on the knowledge tree are getting plucked over time.
A final, more positive headwind may be that the huge productivity benefits derived from modern information communication technologies (ICT) like computers, the internet, and smartphones take time to show up in national productivity. Erik Brynjolfsson, Daniel Rock, and Chad Syverson argue that since it took almost 50 years in the first half of the 20th century to incorporate electricity fully into modern factories and offices, we should be more patient in looking for the productivity impact of ICT.6 This is the ICT productivity J-curve — an initially slow productivity impact as society has to reorganize to use these new technologies efficiently, but a longer-run acceleration once they are effectively exploited.
Following this narrative, a reasonable outlook is that these modern great inventions will eventually raise productivity growth, overcoming some of the first two headwinds. But it may take another 10 or 20 years for society to reorganize itself to exploit them. Of course, one step toward that has potentially been the massive shift to working from home during the pandemic, for which ICT has been invaluable.7 Indeed, one could argue this almost certainly improved productivity versus any pre-computer version of working from home, so in that sense the enormous productivity impact of modern ICT has already begun.
Innovation
A second focus of academics and policymakers in recent years has been trying to understand the causes and consequences of rising inequality in the United States and other developed countries.8 From an innovation policy perspective, several questions are of interest. Have innovation policies — such as government-awarded market power through patents and antitrust policy decisions — contributed to the observed rise in inequality? How does inequality at a societal level impact who becomes an inventor and what they invent? Tremendous progress is being made in developing new conceptual frameworks, datasets, and empirical approaches to tackle these questions at both the macro and micro levels.
At the macro level, two recent studies consider how innovation affects inequality in Schumpeterian growth models.9 One of these studies also leverages variation in the composition of the US Senate Committee on Appropriations to empirically test for a causal link between innovation and inequality, and argues that a 1 percent increase in patents increases the top 1 percent’s income share by 0.2 percent.10
At the micro level, research in fields such as health economics and labor economics has provided evidence on how innovation affects inequality. David Cutler, Ellen Meara, and Seth Richards-Shubik point out that when the most common causes of death vary across demographic groups, a policy of equalizing the expected marginal benefit of research across diseases can increase cross-group disparities in mortality outcomes.11 Taking this idea to the data, they suggest that National Institutes of Health-funded research increased the Black-White infant mortality gap between 1950 and 2007.
Two recent studies have explored the link between innovation and earnings inequality. Patrick Kline, Neviana Petkova, Heidi Williams, and Owen Zidar develop a novel firm-level linkage between patent applications and US Treasury firm/worker tax filings, and document that patent allowances raise average earnings at the firm level but also exacerbate within-firm inequality on a number of margins — with earnings of top-earning employees, firm officers, and male employees responding more strongly to patent grants.12 Related research using a novel firm-level linkage between patents and US Social Security Administration earnings records suggests that rising inequality in innovation activity across firms in the 1990s, as measured by patenting, can account for a significant share of the recent rise in income inequality.13
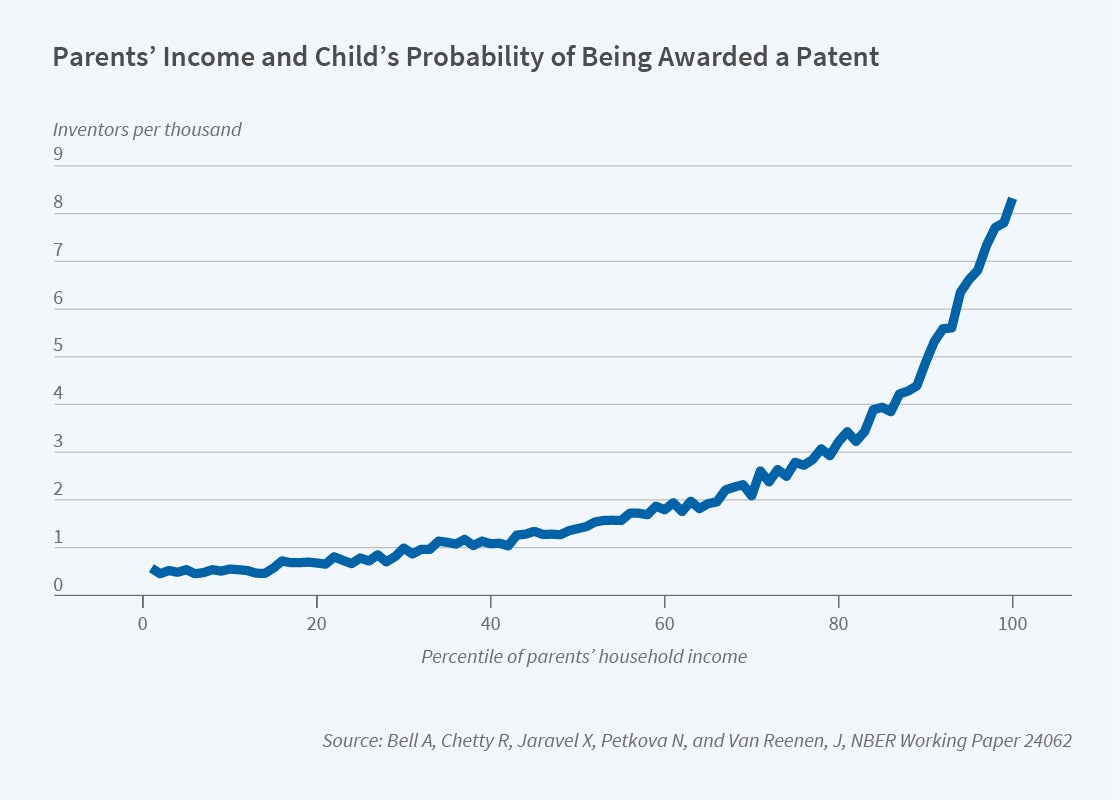
Of course, inequality at the societal level might also affect who becomes an inventor, and what they invent. Several recent studies have constructed linked data enabling new analyses of how demographic factors are associated with the probability of inventing, as measured by patenting.14 Figure 2 documents that children from high-income (top 1 percent) families are 10 times as likely to become inventors as those from below-median-income families. While the results from these papers suggest that public policies could influence who becomes an inventor, it is difficult to derive quantitative conclusions from these descriptive analyses. An important step in closing this gap is provided by the work of Chang-Tai Hsieh, Erik Hurst, Chad Jones, and Peter Klenow, who estimate that between 20 and 40 percent of the increase in US output per person between 1960 and 2010 can be explained by an improved allocation of talent, notably the convergence in occupations across gender and race.15
Entrepreneurship
Given the concerns about stagnant productivity and rising inequality, it is natural to wonder whether either or both concerns are being — or have the potential to be — addressed by the burgeoning number of new high-potential ventures. Much attention in recent years has focused on the role of venture capital (VC) in fomenting innovation. The level of VC financing has rapidly increased over the last decade, in contrast with federal R&D which has been stagnant in the US. A number of economic models suggest that VC funds should be uniquely positioned to promote innovative growth in risky and uncertain environments, given their combination of careful screening, intense monitoring, and staged financing.16
The empirical literature, however, suggests a more nuanced picture. VC funding is increasingly concentrated in a relatively small number of startup firms that raise far more capital than in the past and stay private much longer.17 Much of the funding comes not from the venture investors themselves, but from investors who traditionally focused on public firms, such as mutual and hedge funds, as well as pension funds and other large institutional investors.
This concentration of capital may or may not be socially desirable; after all, the list of long-gestating firms that garnered extensive financing while private would include Alibaba, Facebook, and Uber, each of which undoubtedly has had profound economic impacts. But Josh Lerner and Ramana Nanda argue that while venture funding is very efficacious in stimulating a certain kind of innovative business, the scope is increasingly limited. For instance, using data on the patents filed at the US Patent and Trademark Office, they found that the top 10 patent classes using the US Cooperative Patent Classification (CPC) system represented 48 percent of all US VC patents filed over the 2008–17 period, compared to 24 percent for the top 10 patent classes for patents not filed by comparable VC-backed firms.18 This concentration has increased substantially over time.
This suggestion is underscored by computations by Sand Hill Econometrics. Susan Woodward and Robert Hall describe this firm’s indices, which suggest that an investment in all software deals between December 1991 and September 2019 would have yielded an annualized gross return of 24 percent, far greater than investments in hardware (17 percent), healthcare (13 percent), or clean tech (2 percent).19 These data further illustrate that the divergence in the performance of these categories has been particularly stark in the last decade. Thus, the shift of venture investment to software is not surprising.
A related concern is the increasing concentration of venture funds in the hands of a number of small groups. Not only are these funds concentrated geographically in a few urban areas, but the makeup of the most influential US firms is very different from that of the country as a whole. At VC firms and among the founders of VC-backed startups, women represent less than 10 percent of the entrepreneurial and VC labor pool, Hispanics about 2 percent, and African Americans less than 1 percent.20 This concentration appears despite the fact that women, Hispanics, and African Americans have much higher corresponding levels of representation in education programs that traditionally lead to careers in these sectors, as well as higher rates of representation in other highly compensated professions.
The disparities are also manifested in financing raised. For instance, using data from the Kauffman Firm Survey, Robert Fairlie, Alicia Robb, and David Robinson show that the typical White-owned firm had 35 times the amount of outside equity financing as the analogous Black-owned firm at the time of the initial survey, a difference that persists over time.21
These findings suggest that while VC is a powerful tool for boosting innovation, it is far from a panacea for addressing rising inequality or stagnant productivity across the economy.
Endnotes
For an overview of the digitization effort, see “The Economics of Digitization,” Greenstein S. The Reporter, 2020-2.
Robert Gordon offers a longer discussion: “Why Has Economic Growth Slowed When Innovation Appears to Be Accelerating?” Gordon R. NBER Working Paper 24554, April 2018.
“Productivity and Potential Output Before, During, and After the Great Recession,” Fernald J. NBER Working Paper 20248, June 2014; “Challenges to Mismeasurement Explanations for the US Productivity Slowdown,” Syverson C. NBER Working Paper 21974, February 2016; “Offshore Profit Shifting and Domestic Productivity Measurement,” Guvenen F, Mataloni R, Rassier D, Ruhl K. NBER Working Paper 23324, October 2019; “Productivity Measurement: Racing to Keep Up,” Sichel D. NBER Working Paper 25558, February 2019.
“Are Ideas Getting Harder to Find?” Bloom N, Jones C, Van Reenen J, Webb M. NBER Working Paper 23782, September 2017.
“The Productivity J-Curve: How Intangibles Complement General Purpose Technologies,” Brynjolfsson E, Rock D, Syverson C. NBER Working Paper 25148, January 2020.
Research that bears on work from home includes “What Jobs Are Being Done at Home during the COVID-19 Crisis? Evidence from Firm-Level Surveys,” Bartik A, Cullen Z, Glaeser E, Luca M, Stanton C. NBER Working Paper 27422, June 2020; “COVID-19 and Remote Work: An Early Look at US Data,” Brynjolfsson E, Horton J, Ozimek A, Rock D, Sharma G, TuYe H-Y. NBER Working Paper 27344, June 2020; “Why Working from Home Will Stick,” Barrero J, Bloom N, Davis S. NBER Working Paper 28731, April 2021.
The rise in inequality is documented, for example, by Piketty and Saez: “Income Inequality in the United States, 1913–1998,” Piketty T, Saez E. NBER Working Paper 8467, September 2001; “The Evolution of Top Incomes: A Historical and International Perspective,” Piketty T, Saez E. NBER Working Paper 11955, January 2006.
“Innovation and Top Income Inequality,” Aghion P, Akcigit U, Bergeaud A, Blundell R, Hémous D. NBER Working Paper 21247, June 2015; “A Schumpeterian Model of Top Income Inequality,” Jones C, Kim J. NBER Working Paper 20637, July 2015.
“Induced Innovation and Social Inequality: Evidence from Infant Medical Care,” Cutler D, Meara E, Richards-Shubik S. NBER Working Paper 15316, September 2009.
“Who Profits from Patents? Rent-Sharing at Innovative Firms,” Kline P, Petkova N, Williams H, Zidar O. NBER Working Paper 25245, March 2019.
“Technological Innovation and Labor Income Risk,” Kogan L, Papanikolaou D, Schmid L, Song J. NBER Working Paper 26964, April 2020.
“Who Becomes an Inventor in America? The Importance of Exposure to Innovation,” Bell A, Chetty R, Jaravel X, Petkova N, Van Reenen J. NBER Working Paper 24062, January 2019; “The Rise of American Ingenuity: Innovation and Inventors of the Golden Age,” Akcigit U, Grigsby J, Nicholas T. NBER Working Paper 23047, January 2017; “The Social Origins of Inventors,” Aghion P, Akcigit U, Hyytinen A, Toivanen O. NBER Working Paper 24110, December 2017.
“The Allocation of Talent and US Economic Growth,” Hsieh C-T, Hurst E, Jones C, Klenow P. NBER Working Paper 18693, January 2013.
Two recent examples are “Synergizing Ventures,” Akcigit U, Dinlersoz E, Greenwood J, Penciakova V. NBER Working Paper 26196, August 2019; “Private Equity and Growth,” Jovanovic B, Ma S, Rousseau P. NBER Working Paper 28030, October 2020.
“The Deregulation of the Private Equity Markets and the Decline in IPOs,” Ewens M, Farre-Mensa J. NBER Working Paper 26317, December 2019.
“Venture Capital’s Role in Financing Innovation: What We Know and How Much We Still Need to Learn,” Lerner J, Nanda R. NBER Working Paper 27492, July 2020.
“Benchmarking the Returns to Venture,” Woodward S, Hall R. NBER Working Paper 10202, January 2004.
“Black and White: Access to Capital among Minority-Owned Startups,” Fairlie R, Robb A, Robinson D. NBER Working Paper 28154, November 2020.


