Correcting for Quality Change When Measuring Inflation
One of the perennial challenges of constructing price indices like the Consumer Price Index (CPI) is that products change over time. This is often cited as a concern with regard to rapidly evolving products on the technological frontier, such as personal computers, cellphones, and automobiles. One standard approach to adjusting for quality change, the “hedonic method,” involves relating product prices to product characteristics, such as memory size and CPU speed for computers or horsepower and miles per gallon for cars, and estimating the amount that consumers are prepared to pay for improvements in these characteristics. These estimates can in turn be used to distinguish price changes over time that are due to changes in product characteristics from changes that are due to the price charged for a product with a given bundle of characteristics. Price changes for the same product over time are relevant for inflation calculations; price changes that result from changes in product quality are not.
Applying the hedonic method can be difficult because most products have many different characteristics, making it difficult to choose the set of characteristics that should be included in the hedonic model, and the set of pricing-relevant characteristics may change over time. The Bureau of Labor Statistics currently uses hedonic adjustment for only about 7.5 percent of the goods that are included in the calculation of the CPI.
Analysis of changing food product characteristics suggests that conventional measures may substantially overstate food-price inflation.
In Using Machine Learning to Construct Hedonic Price Indices (NBER Working Paper 31315), Michael Cafarella, Gabriel Ehrlich, Tian Gao, John C. Haltiwanger, Matthew D. Shapiro, and Laura Zhao describe a way to substitute a machine-learning algorithm that can search for patterns and relationships in large datasets for the human analysts who traditionally construct the hedonic functions. This algorithm provides estimates of the relationship between changes in prices and product characteristics that can be used to construct hedonic-adjusted measures of inflation.
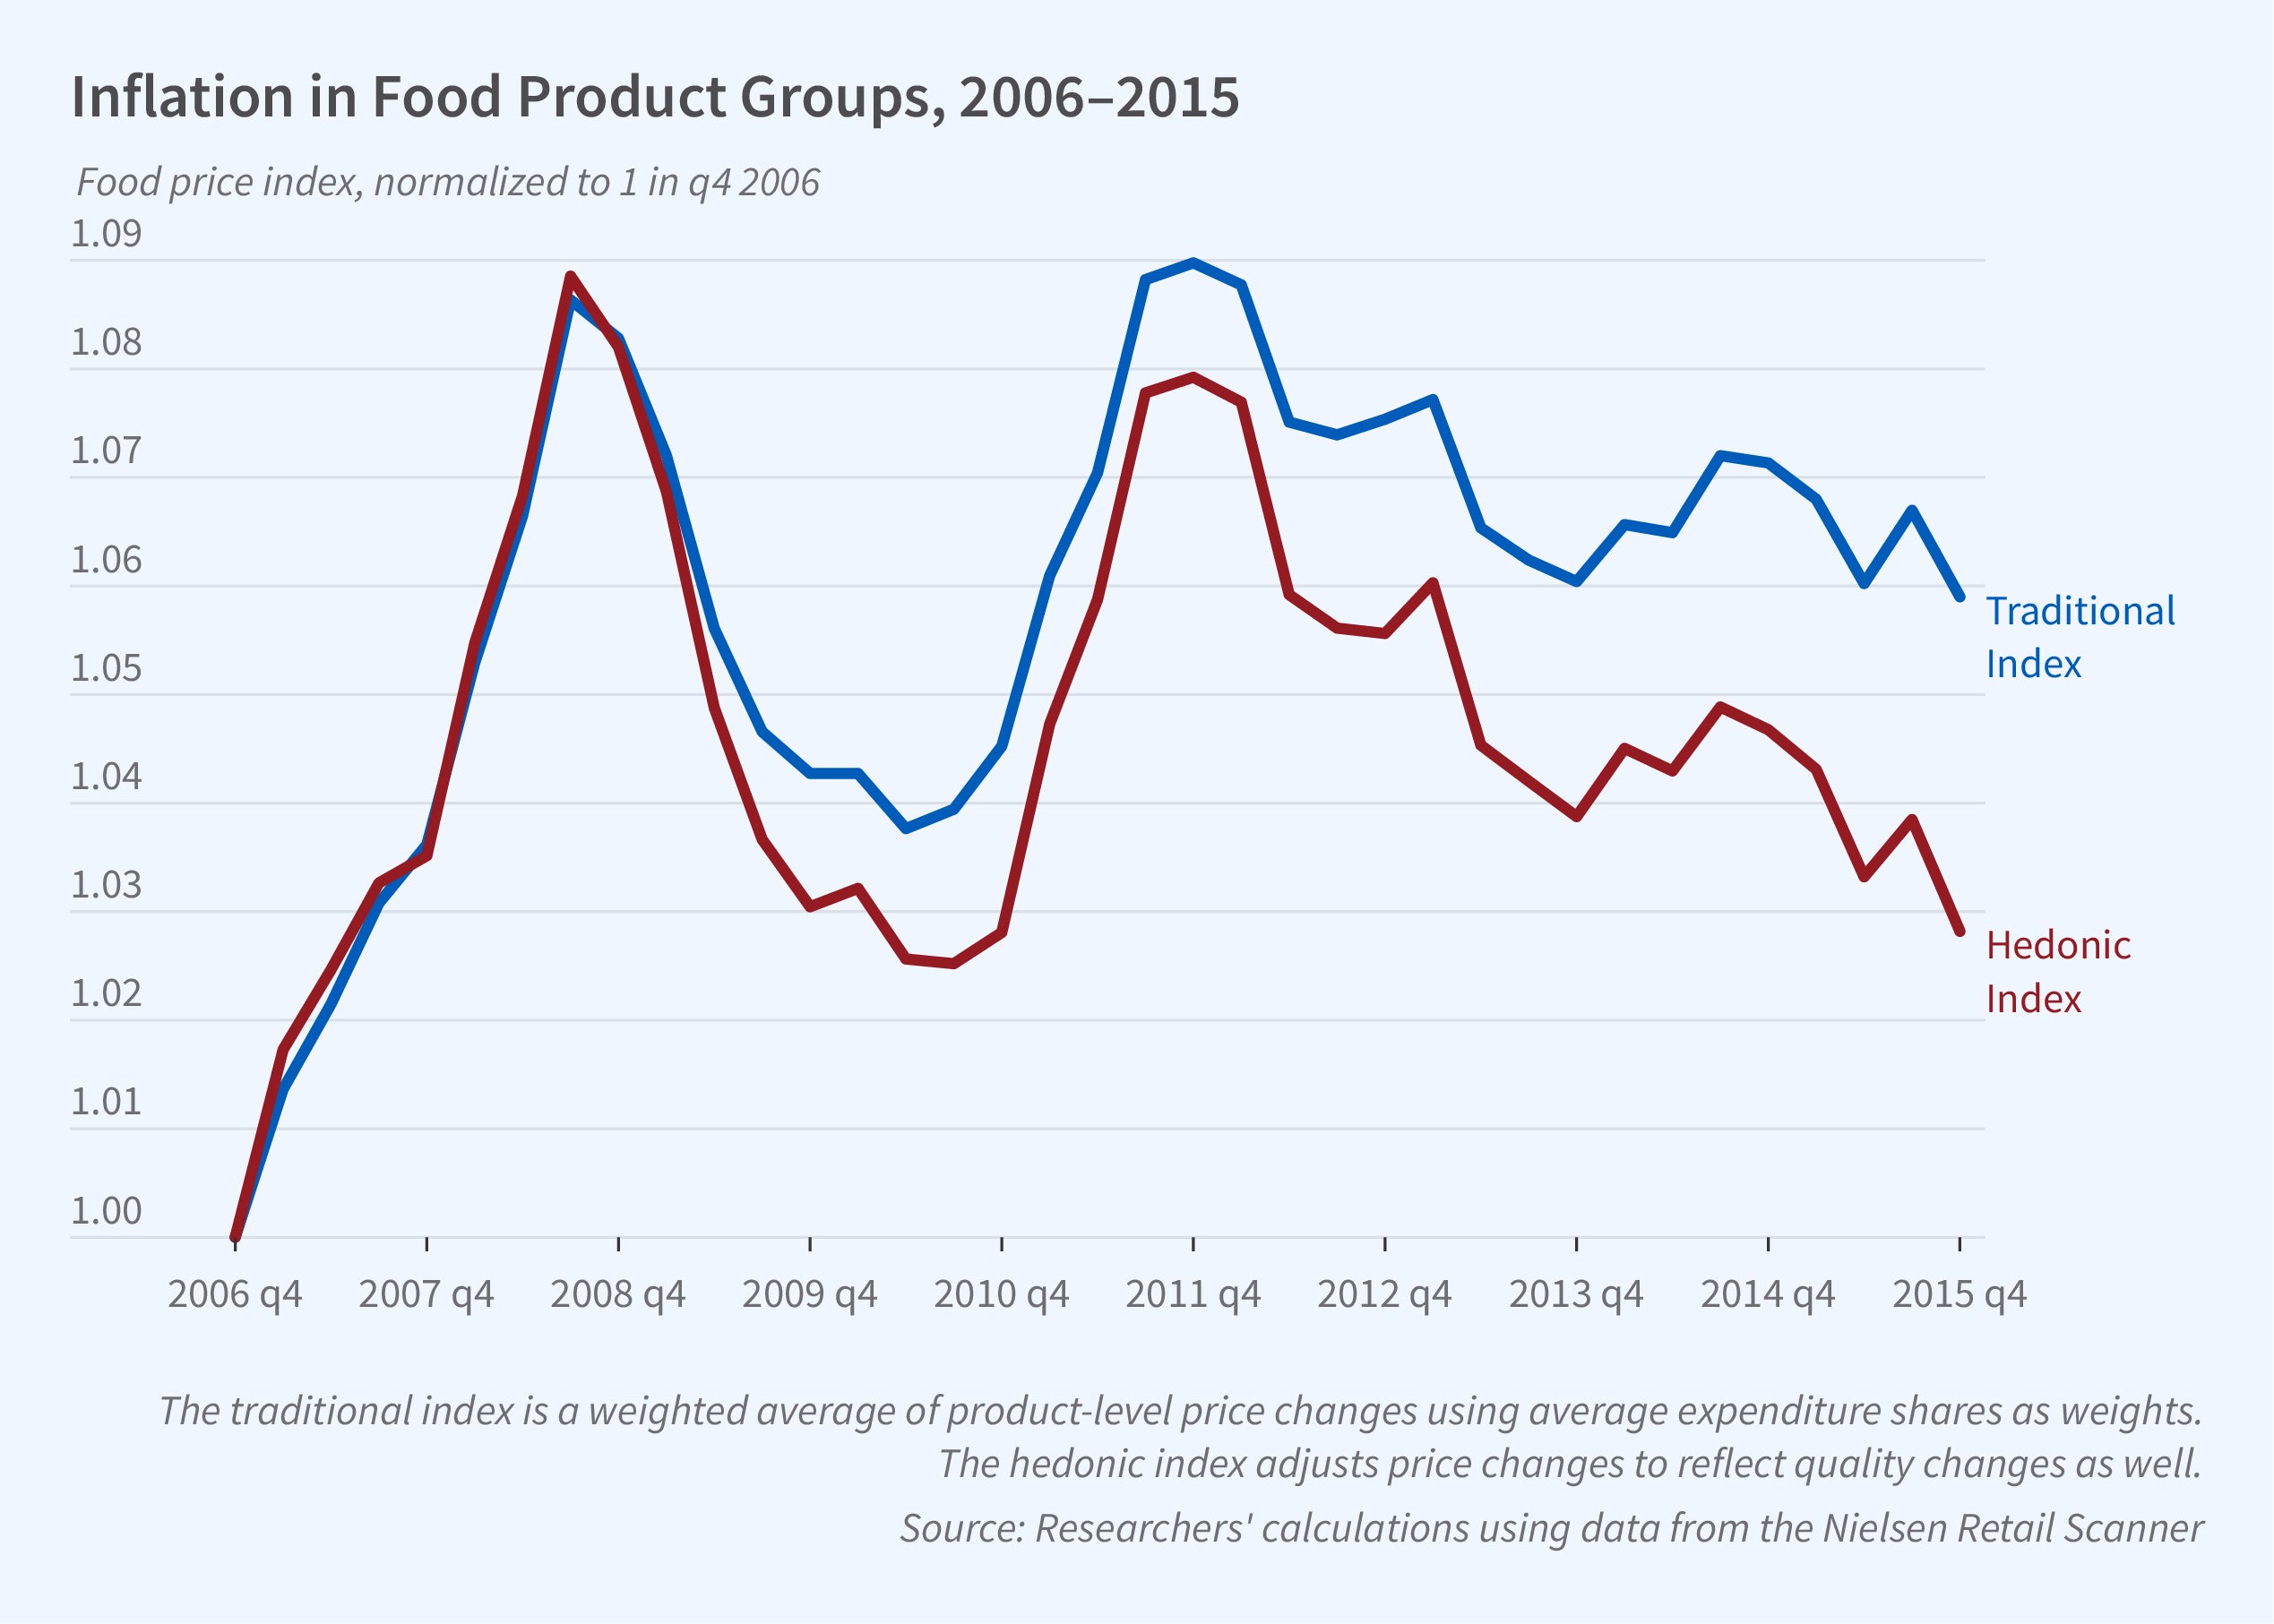
The researchers apply their inflation-measurement procedure to the Nielsen Retail Scanner data from 2006 to 2015. The data include 2.6 million products defined by 12-digit universal product codes (UPC) that uniquely identify specific goods. Each UPC has a text description that is a combination of Standard English words and industry-specific character combinations. The data are collected from over 40,000 stores from approximately 90 retail chains, representing 54 percent of all grocery store sales, 55 percent of all drugstore sales, 32 percent of all mass merchandise sales, and 2 percent of all convenience store sales. The researchers aggregate weekly data into quarterly data and normalize product quantities.
The hedonic model generated by the machine-learning algorithm has excellent predictive power for price changes on average, though its ability to predict price changes across products is inconsistent. Out of sample, the algorithm correctly predicts about 60 percent of the range of price changes for the median food product and about 50 percent for the median nonfood product.
The researchers use their method to adjust a traditional inflation measure to reflect a larger range of product quality changes over the 2006 to 2015 period. They find that while the standard method yields a 5.9 percent increase in food prices over the period, correcting for quality change reduces this increase to 2.8 percent. For nonfood products sold at grocery stores and drugstores, which may be less representative of products in the overall economy, the paper finds little evidence of quality change.
— Whitney Zhang


