Comparing Two Approaches to Procurement
Governments and multilateral institutions often implement policies through procurement contracts: agreements with private companies for building a piece of infrastructure or delivering a good or service. Procurement contracts are usually complex, and they often leave substantial discretion to the winning bidder. Some contracts simply instruct a private company to procure the required goods or services, while others detail additional requirements such as suppliers that may be used or quality specifications that must be satisfied. Procurement design choices can matter. When well crafted, procurement processes can help guide the private company towards the desired outcome; when imposing excessive bureaucratic requirements or lacking in enforcement mechanisms, they can hinder efficient project completion.
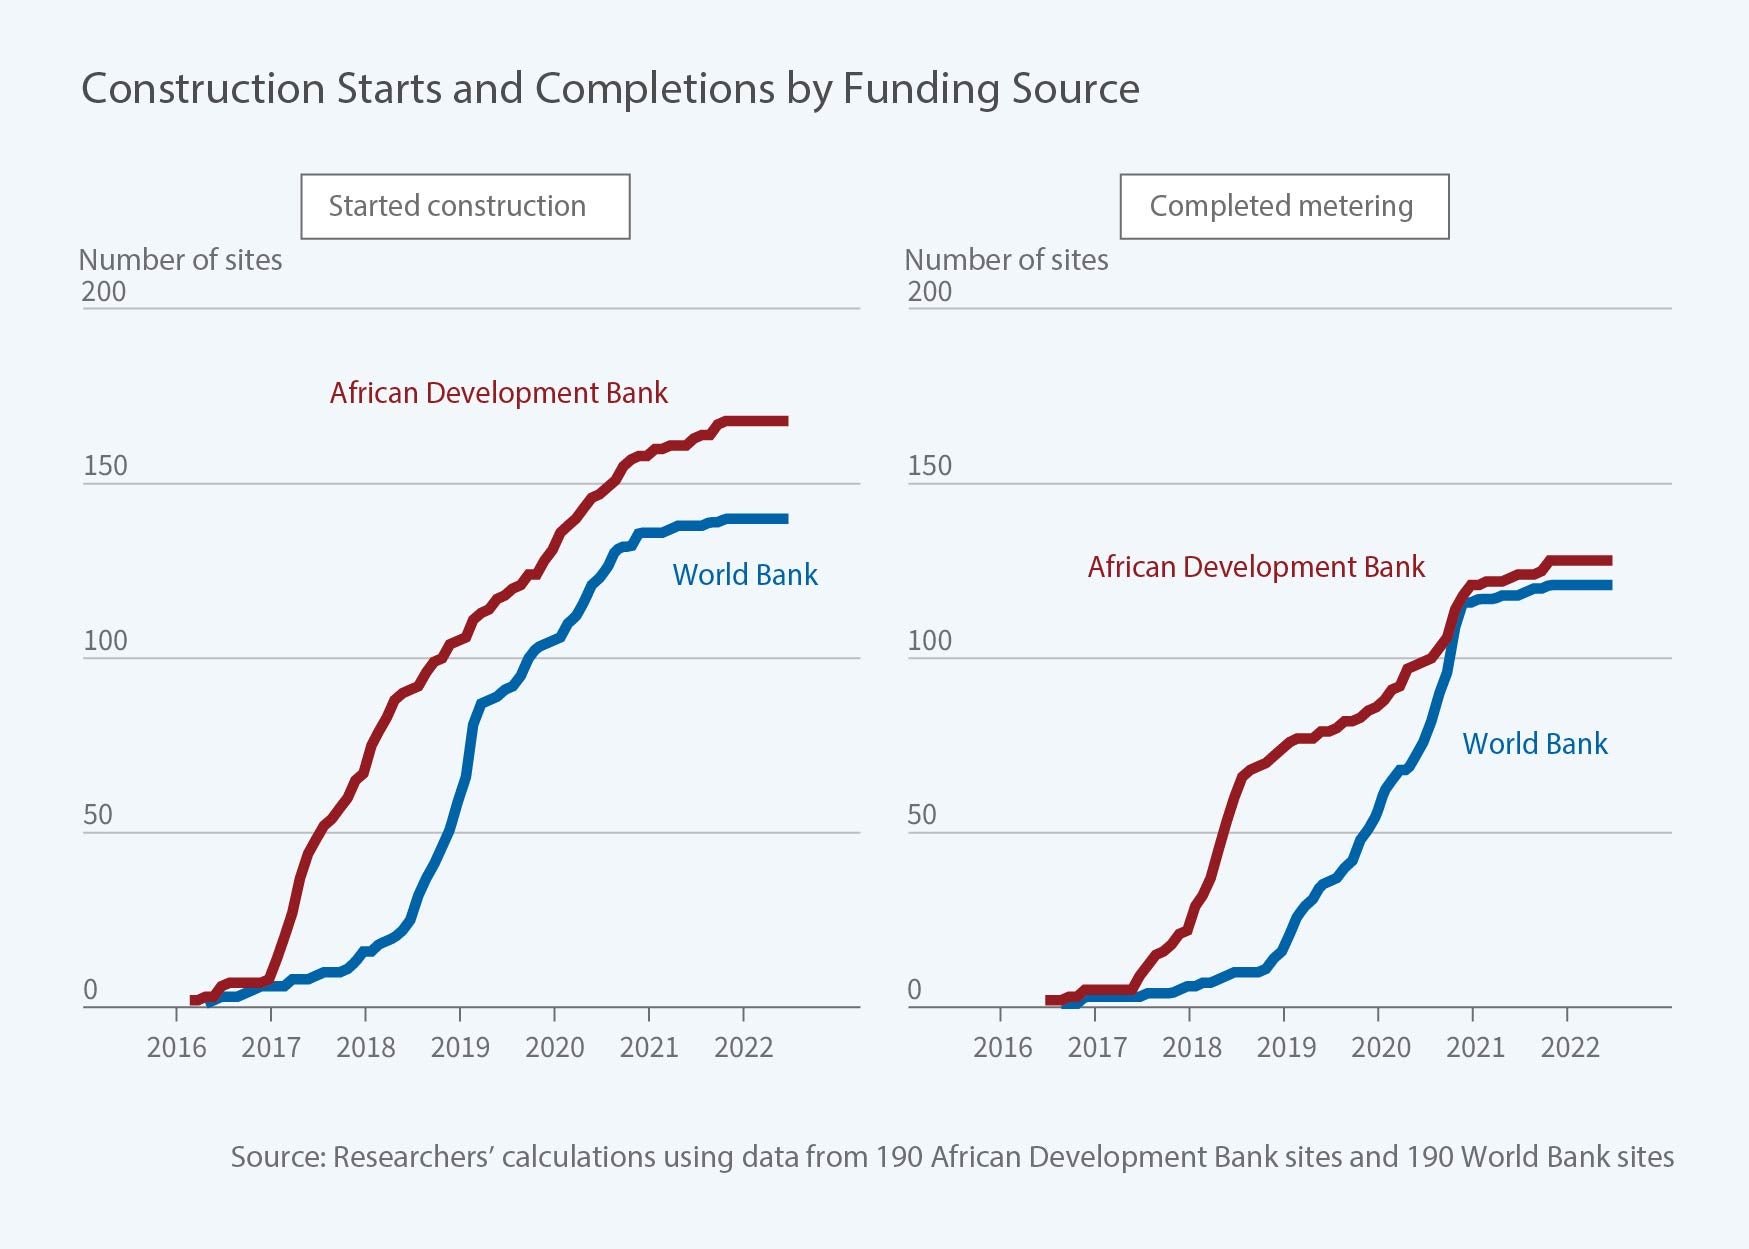
In Donor Contracting Conditions and Public Procurement: Causal Evidence from Kenyan Electrification (NBER Working Paper 30948), Catherine Wolfram, Edward Miguel, Eric Hsu, and Susanna Berkouwer provide new evidence on the effects of two kinds of design choices: procedural requirements and contract “bundling.” They study the Last Mile Connectivity Project in Kenya, an ambitious $600 million attempt by the government to extend electricity grids to unconnected houses in thousands of Kenyan villages. The extension work was implemented by Kenya Power — the national utility — which then contracted with private companies to provide the necessary goods and services under two different procurement regimes. Specifically, 5,320 of the extensions were funded by the African Development Bank (AfDB). Contracts to complete these extensions were influenced by AfDB regulations and bundled together various stages of electricity extension, such as design, material sourcing, and installation, and imposed relatively few monitoring and procedural requirements. In contrast, 3,200 extensions were funded by the World Bank (WB). These extensions were completed using unbundled contracts that used different companies to complete different parts of the process and imposed procedural requirements such as additional inspections of completed sites.
A $600 million electricity project in rural Kenya provided an opportunity to compare the speed and quality of contract completion under different procurement rules.
Villages were assigned to be funded by the AfDB or the WB through an arbitrary, quasi-random process. The researchers interpret differences in outcomes between AfDB- and WB-funded projects as causal effects of the differences in contracting structure. Since the procurement processes for AfDB- and WB-funded sites differed on two dimensions — bundling and oversight — differences in outcomes could reflect the impact of either or both design choices. To disentangle the effects of bundling from those of oversight, the researchers randomly assign villages in both groups to be audited in a way that mimics the WB’s oversight requirements. Comparing unaudited AfDB-funded villages, which received bundled contracts with no additional oversight, audited AfDB-funded villages, which received bundled contracts and additional oversight, and WB-funded villages, which had both unbundling and additional oversight, allows separate identification of the effects of each design choice.
The results are nuanced, showing both benefits and costs of the contracts for WB-funded sites relative to those for AfDB-funded sites. Construction at WB-funded sites proceeded far more slowly and was smaller in scope, as indicated by key metrics like the number of electricity poles installed or the number of households connected to the grid falling behind that of AfDB-funded sites by 12–14 percent. The slowdown may have been due to greater administrative demands in WB-funded projects that coordinated many different contractors. WB-funded construction was also more expensive than AfDB-funded construction, averaging $728 versus $563 per household.
The WB requirements, however, also led to higher-quality installations: a higher fraction of electricity poles with caps, without cracks, and with other characteristics indicating greater durability and lower maintenance costs. The higher quality of WB-funded installations was due to both the monitoring requirements and the unbundling of contracts: audits of villages in the AfDB-funded group increased installation quality, but not by enough to catch up with the WB-funded sites.
— Shakked Noy


