The Economics of Medicaid: New Evidence on Privatization, Competition, and Program Design
Medicaid has evolved from a small safety-net program into the largest health insurer in the United States, covering almost 80 million Americans at a combined federal and state cost of $919 billion in 2024.1,2
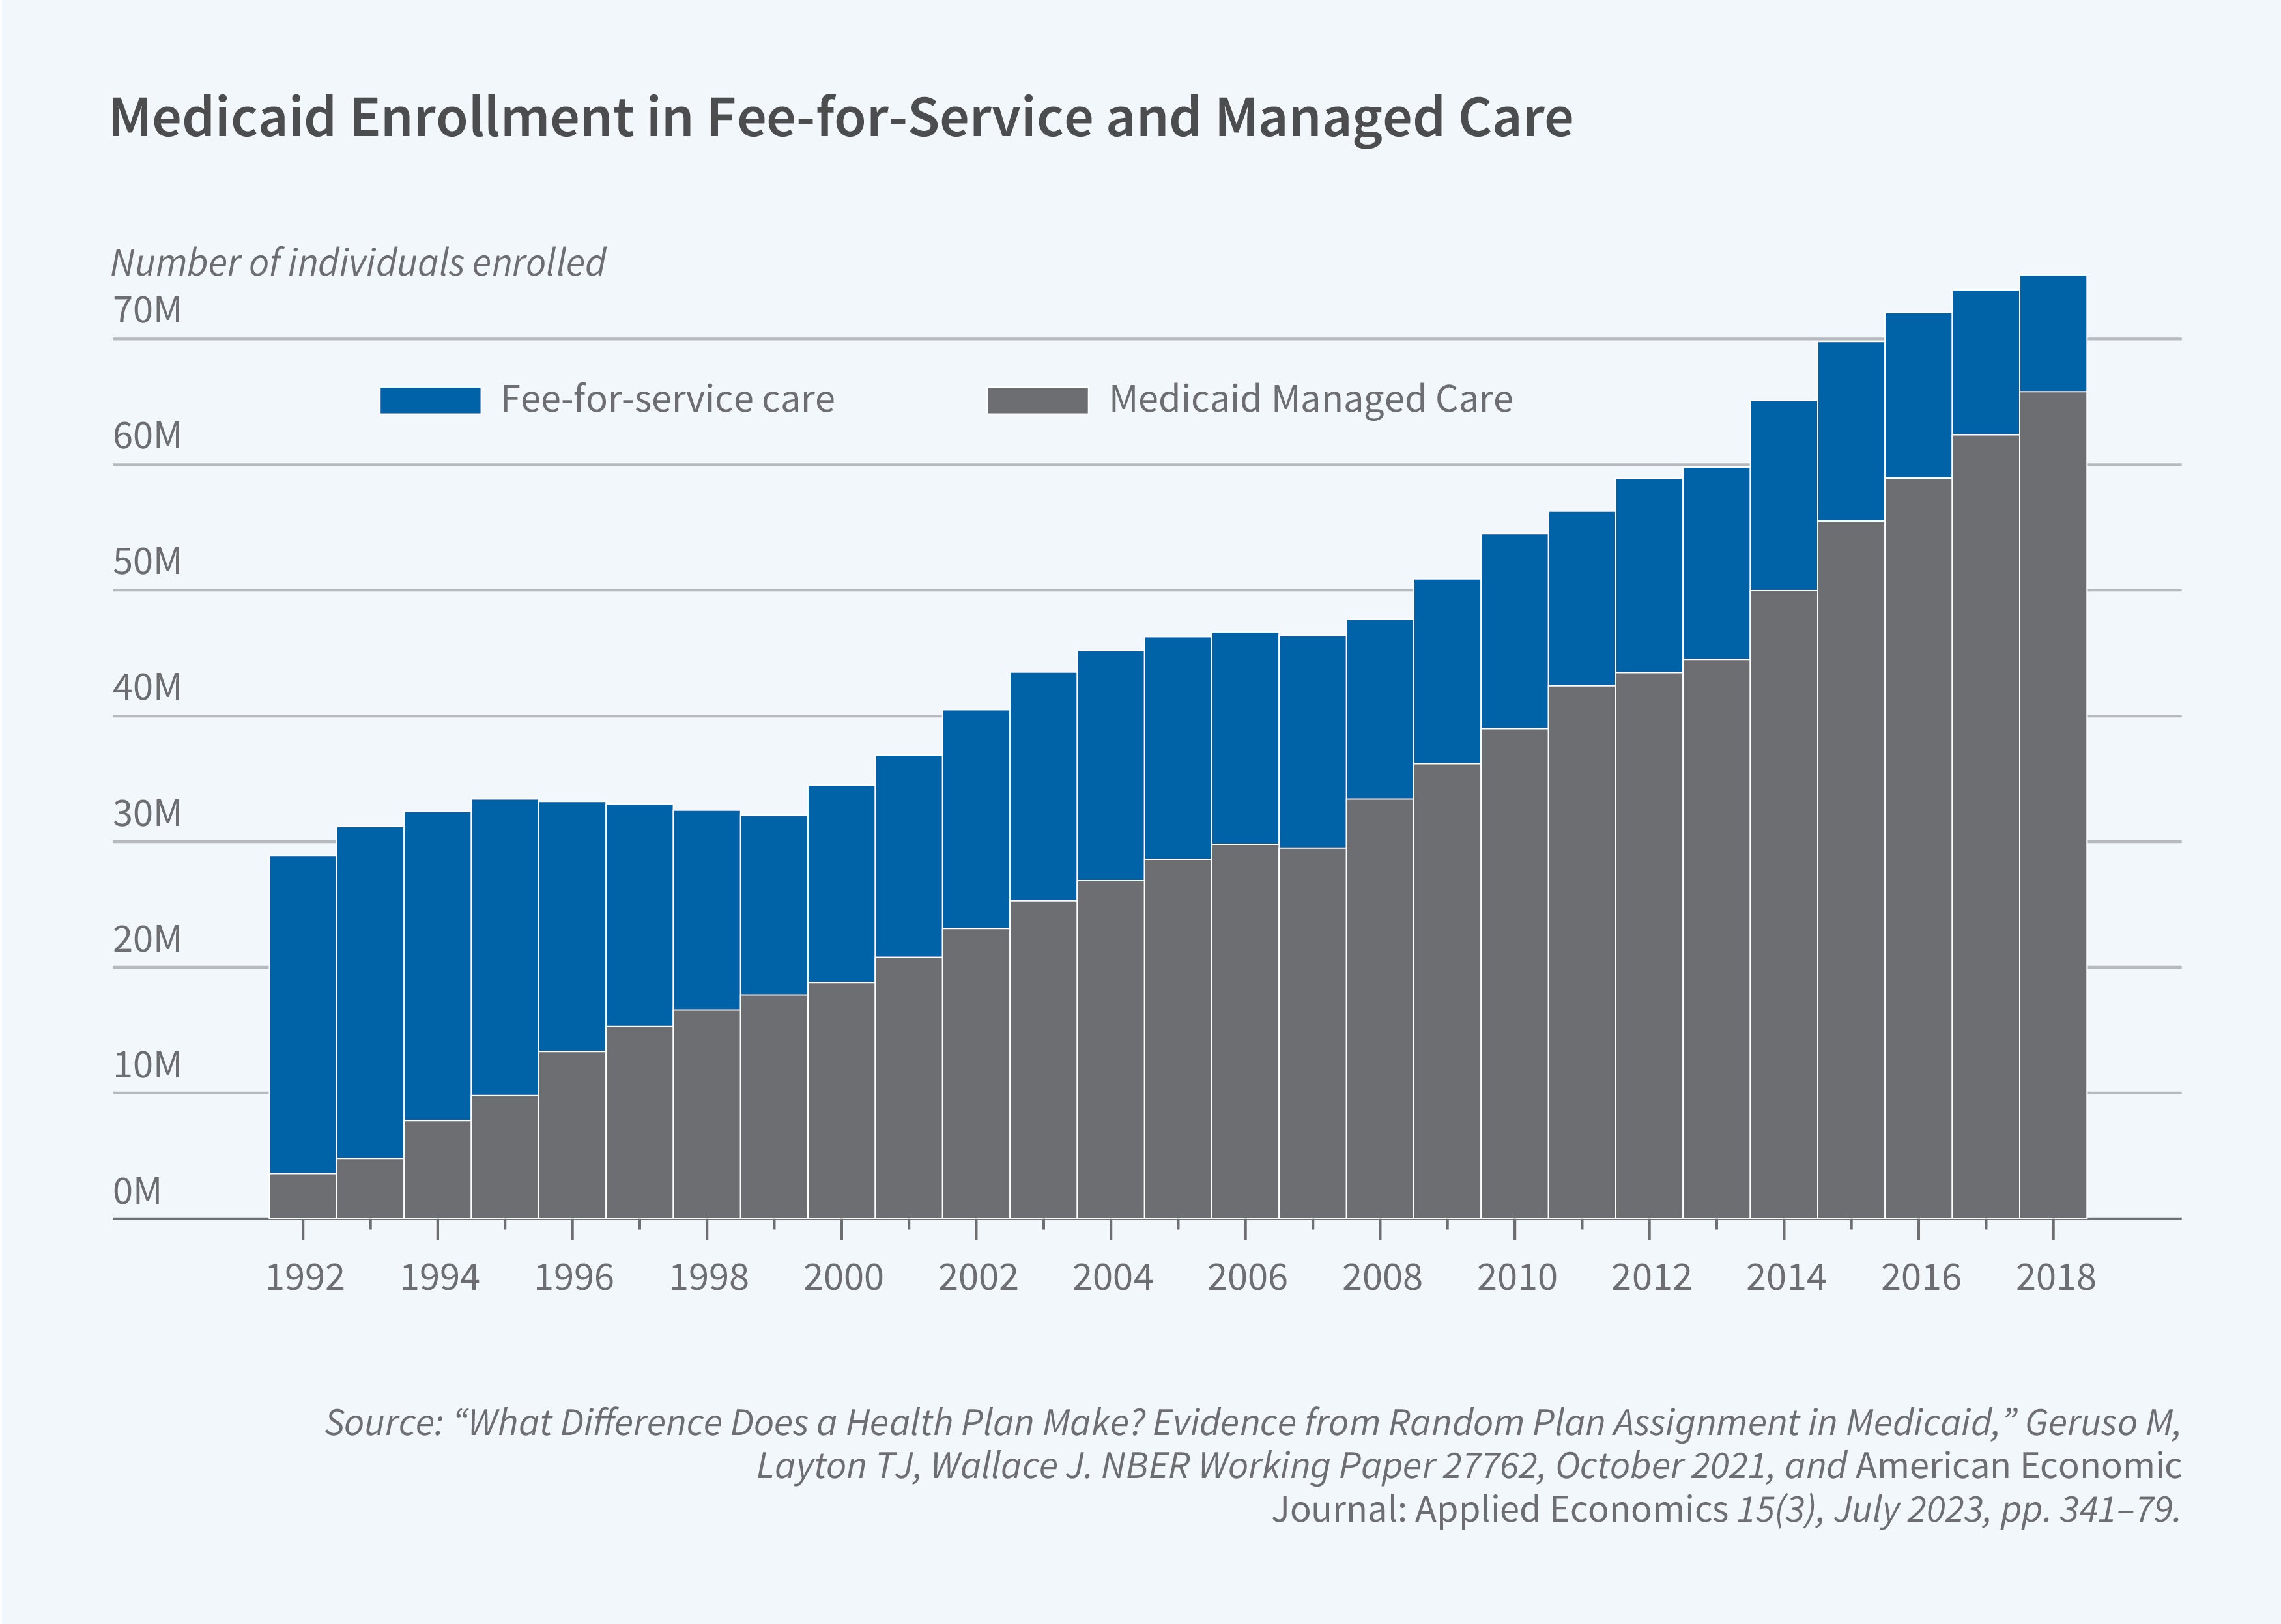
This growth has been accompanied by a structural shift. Unlike Medicare, which is a uniform national program, Medicaid is effectively 50-plus programs designed and administered by each state. Furthermore, it has transformed from a system of government-run fee-for-service (FFS) insurance to one dominated by contracted private "managed care" insurers. Today, roughly 75 percent of all Medicaid beneficiaries are enrolled in private Medicaid Managed Care (MMC) plans (Figure 1).3
While a significant body of research has focused on the important question of whether Medicaid coverage improves health, our recent research has focused on "inside-the-program" economics. We investigate how this hybrid public-private, federal-state design drives program costs, efficiency, and beneficiary outcomes.
The Public-versus-Private Trade-off in Medicaid
A classic question in public economics is whether governments should deliver services directly or contract them out to private firms. This choice is also fundamental in Medicaid. While states once relied mainly on their own FFS program to cover medical costs, most states now rely on private MMC plans.
While states often turn to privatization for cost savings and budget predictability, our research reveals a complex and heterogeneous set of trade-offs. Like prior work, we and others find mixed evidence on cost and quality impacts, which vary by state.4 Our results suggest there is no one-size-fits-all finding for whether public or private Medicaid plans perform better; instead, implementation details and context are central.
The Dynamic Costs of Outsourcing
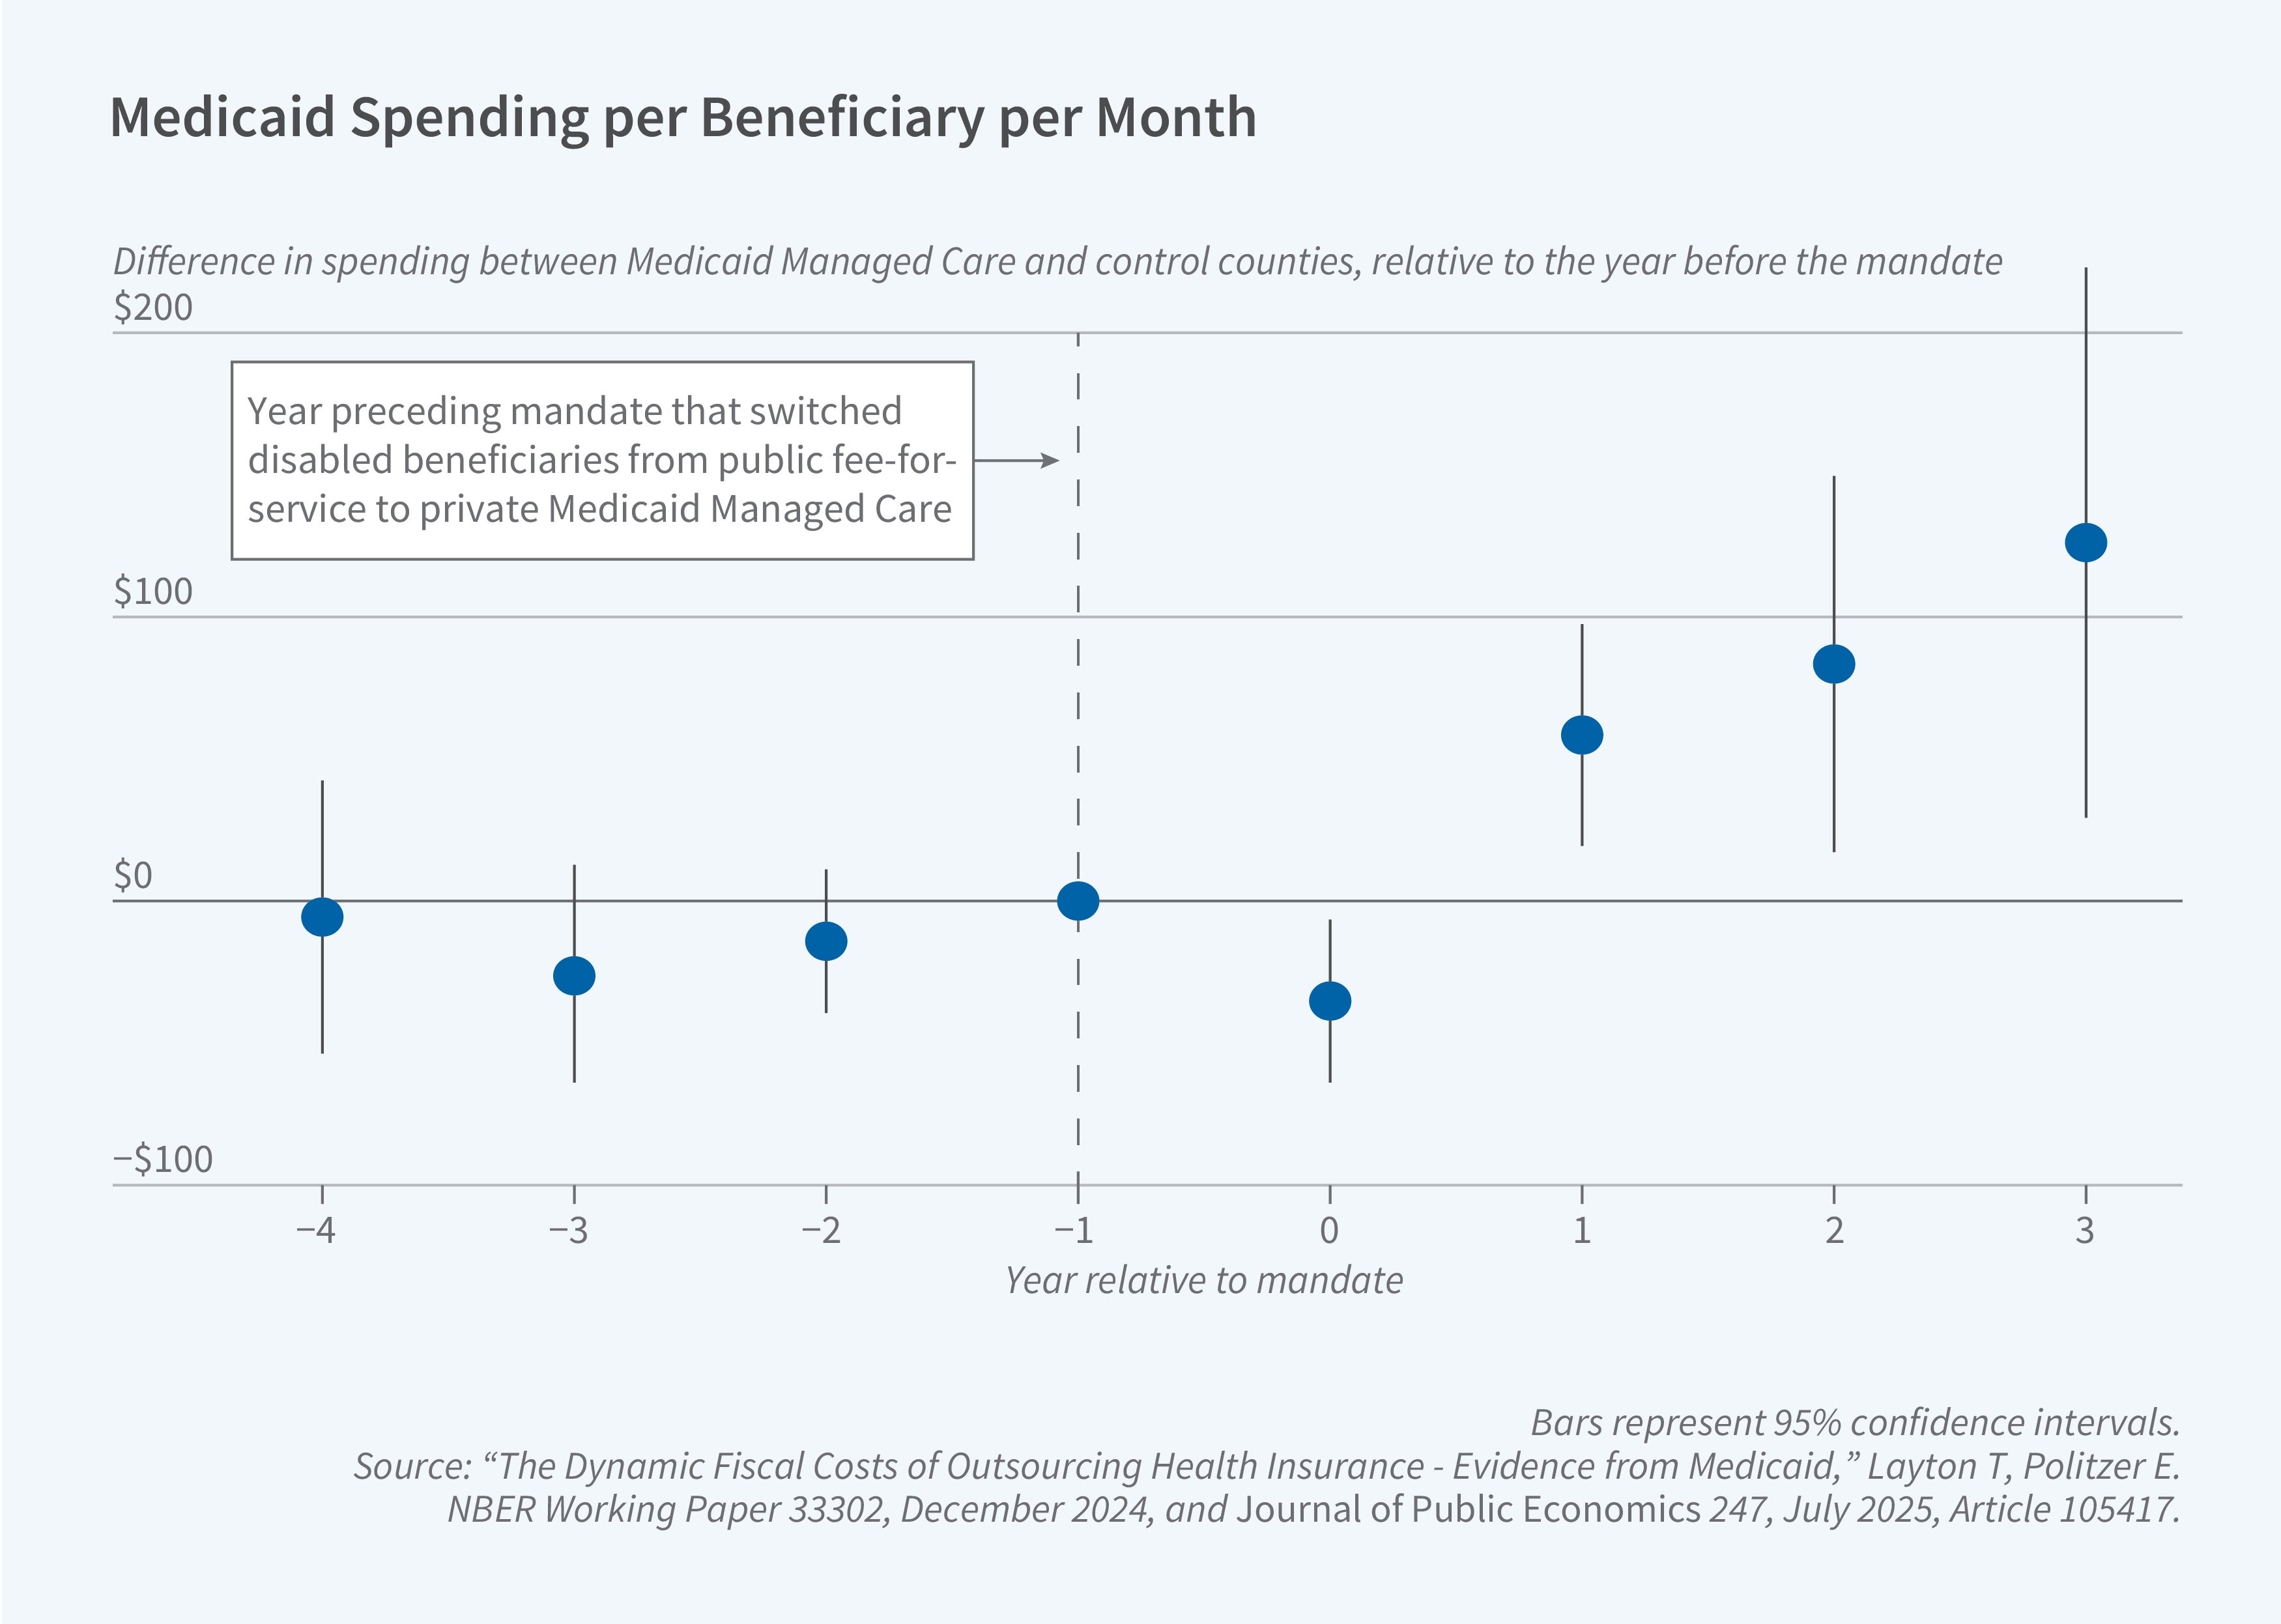
In a national study, we investigated the fiscal effects of county-level mandates that switched disabled beneficiaries—one of the most expensive populations—from public FFS to private MMC.5 We found that while privatization was associated with a small cost decrease in the first year, fiscal costs rose faster in the following years. By the fourth year, counties that implemented privatization had program costs that were 9.8 percent higher than control counties (Figure 2).
We find that a central reason costs rise more quickly is the way in which states set payments to managed care plans under federal "actuarial soundness" rules. In practice, state actuaries review recent spending and use those amounts—adjusted for expected inflation—to determine the next year’s payment rates. This creates a feedback loop: higher spending today leads to higher payments tomorrow, while savings today often translate into lower payments in the future. This is a dynamic version of classic "cost-plus" contracting incentives, and it tends to raise costs. Over time, this force weakens cost-control incentives for private insurers and allows small spending increases to compound.
We explore alternative ways to set payments to managed care plans, including "yardstick" competition that bases prices on the costs of other firms in the market, and conclude that the specific mechanics of price setting matter and can limit the government’s ability to achieve savings through managed care.
Heterogeneity in Quality and Cost
If privatization can increase costs, what are beneficiaries getting in return? Our findings suggest the answer depends critically on the design of the public program being replaced and the health of the population being moved. There is evidence on this question from three states: Texas, Louisiana, and California.
Texas shifted from a FFS program to mandatory privatization for adults with disabilities. We found that the public FFS program used blunt rationing tools to manage costs, most notably a strict cap of three prescriptions per enrollee per month.6 The state relaxed this rationing with the transition to managed care, leading to significant increases in the use of high-value medications such as insulins, anti-psychotics, and antidepressants. This, in turn, improved health outcomes: the increased drug use was associated with a decrease in avoidable hospitalizations for conditions like diabetes and mental illness. This improvement in quality, however, came with a 12 percent increase in spending. In this context, privatization functioned as a political-economy mechanism to increase spending and relax rationing of high-value medications: Policymakers were more willing to expand Medicaid generosity and spending when the marginal dollars were allocated by private plans instead of government bureaucrats.
In contrast, recent evidence from Louisiana using random assignment of nearly 100,000 beneficiaries to either FFS or MMC shows a different story.7 Here, MMC reduced costs by 5.6 percent. The savings were concentrated in prescription drugs, driven by cost-effective substitutions to generic drugs and lower prices for outpatient care. However, these savings were associated with decreased enrollee satisfaction—enrollees in MMC were nearly three times as likely to switch plans—and decreased access to primary care, which led to a 14 percent increase in avoidable emergency department (ED) visits.
Other researchers have studied California's managed care mandate for the disabled Medicaid population. In contrast to our Texas results, it appears that the mandate was associated with significant disruptions in care, including increases in ED use and hospital transfers.8 The study estimated an approximately 12 percent increase in mortality for this population, an effect concentrated among the sickest individuals.
Together, these studies show that the impact of privatization is not uniform. It is highly heterogeneous, depending on how well the state’s public FFS program works and on which population is being transitioned.
Competition and Incentives Within Managed Care
Given that most Medicaid beneficiaries are now in MMC plans, our research also examines the "black box" of this private market. We show how the design of competition and insurer payment systems creates powerful incentives that shape the de facto bundle of care.
Competition in a Market with No Consumer Prices
Medicaid competition is unique because enrollees pay zero premiums for all plans. This eliminates price competition and forces plans to compete on non-price features, such as provider networks and access to care. To understand the implications, we used data from New York City, where beneficiaries were randomly assigned to one of ten competing MMC plans.9
We found substantial variation between plans: for an identical beneficiary, the lowest-spending plan generated 30 percent lower healthcare spending than the highest-spending plan. This difference was driven almost entirely by variations in the quantity of services provided, not by the prices plans paid. Low-spending plans were not simply more "efficient"; they achieved savings by bluntly reducing both low-value and high-value care, and their enrollees experienced a higher rate of avoidable hospitalizations.
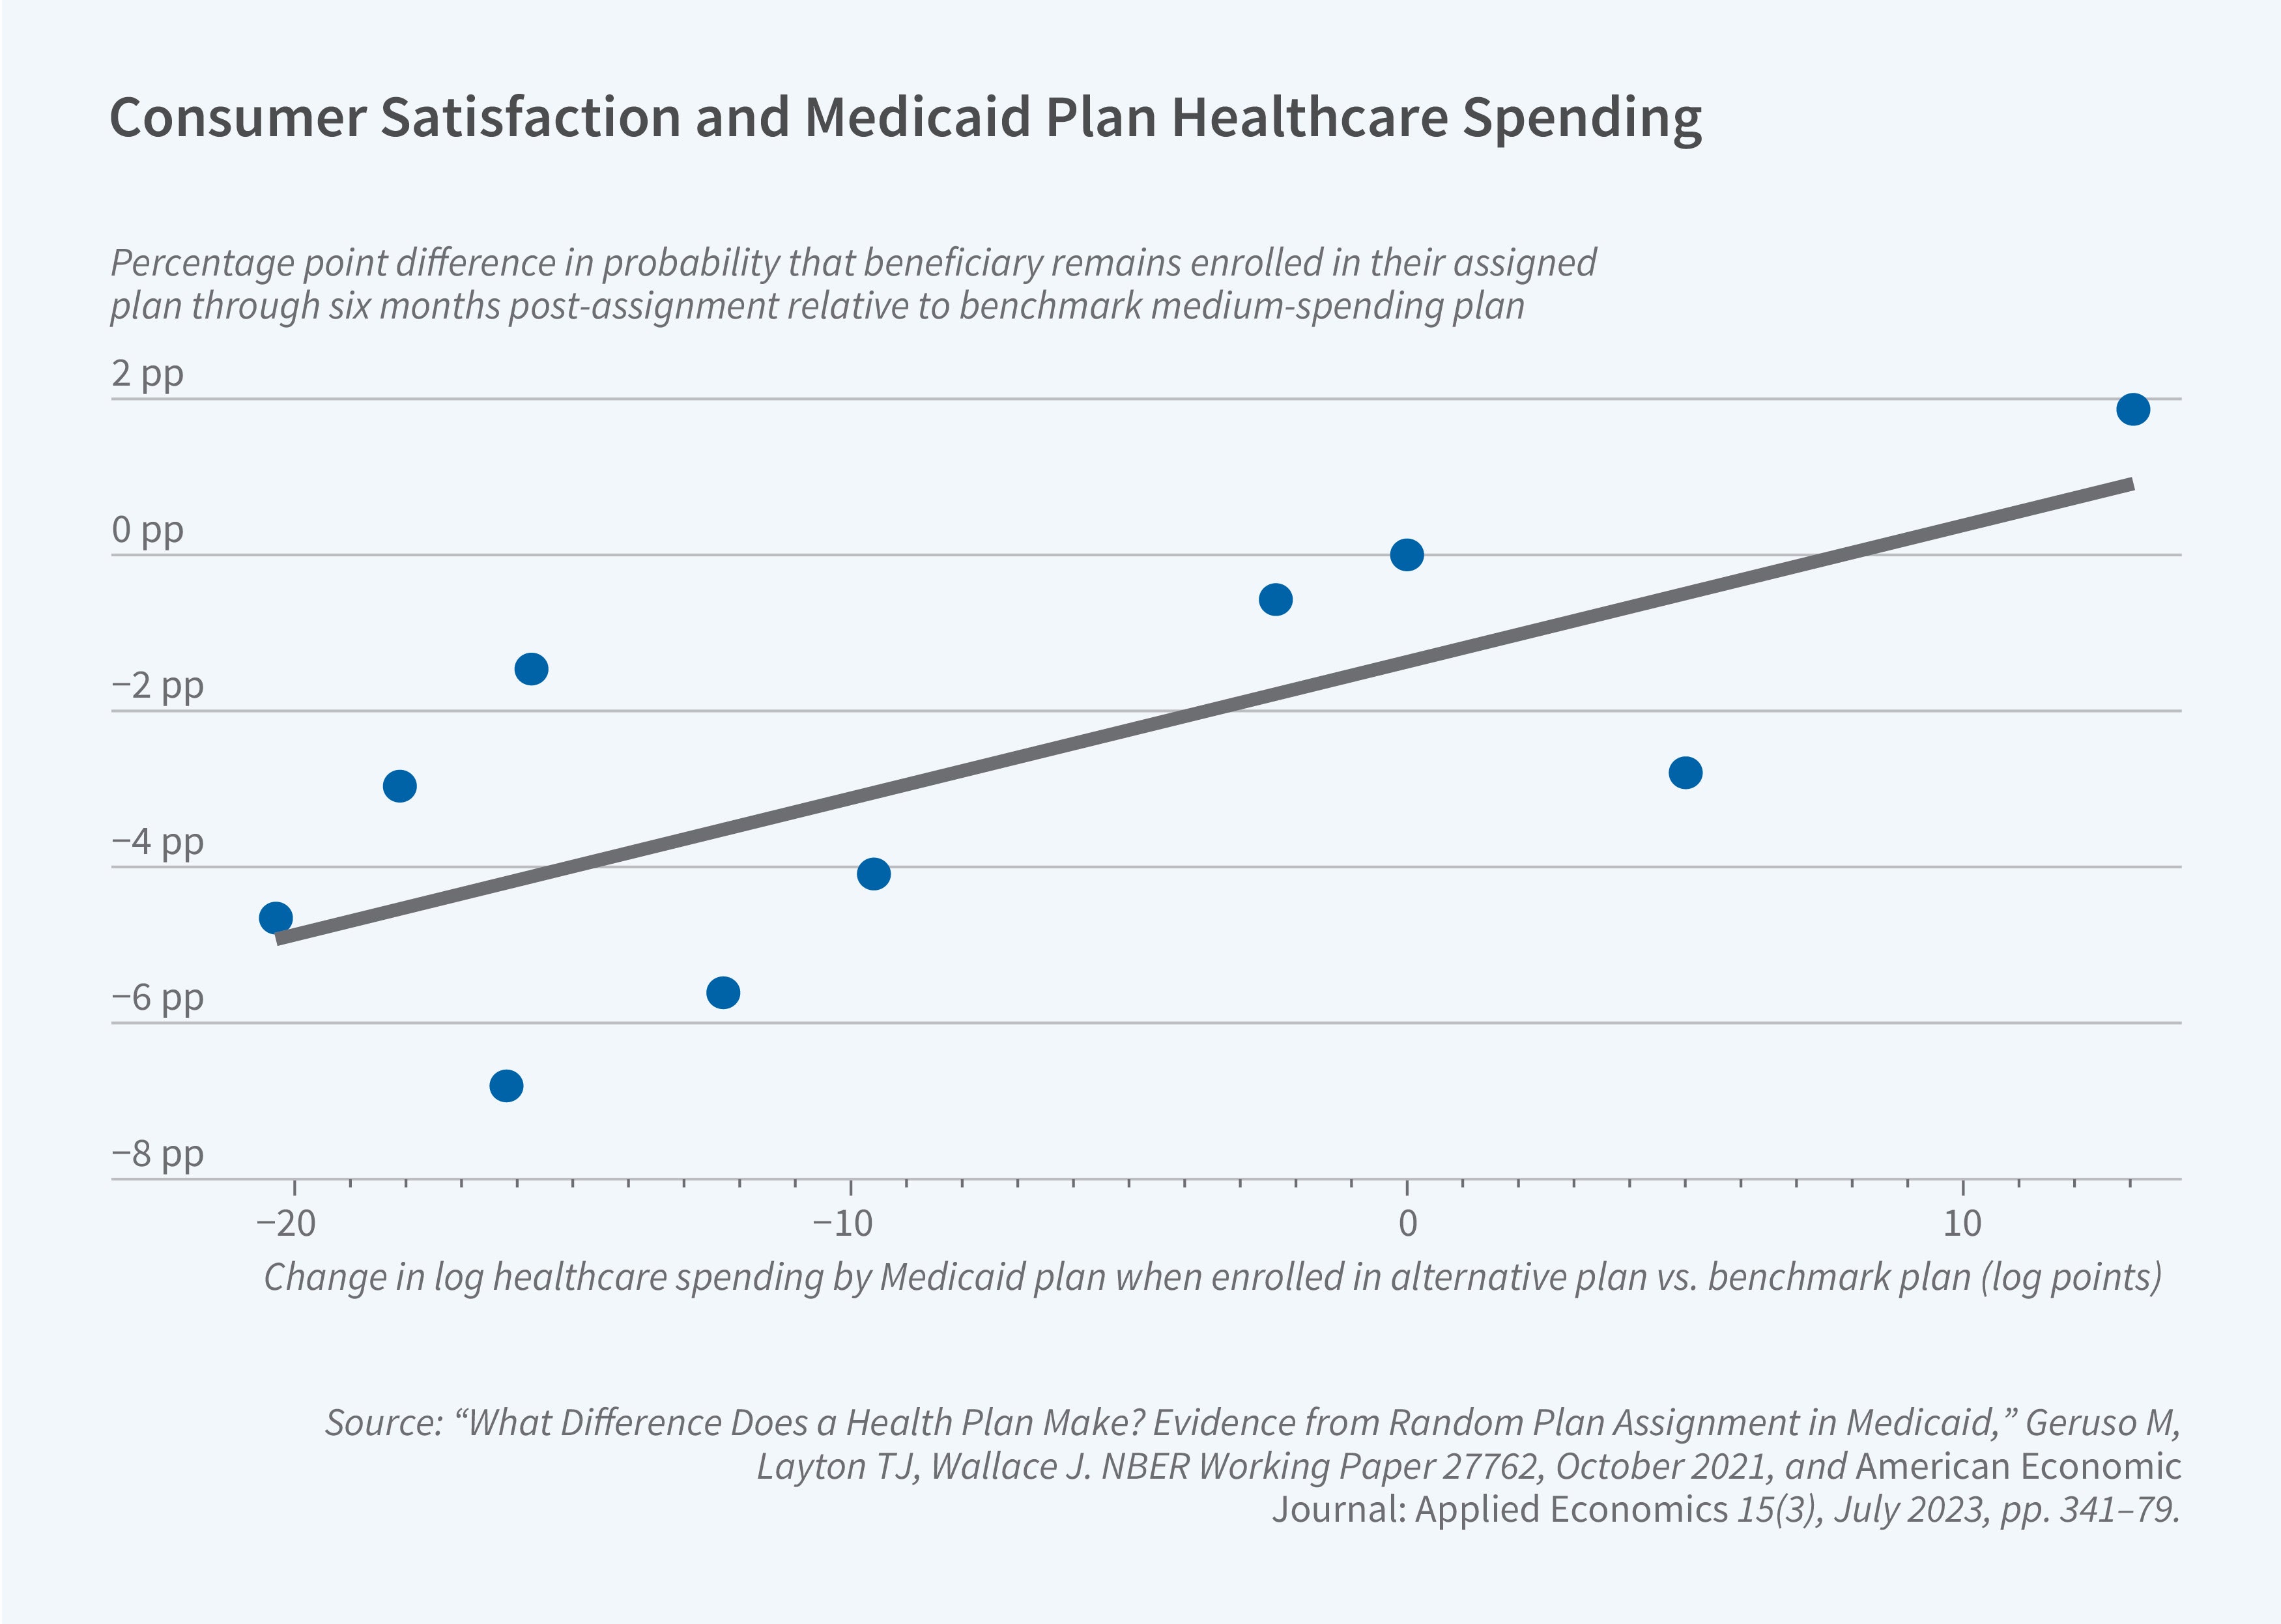
Beneficiaries voted with their feet. Enrollees randomly assigned to high-spending plans were significantly more satisfied and more likely to stay with their plan over time (Figure 3). Enrollees who actively chose a plan—the group most responsive to market dynamics—systematically sorted into the higher-spending, higher-access plans. In a market where plans cannot compete on price, competition on access and quality can actively drive costs up, since enrollees have little incentive to choose lower-cost plans.
Network Design and Adverse Selection
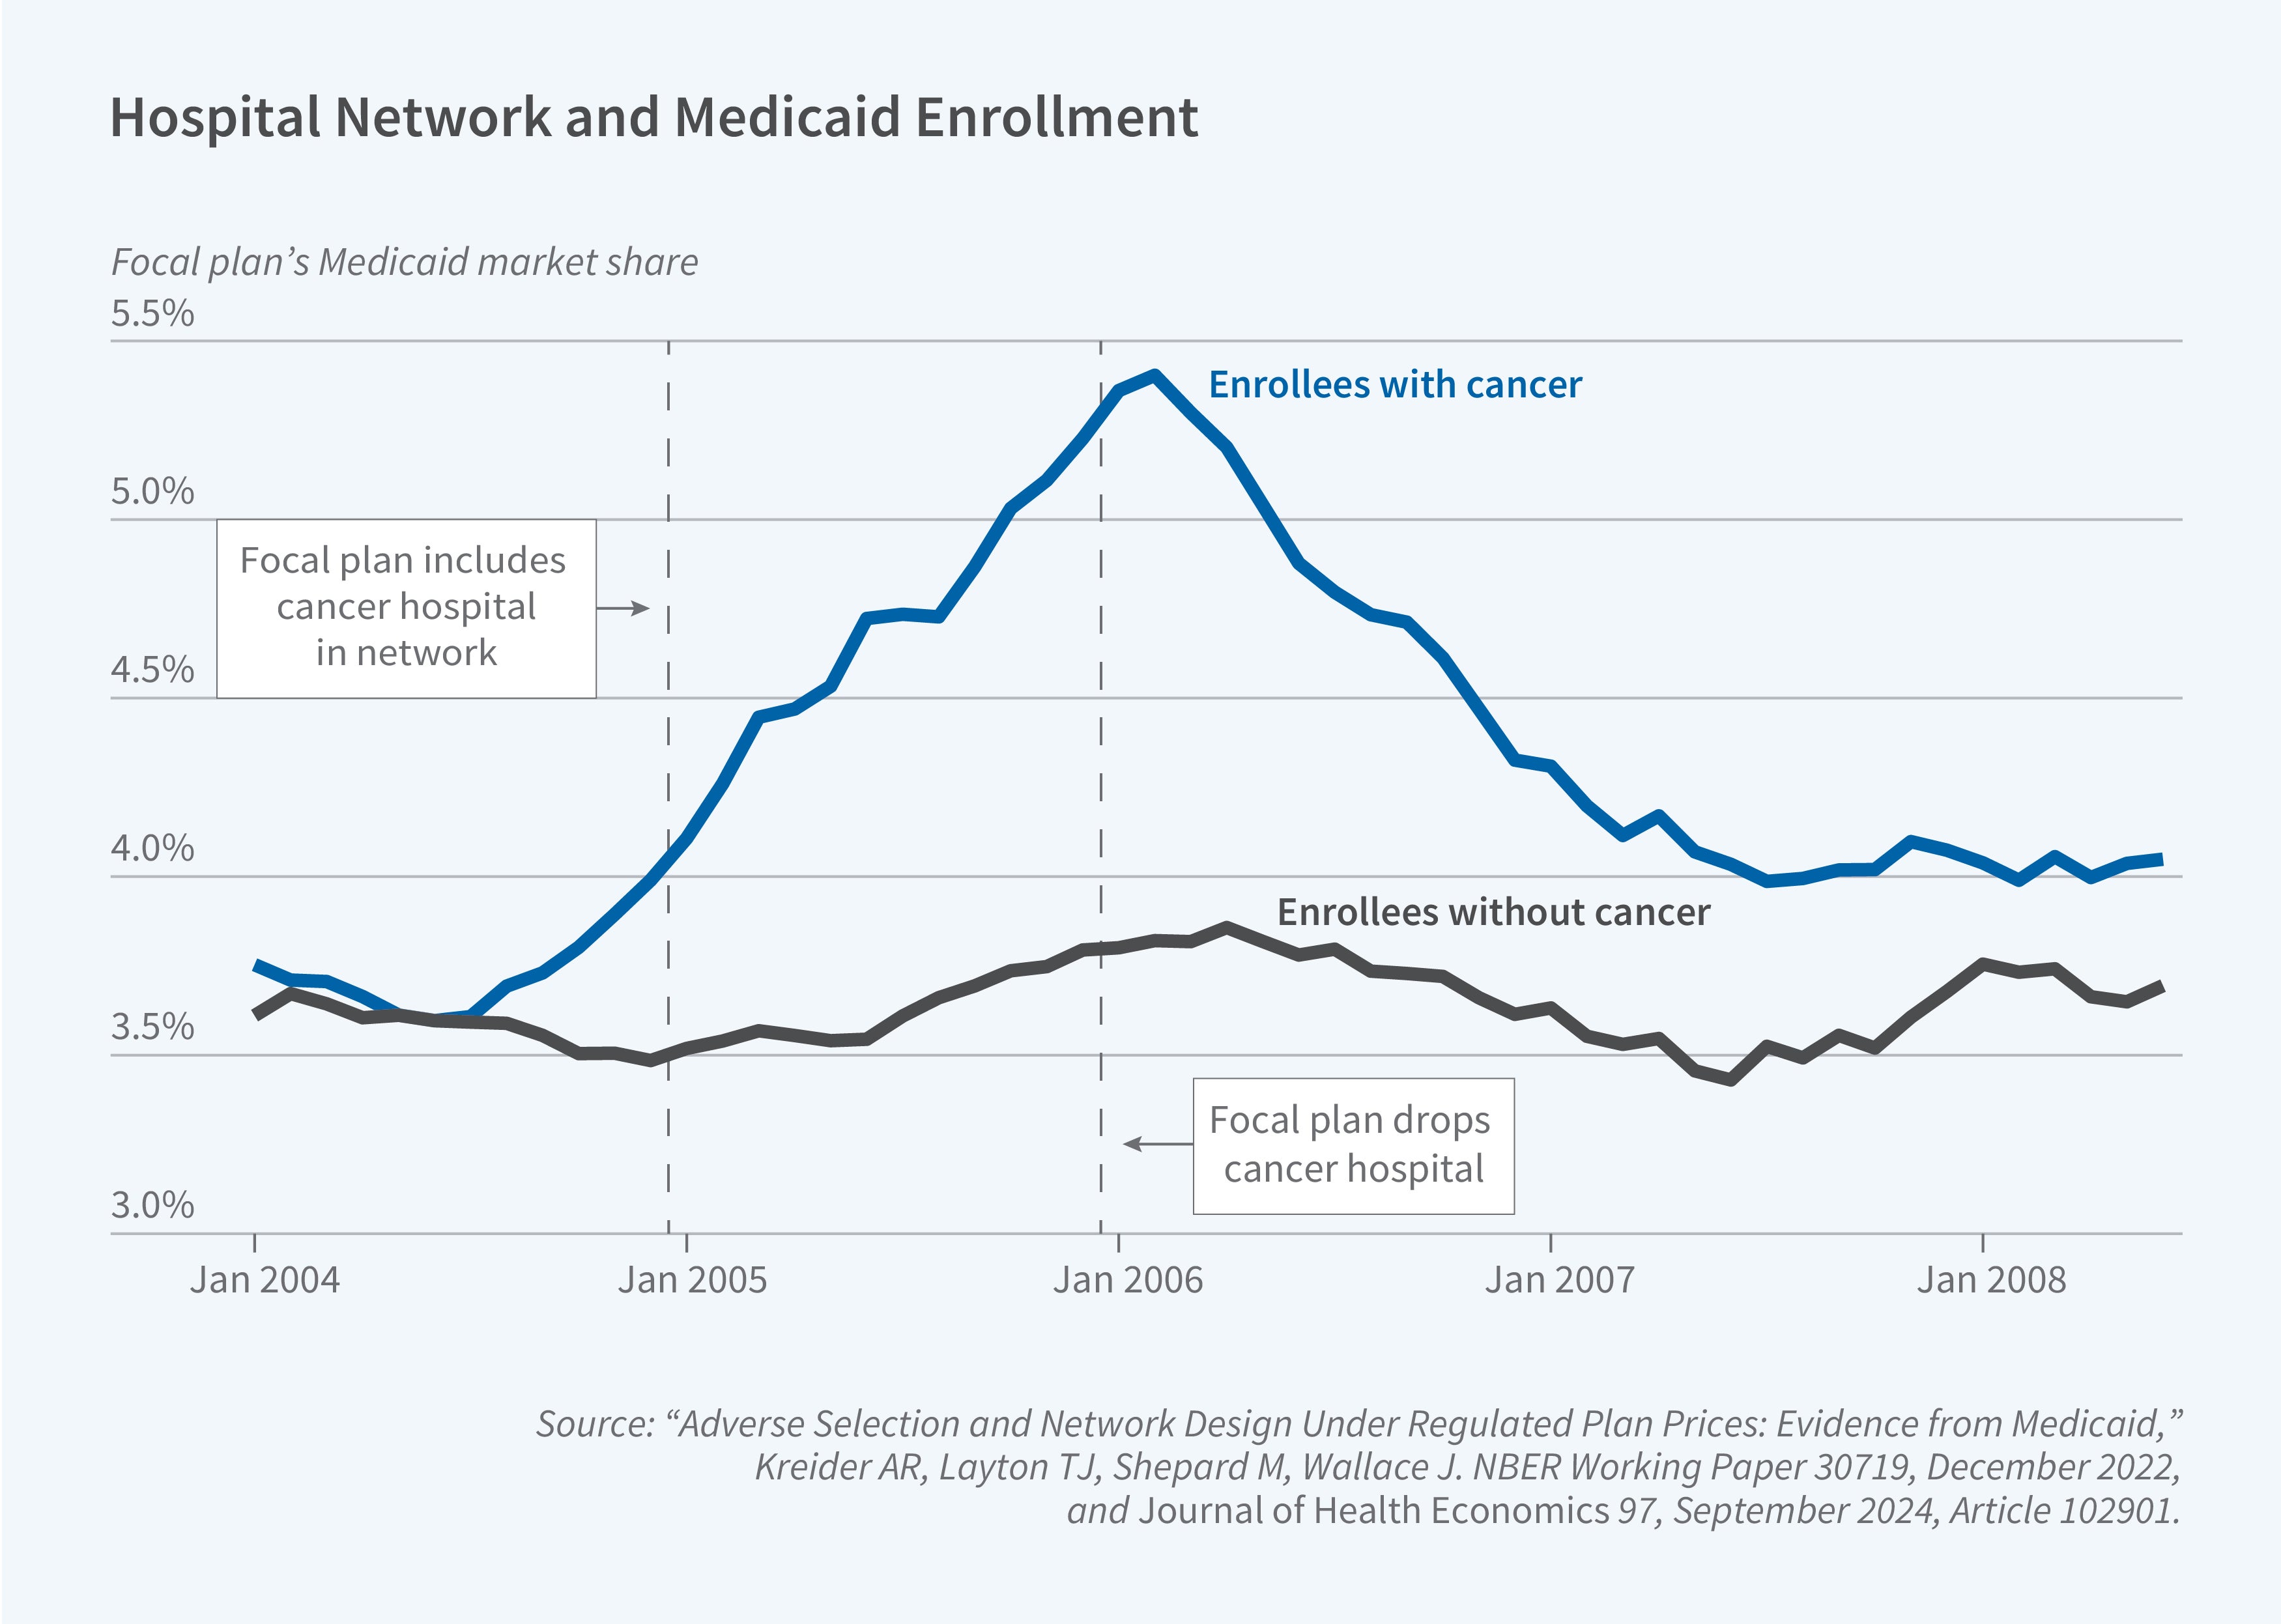
Medicaid competition can also create powerful incentives for "cream-skimming" (attracting low-cost enrollees) and "skimping" on care demanded by high-cost enrollees. We studied this in a natural experiment where one MMC plan in New York State became the only plan in its market to add a world-renowned specialty cancer hospital to its network.10
This decision triggered immediate and severe adverse selection. The plan’s market share among enrollees with cancer spiked by 50 percent, while its market share among enrollees without cancer remained flat (Figure 4). The plan disproportionately attracted enrollees with the most severe and costly conditions, such as metastatic cancer.
In a standard market, the plan could raise its premium to cover these new costs. But in Medicaid's fixed-price, administered-payment system, the plan had no way to offset the losses. The plan’s response was swift and rational: it dropped the hospital from its network just one year later. This demonstrates how selection incentives in a fixed-price market can punish plans for improving quality on dimensions valued by the sickest enrollees, leading to a "race to the bottom" in network adequacy for specialty care.
This competition is also occurring in a rapidly consolidating market. In a separate study, we found that between 2006 and 2020, the number of "parent" firms in MMC decreased by 25 percent, while total enrollment tripled.11 The market is now dominated by a few large, national, for-profit firms.
Program Design and Productivity
Finally, our research explores how Medicaid's high-level design choices—its low provider payments and its state-level flexibility—compare with Medicare and lead to variation in productivity across different types of public health insurance.
Causal Effects of Medicaid vs. Medicare
We leverage a natural experiment to provide new evidence on the cost differences between Medicare and Medicaid. To do so, we examined what happens when people enrolled in Medicaid turn 65 and transition to having Medicare as their primary insurer, with Medicaid providing secondary coverage. We found that total government spending for the same individual jumps by 13 percent at the age 65 threshold.12
This cost increase is largely driven by the higher prices that Medicare pays providers for the same services. There is also a shift in the composition of care under Medicare, with greater use of outpatient and lower use of inpatient care. This finding is bolstered by a related study that also examines the age-65 transition.13 They find that outpatient care utilization increases by about 20 percent upon entering Medicare, and that most of this increase in office visits is explained by physicians' aversion to accepting Medicaid patients.
Taken together, these findings suggest that while Medicaid's low provider payment rates are an effective tool for controlling costs relative to Medicare, this comes at the cost of limiting access. Indeed, we find the transition to Medicare is associated with a beneficial shift for enrollees in the composition of care: more outpatient visits and fewer acute ED visits. The mechanism appears to be that Medicare's higher prices lead to a broader provider network and better access, which in turn leads to higher utilization.
Medicaid State-Level Productivity
Medicaid's design gives states enormous flexibility in program administration. This flexibility is intended to allow states to experiment, generating novel evidence on what works in state-level “laboratories for democracy.” But this raises a key question: Does this flexibility lead to efficient, tailored programs—or just wide variation in spending?
To separate the effect of state programs from the health of state residents, we used a "movers" design, tracking dual-eligible beneficiaries (people enrolled in both Medicare and Medicaid) who move from one state to another.14 This allows us to isolate causal "state effects" (the program) from "person effects" (the enrollee's health).
We found that state-level choices are a dominant driver of spending. Approximately 60 to 70 percent of the cross-state variation in Medicaid spending on duals is due to the state's program design, not to differences in the underlying population. However, when we measured "productivity" by comparing these causal spending effects (inputs) to causal output effects (such as utilization of long-term care), we found only a weak positive relationship.
This suggests that states have large differences in their "productivity"—that is, how effectively they convert program dollars into healthcare services for beneficiaries. More research is needed to understand whether these results apply to other Medicaid populations, which policies matter most for this productivity, and whether states are actively learning from each other to improve program outcomes.
Conclusion
Our research shows that the economics of the Medicaid program are complex and defined by a series of difficult trade-offs. The program's evolution into a massive, privatized, and decentralized system has created a unique set of economic forces. Outsourcing to private plans is not a panacea for cost control; its effects are highly heterogeneous, depending on the public plan it replaces and the population it serves. In some settings, privatization can even lead to dynamic cost increases and worse medical outcomes.
Competition within the private Medicaid segment differs greatly from textbook economic markets. Because they do not charge beneficiaries, plans compete entirely on provider network access. They are strongly influenced by adverse selection that pushes them to exclude benefits, such as access to top cancer hospitals, that are used by the sickest people. While Medicaid's design keeps it lower-cost than Medicare, this is achieved largely through low provider payments that appear to limit access to physician care and drive up ED utilization. The flexibility granted to states has produced a program marked by enormous, policy-driven differences in spending and productivity.
Endnotes
"10 Things to Know About Medicaid Managed Care,” Hinton E, Raphael J. KFF, February 27, 2025.
"Has the Shift to Managed Care Reduced Medicaid Expenditures? Evidence from State and Local‐Level Mandates,” Duggan M, Hayford T. Journal of Policy Analysis and Management 32(3), Summer 2013, pp. 505–535.
“The Dynamic Fiscal Costs of Outsourcing Health Insurance - Evidence from Medicaid,” Layton T, Politzer E. NBER Working Paper 33302, December 2024, and Journal of Public Economics 247, July 2025, Article 105417.
“Private vs. Public Provision of Social Insurance: Evidence from Medicaid,” Layton TJ, Maestas N, Prinz D, Vabson B. NBER Working Paper 26042, July 2019.
“The Private Provision of Public Services: Evidence from Random Assignment in Medicaid,” Macambira DA, Geruso M, Lollo A, Ndumele CD, Wallace J. NBER Working Paper 30390, January 2025.
“The Private Provision of Public Services: Evidence from Random Assignment in Medicaid,” Macambira DA, Geruso M, Lollo A, Ndumele CD, Wallace J. NBER Working Paper 30390, January 2025.
“What Difference Does a Health Plan Make? Evidence from Random Plan Assignment in Medicaid,” Geruso M, Layton TJ, Wallace J. NBER Working Paper 27762, October 2021, and American Economic Journal: Applied Economics 15(3), July 2023, pp. 341–379.
“Adverse Selection and Network Design Under Regulated Plan Prices: Evidence from Medicaid,” Kreider AR, Layton TJ, Shepard M, Wallace J. NBER Working Paper 30719, December 2022, and Journal of Health Economics 97, September 2024, Article 102901.
“Medicaid Managed Care: Substantial Shifts in Market Landscape and Acquisitions, 2006–20,” Li B, Layton TJ. Health Affairs 44(7), July 2025, pp. 862–868.
“Medicaid vs Medicare: Evidence from Medicaid to Medicare Transitions at 65,” Layton T, Maestas N, Prinz D, Shepard M, Vabson B. NBER Center Paper NB20-15, February 2024.
“Are Medicaid and Medicare Patients Treated Equally?” Ackley C, Dunn A, Liebman E, Shapiro AH. Federal Reserve Bank of San Francisco Working Paper Series, March 2025.
“Estimating Variation in Productivity Across State Medicaid Programs: Evidence from Dual-Eligibles,” Layton T, Maestas N, Prinz D, Shepard M, Vabson B. NBER Center Paper NB19-24, October 2024.


