New Developments in Financial Markets: The Digital Revolution; Fintechs; Buy Now, Pay Later; and Geopolitics
We are witnessing a transformative era in financial markets, driven by the digital revolution and the proliferation of data. Digital footprints now accompany virtually every financial transaction, creating new opportunities for data collection and analysis across individuals, firms, and governments. This surge in data availability is reshaping how financial products are offered, how risk is assessed, and how policies are designed.
This summary highlights four strands of recent research that illustrate these shifts. The first explores how the public provision of a digital payment infrastructure can expand access to formal credit—particularly for underserved populations. The second examines how private sector innovation, such as Buy Now, Pay Later (BNPL) lending, leverages digital data to reshape consumer credit. The third investigates how traditional banks are responding to financial technology (fintech) disruption through venture capital (VC) investments in startups, often leading to strategic partnerships. Finally, the fourth looks at government innovation—through the digital euro—and presents new evidence on how geopolitical considerations are beginning to shape financial innovation. Collectively, this research suggests that the creation of new dynamics among financial service providers, consumers, and policymakers is readjusting the old order.
The Digital Revolution in Credit
The past decade has seen massive growth in financial technology and fintech companies. Fintechs have attracted more than $1 trillion in investment between 2010 and 2021. This raises questions about whether the use of new technologies such as alternate credit scoring mechanisms might improve access to credit. My work with Tobias Berg, Valentin Burg, and Ana Gombović highlights the information content of digital footprints for predicting consumer default.1 We show that even a bare-bones digital footprint has as much information as a credit bureau score, that it complements credit bureau information, and that the use of digital footprints affects access to credit and reduces default rates.
Digital footprints can have real effects on credit access: Customers who fare poorly on traditional credit bureau score metrics can gain access to credit if their digital footprint conveys positive information, while the opposite situation can emerge for customers in the middle of the credit bureau score distribution when digital footprint information is negative. While this work shows the potential of digital footprints for lending decisions and financial inclusion, several questions emerge. How do you facilitate digital footprint creation for the underserved? Digital payment infrastructure, such as the Unified Payments Interface (UPI), provides a possible answer. UPI is a public infrastructure that allows cross-platform digital payments, enabling customers to seamlessly transact across any banking or third-party application. Studying the link between UPI and credit is important as it can highlight a distinct macrolinkage: can payment infrastructure improve overall financial deepening?
In recent work, Shashwat Alok, Pulak Ghosh, Nirupama Kulkarni, and I use India’s 2016 launch of UPI, one of the world’s most ambitious and large-scale digital public payment infrastructures, as a natural experiment to study these questions.2 To fix ideas, a customer on Google Pay, a popular UPI payment application, can move funds from Bank A to a customer or merchant account at Bank B without having to log into the respective banks’ native applications, and regardless of whether the counterparty has Google Pay. Specifically, users are not locked within an app, unlike users of Venmo, PayPal, or some other apps in the US, and can make payments across platforms using a unified interface. Within a brief period, UPI became the dominant means of digital payments in India, with over 300 million individuals and 50 million merchants using UPI. As of October 2023, nearly 75 percent of all retail digital payment transactions were through UPI.
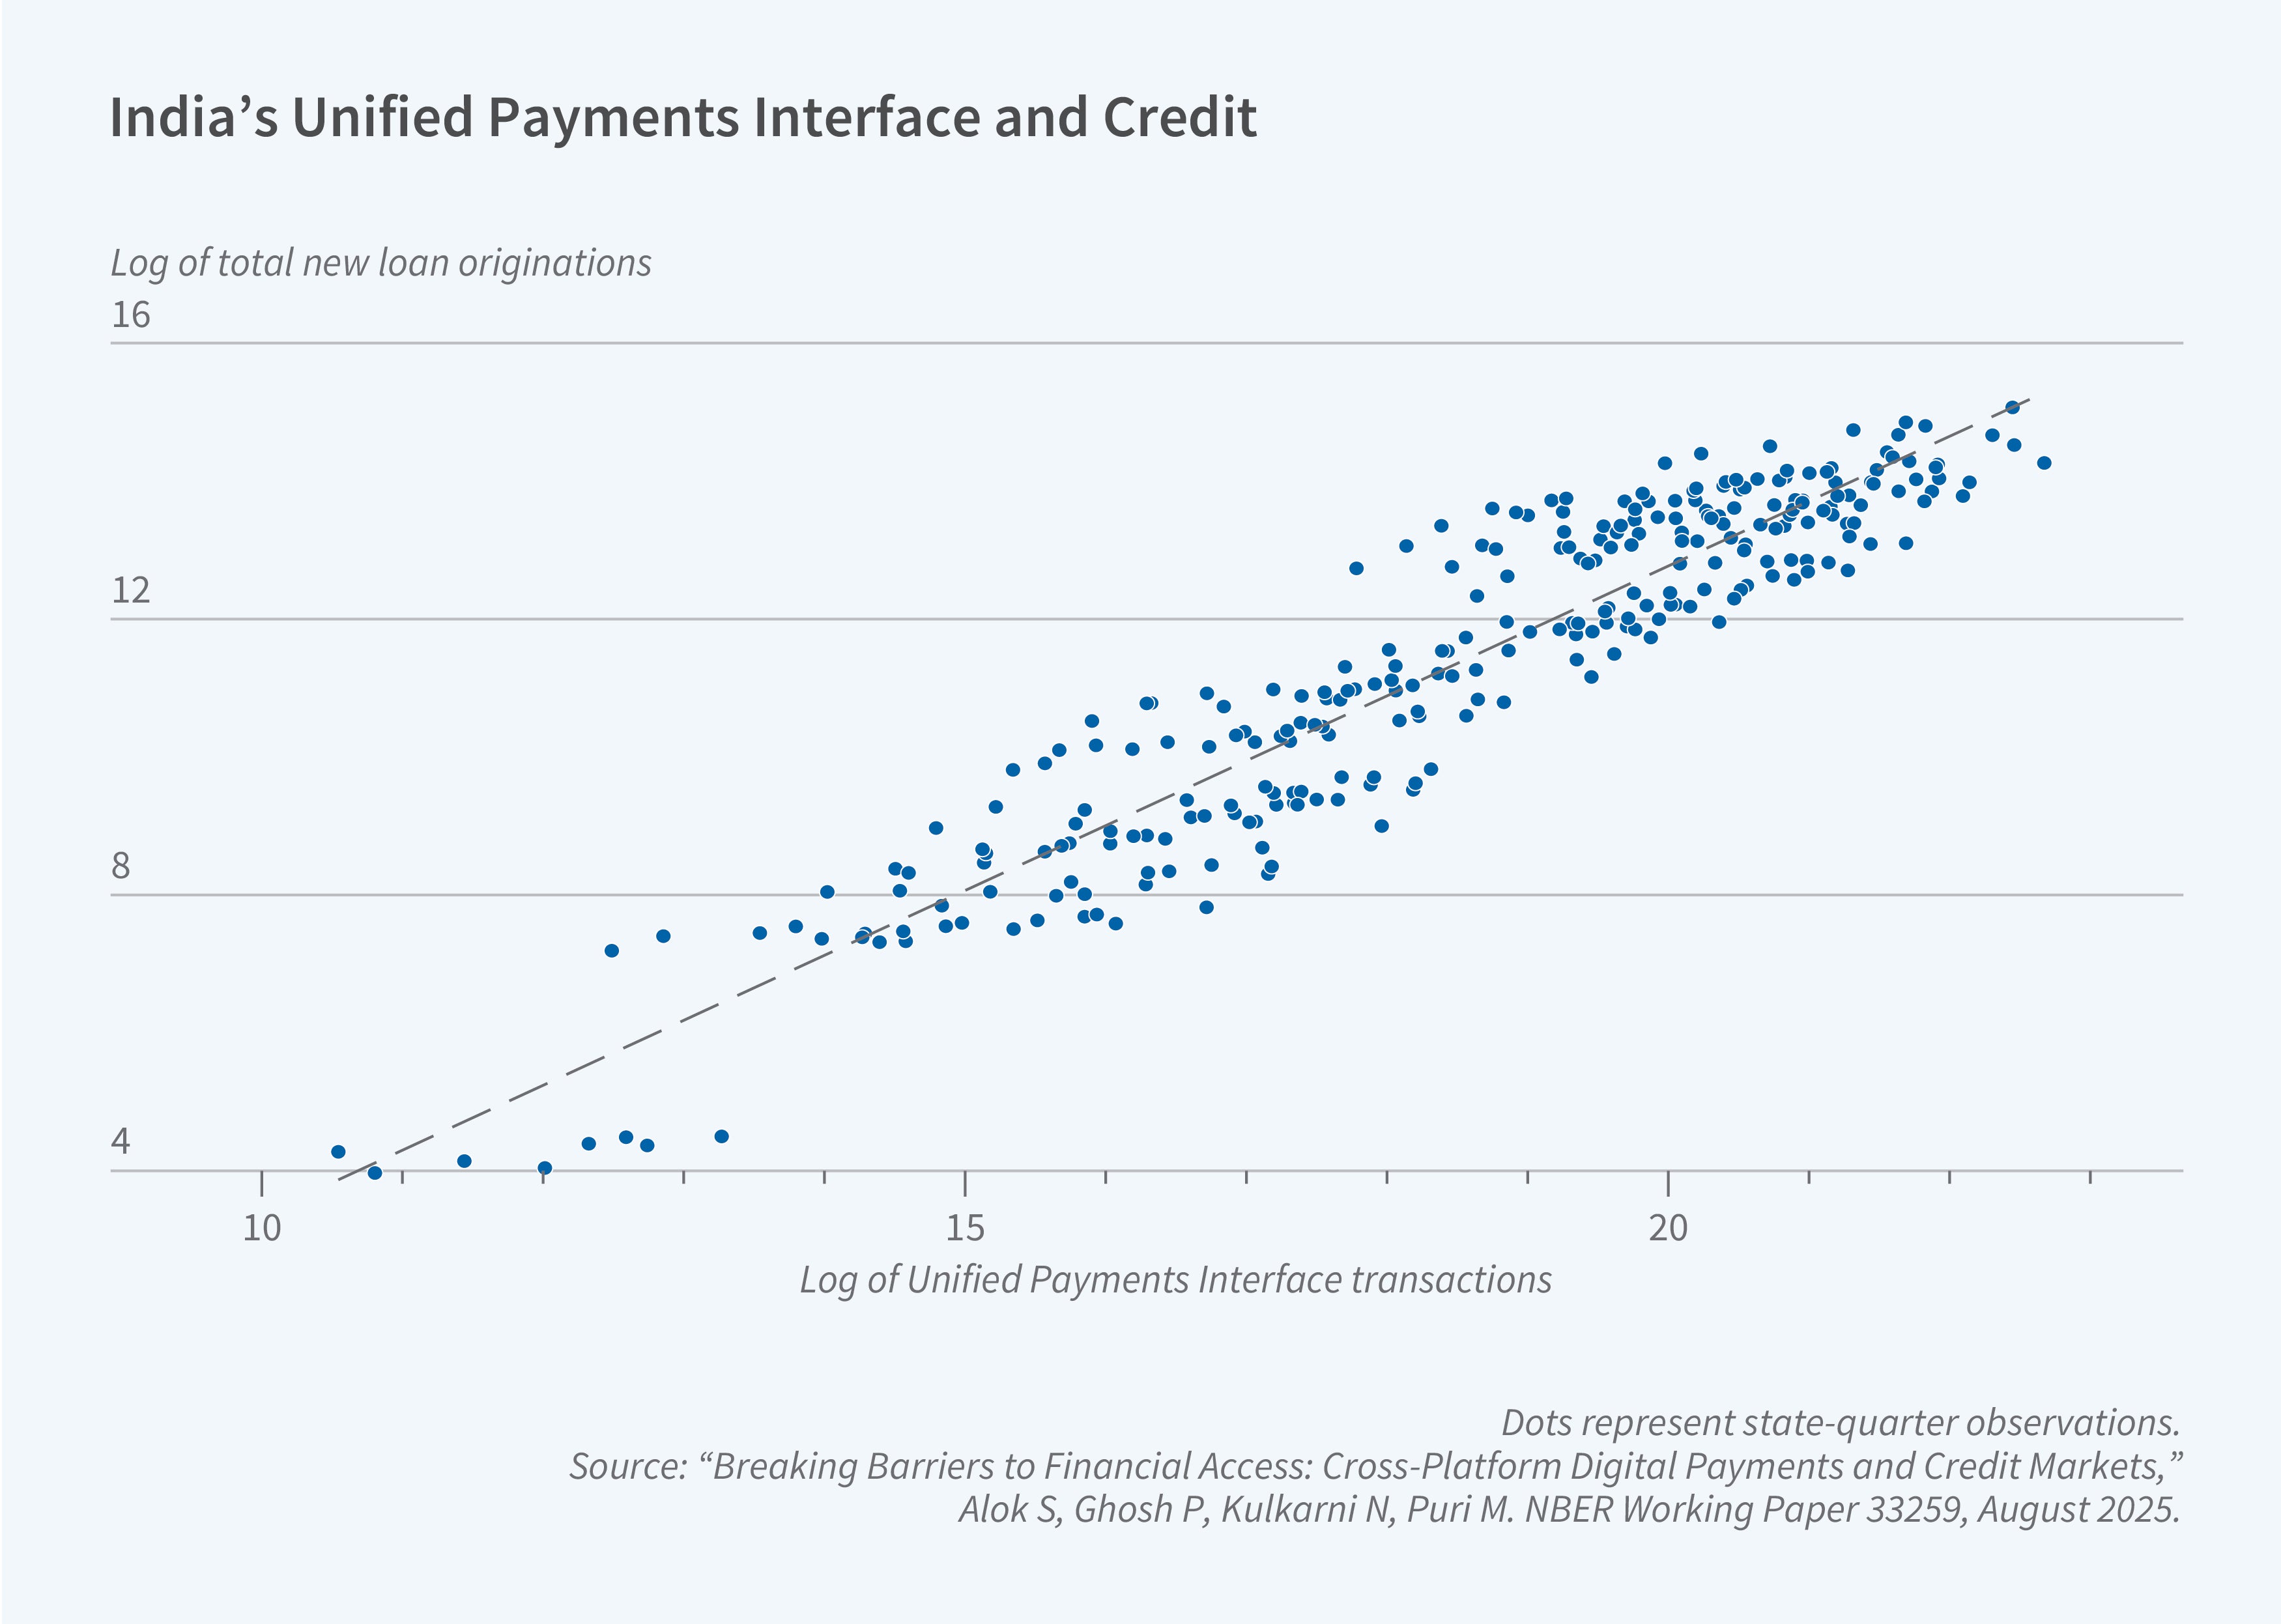
Using proprietary regulatory datasets that cover the universe of consumer loans alongside payments, internet rollout, and bank account penetration data, we examine how UPI adoption influenced credit supply by banks (incumbents) and fintechs (new entrants). We document four main findings. (i) UPI adoption substantially increased financial deepening, measured by the number of loans per capita, particularly for subprime and new-to-credit borrowers. (ii) Banks and fintechs responded differently: banks mainly increased lending to prime borrowers, whereas fintechs expanded across all segments—and only fintechs extended credit to new-to-credit customers. (iii) Complementarities matter: UPI’s impact was strongest in regions with affordable internet access (following Reliance Jio’s low-cost 4G rollout) and where households had been recently onboarded into the banking system through new bank accounts. (iv) Importantly, increased credit access did not come at the cost of more defaults, suggesting that UPI-enabled digital footprints helped lenders identify underserved but creditworthy borrowers.
Private Innovation: Buy Now, Pay Later
BNPL products are an archetypal example of private innovation in fintech lending. BNPL products have seen stunning growth across the globe. Global BNPL volumes were $50 billion in 2019; they have risen tenfold to $500 billion in 2024. BNPL bundles the sale of a product with a consumer loan. It combines three features that have been made possible by technological advancements.
User experience
BNPL offers an improvement in user experience and a faster loan granting process compared to traditional consumer lending products. The data required for a lending decision is already collected during the checkout process (e.g., the name and address of the borrower), so taking out a BNPL loan takes little additional effort on the part of the consumer.
Screening
BNPL providers use digital footprint data to score customers, thereby improving screening without requiring applicants to fill out burdensome application forms. Fintech lenders typically process applications faster and require less manual input from the applicant. An increase in convenience and speed appear to have been central to fintech lending’s growth and we discuss the evidence surrounding this in a joint paper with Berg and Andreas Fuster.3
Bundling
BNPL is frequently offered at below-market rates. BNPL therefore bundles the sale of a product with a subsidized loan, effectively offering lower prices to customers with bad credit. BNPL thereby allows merchants to price discriminate among customers with a different willingness to pay. Such bundling has been more common in larger-scale purchases, such as a car purchase with an auto loan, but technology has enabled targeted bundling for smaller purchases at scale.
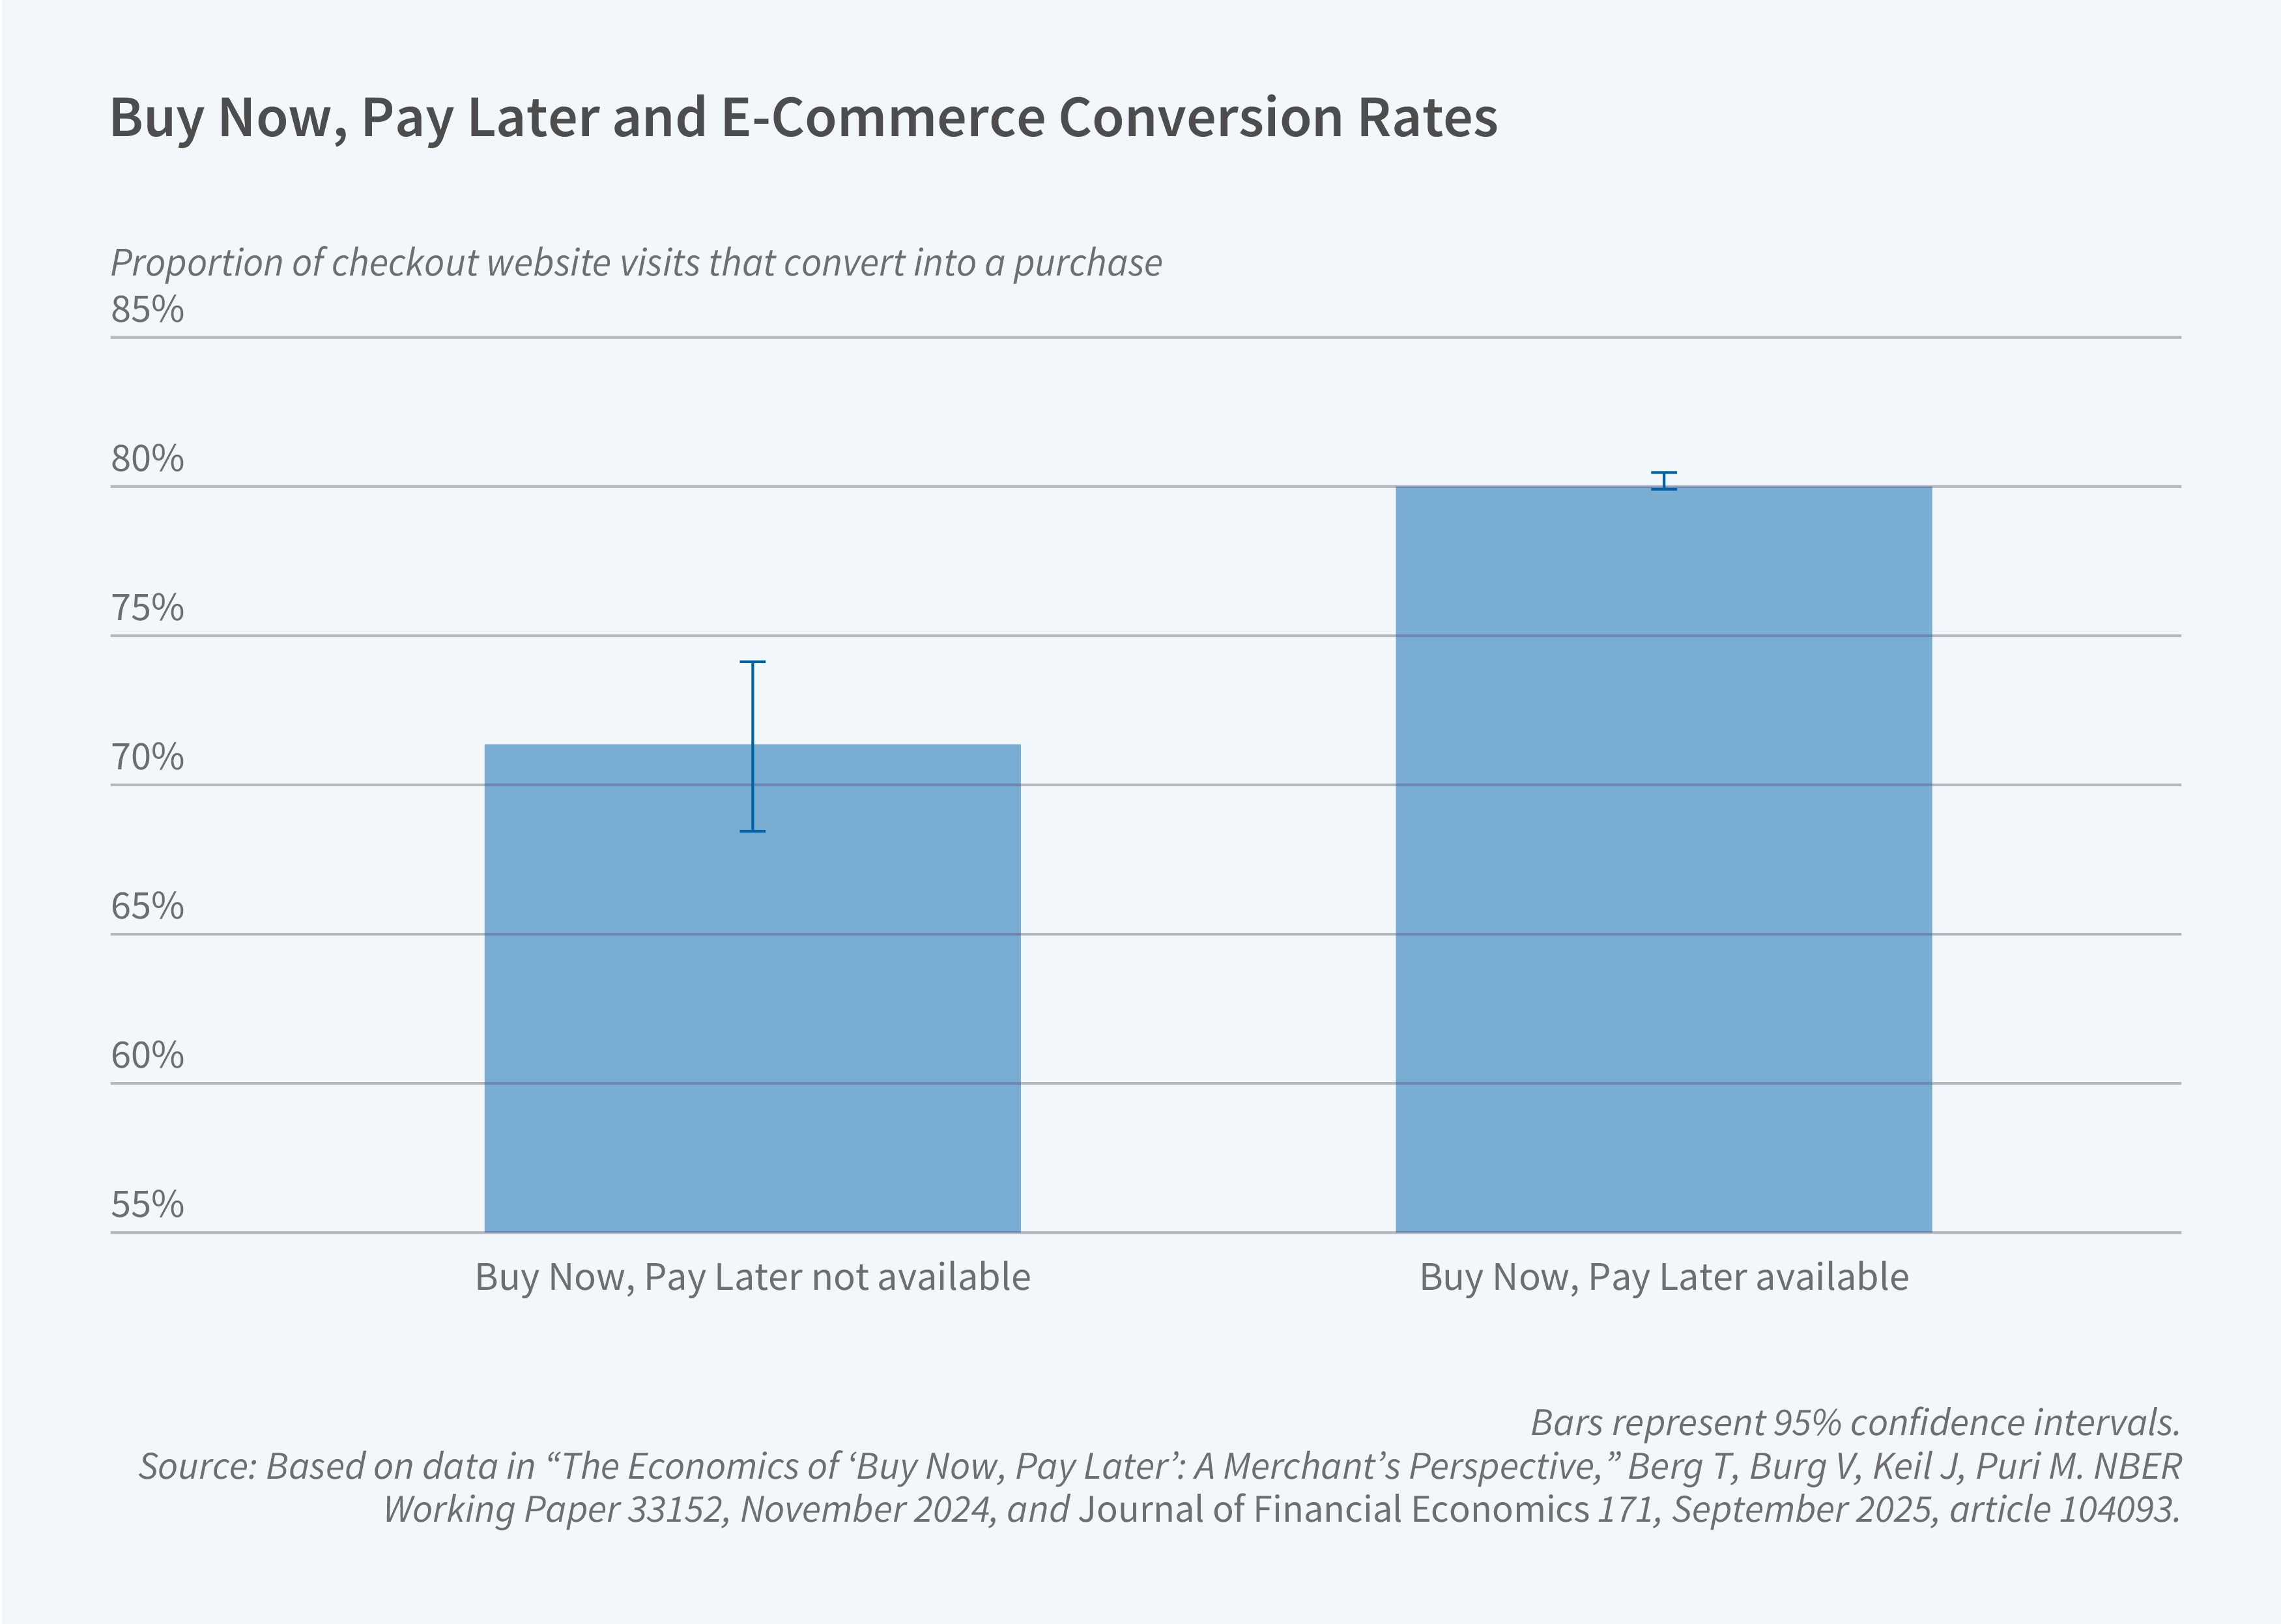
In work with Berg, Valentin Burg, and Jan Keil, we document that—from an economic point of view—BNPL can best be understood as a bundle between a product and a subsidized loan.4 Many BNPL products have a 0 percent interest rate, implying that the higher a consumer’s cost of borrowing with traditional products such as credit cards, the higher the implicit subsidy from a 0 percent BNPL loan. The effect is the opposite of the reverse Robin Hood effect observed for credit card payments. This economic mechanism helps explain why BNPL significantly increases sales. In a randomized experiment, we show that offering BNPL increases conversion rates (i.e., the likelihood of buying a product conditional on having added it to a shopping basket) from 70 percent to 80 percent and leads to the purchase of higher-value items, thereby increasing sales by 20 percent.
Banks and Fintech
Over the past two decades, banks have increasingly made equity investments in fintech startups. By 2022, more than 70 percent of publicly listed US banks that had ever made venture investments in startups had invested in fintech startups, up from roughly 20 percent in 2001. The number of such deals climbed from less than 10 before 2011 to 66 in 2022, and the annual dollar amount committed jumped from only $21 million in 2001 to $485 million in 2022 (and peaked in 2021 with $1.4 billion in investments). The surge is not just riding a bigger fintech wave; banks’ fintech deals have grown faster than the fintech sector itself, and the share of all bank VC rounds targeting fintech has jumped from 4 percent to about 35 percent, far outpacing the shift toward the sector by other venture capital investors.
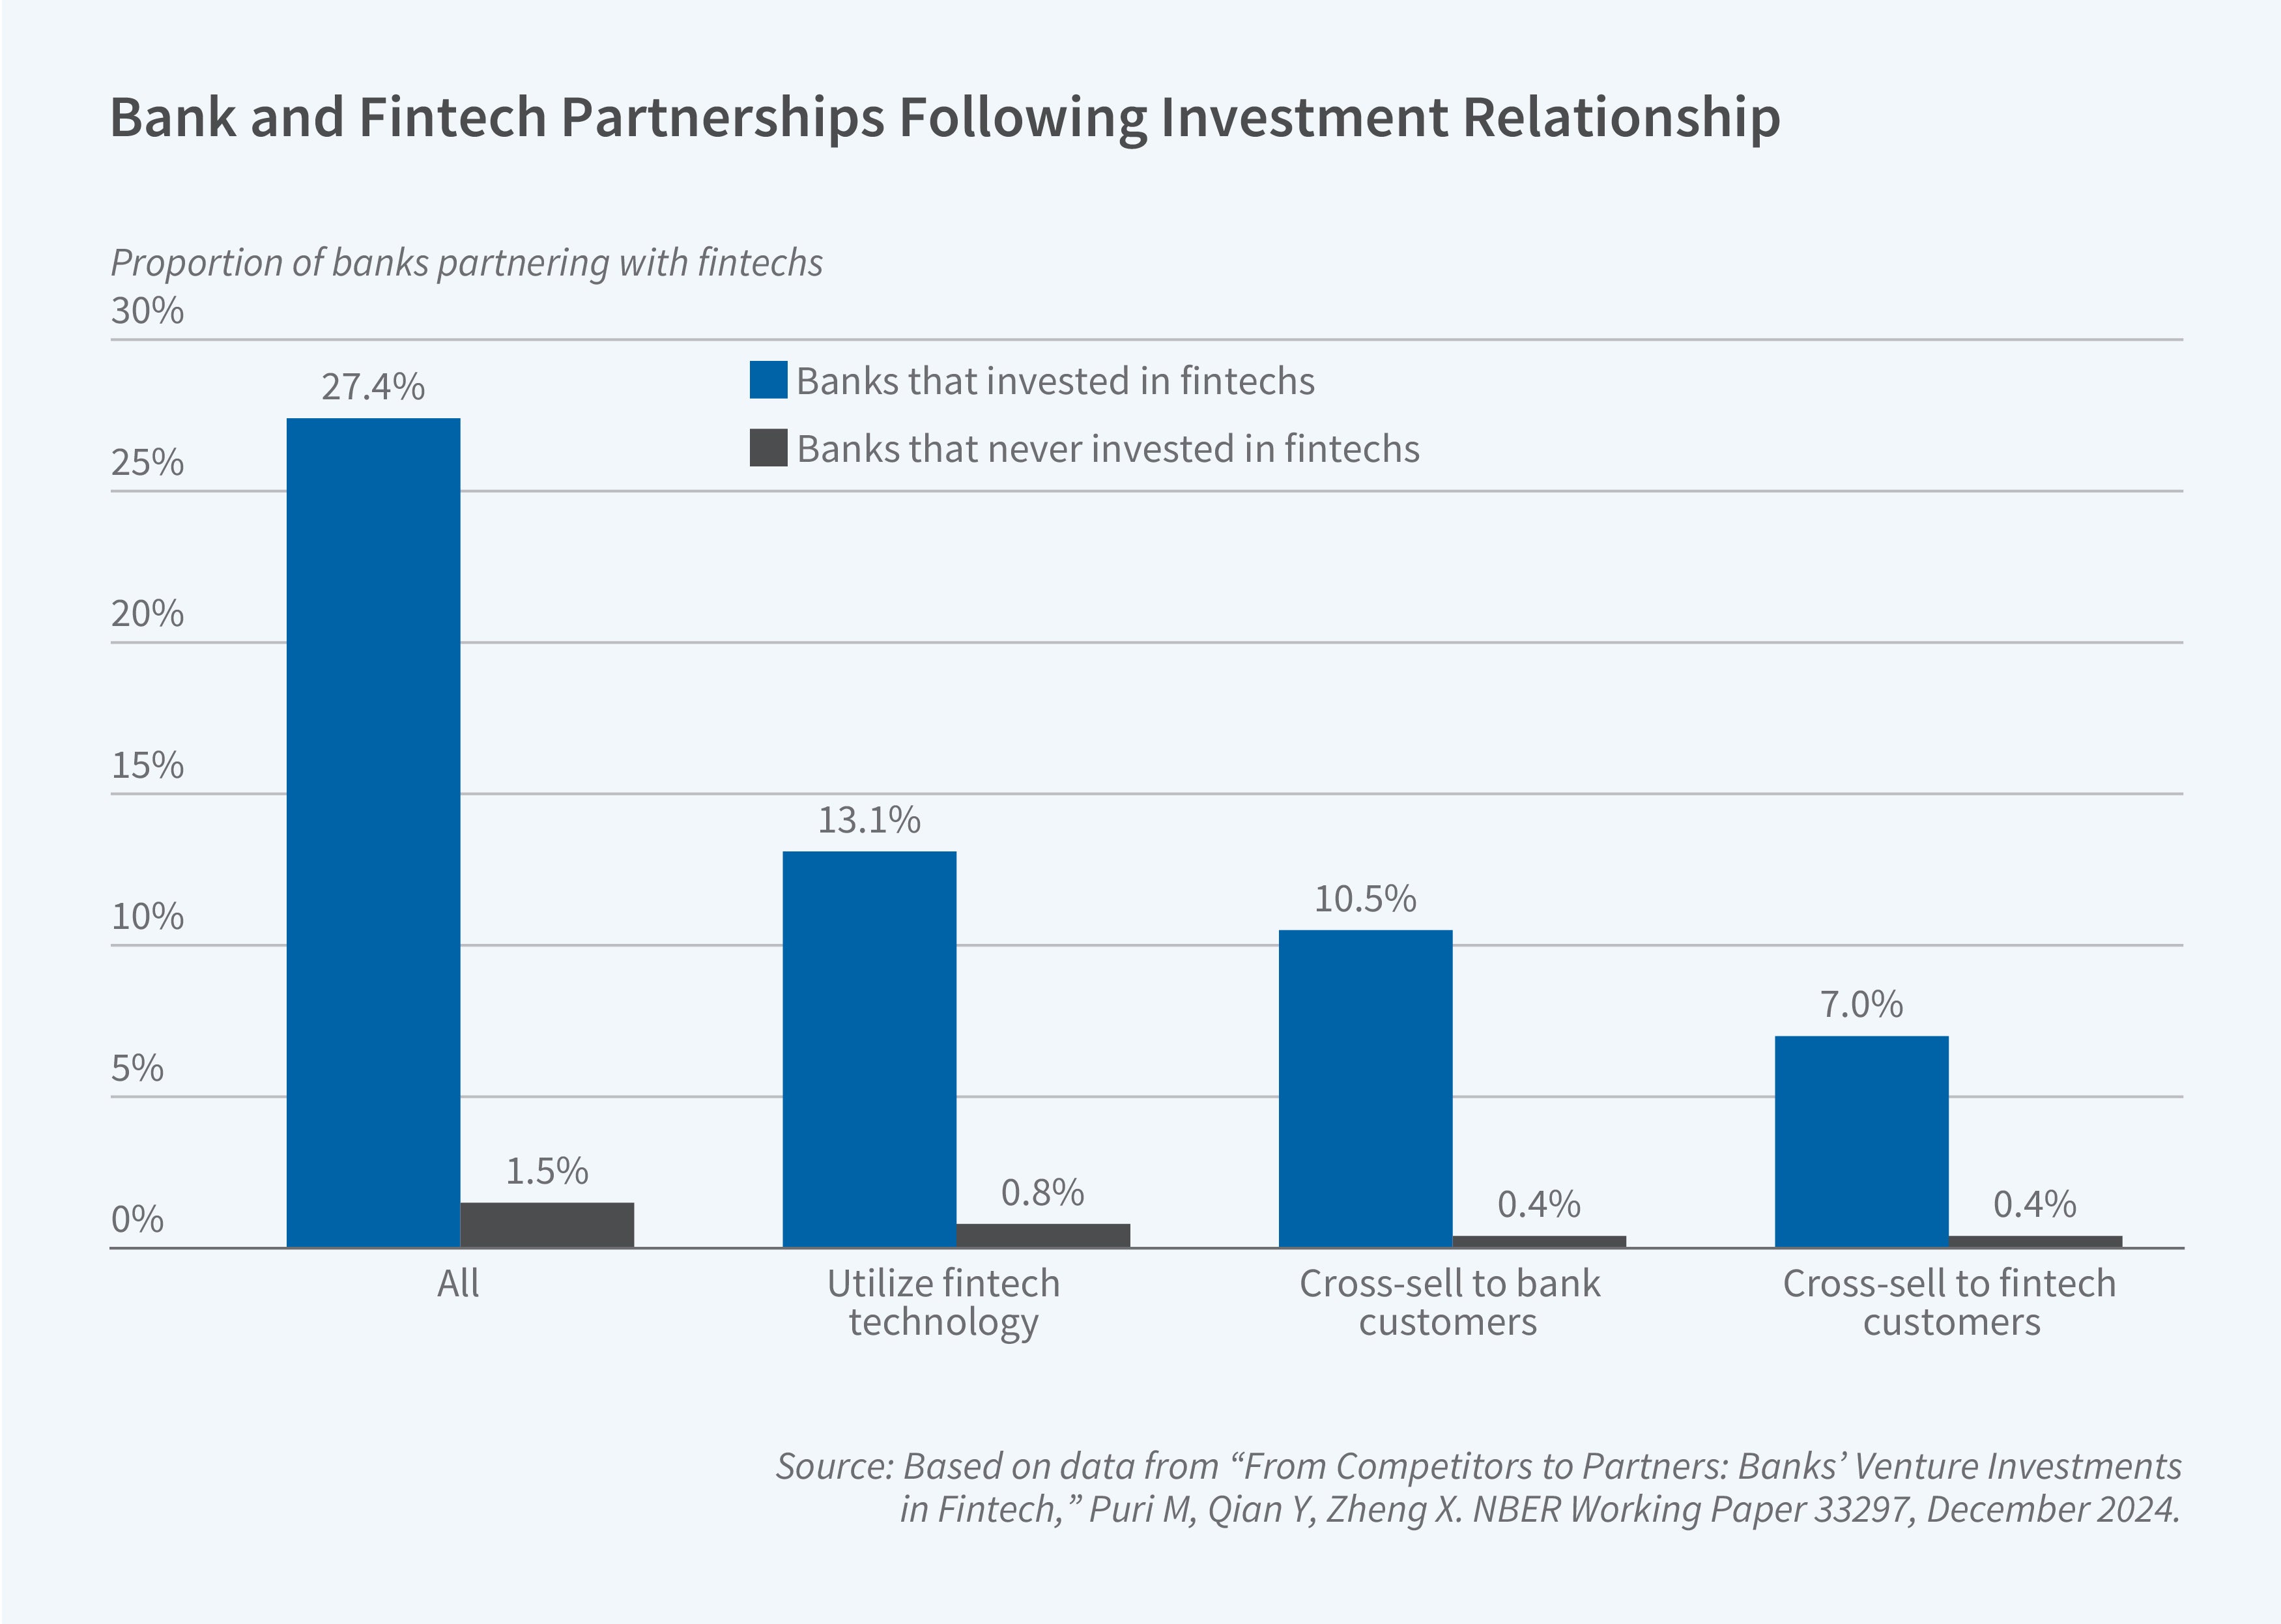
Why invest in would-be competitors? Yiming Qian, Xiang Zheng, and I investigate this question. Three patterns stand out.5 First, banks facing steep local competition from fintech mortgage lenders are the ones most likely to invest in fintech startups. Second, they pick fintech startups that exhibit high business and technological relatedness to their own operations. Third, equity investments pave the way for collaboration. Nearly one-third (29.6 percent) of bank-fintech pairs formed operational partnerships after establishing an investment relationship, compared to less than 2 percent of matched pairs without such investment relationships. Figure 3 illustrates that gap. The characteristics of these alliances range from banks embedding the startup’s code in their own apps to cross-selling each other’s products, and they coincide with banks’ increased patent citations to their fintech partners.
Geopolitics and the Payment Sector
Central banks have become active players in the consumer payment market in the last decade. Under the guidance of the Reserve Bank of India, the UPI payment system was developed in 2016. The Central Bank of Brazil launched its Pix payment system in 2020, and the European Central Bank (ECB) is widely expected to launch the digital euro—a retail payment system—in the 2020s. In work with Berg, Keil, and Felix Martini, we show that these developments often have a geopolitical angle.6 Payment infrastructure forms part of a country’s critical infrastructure. Central banks are reluctant to leave digital payment reins in the hands of foreign players. With the increasing use of payment systems to foster geopolitical goals, the autonomy over payment systems has played a central role in the development of payment systems and central bank digital currencies around the globe.
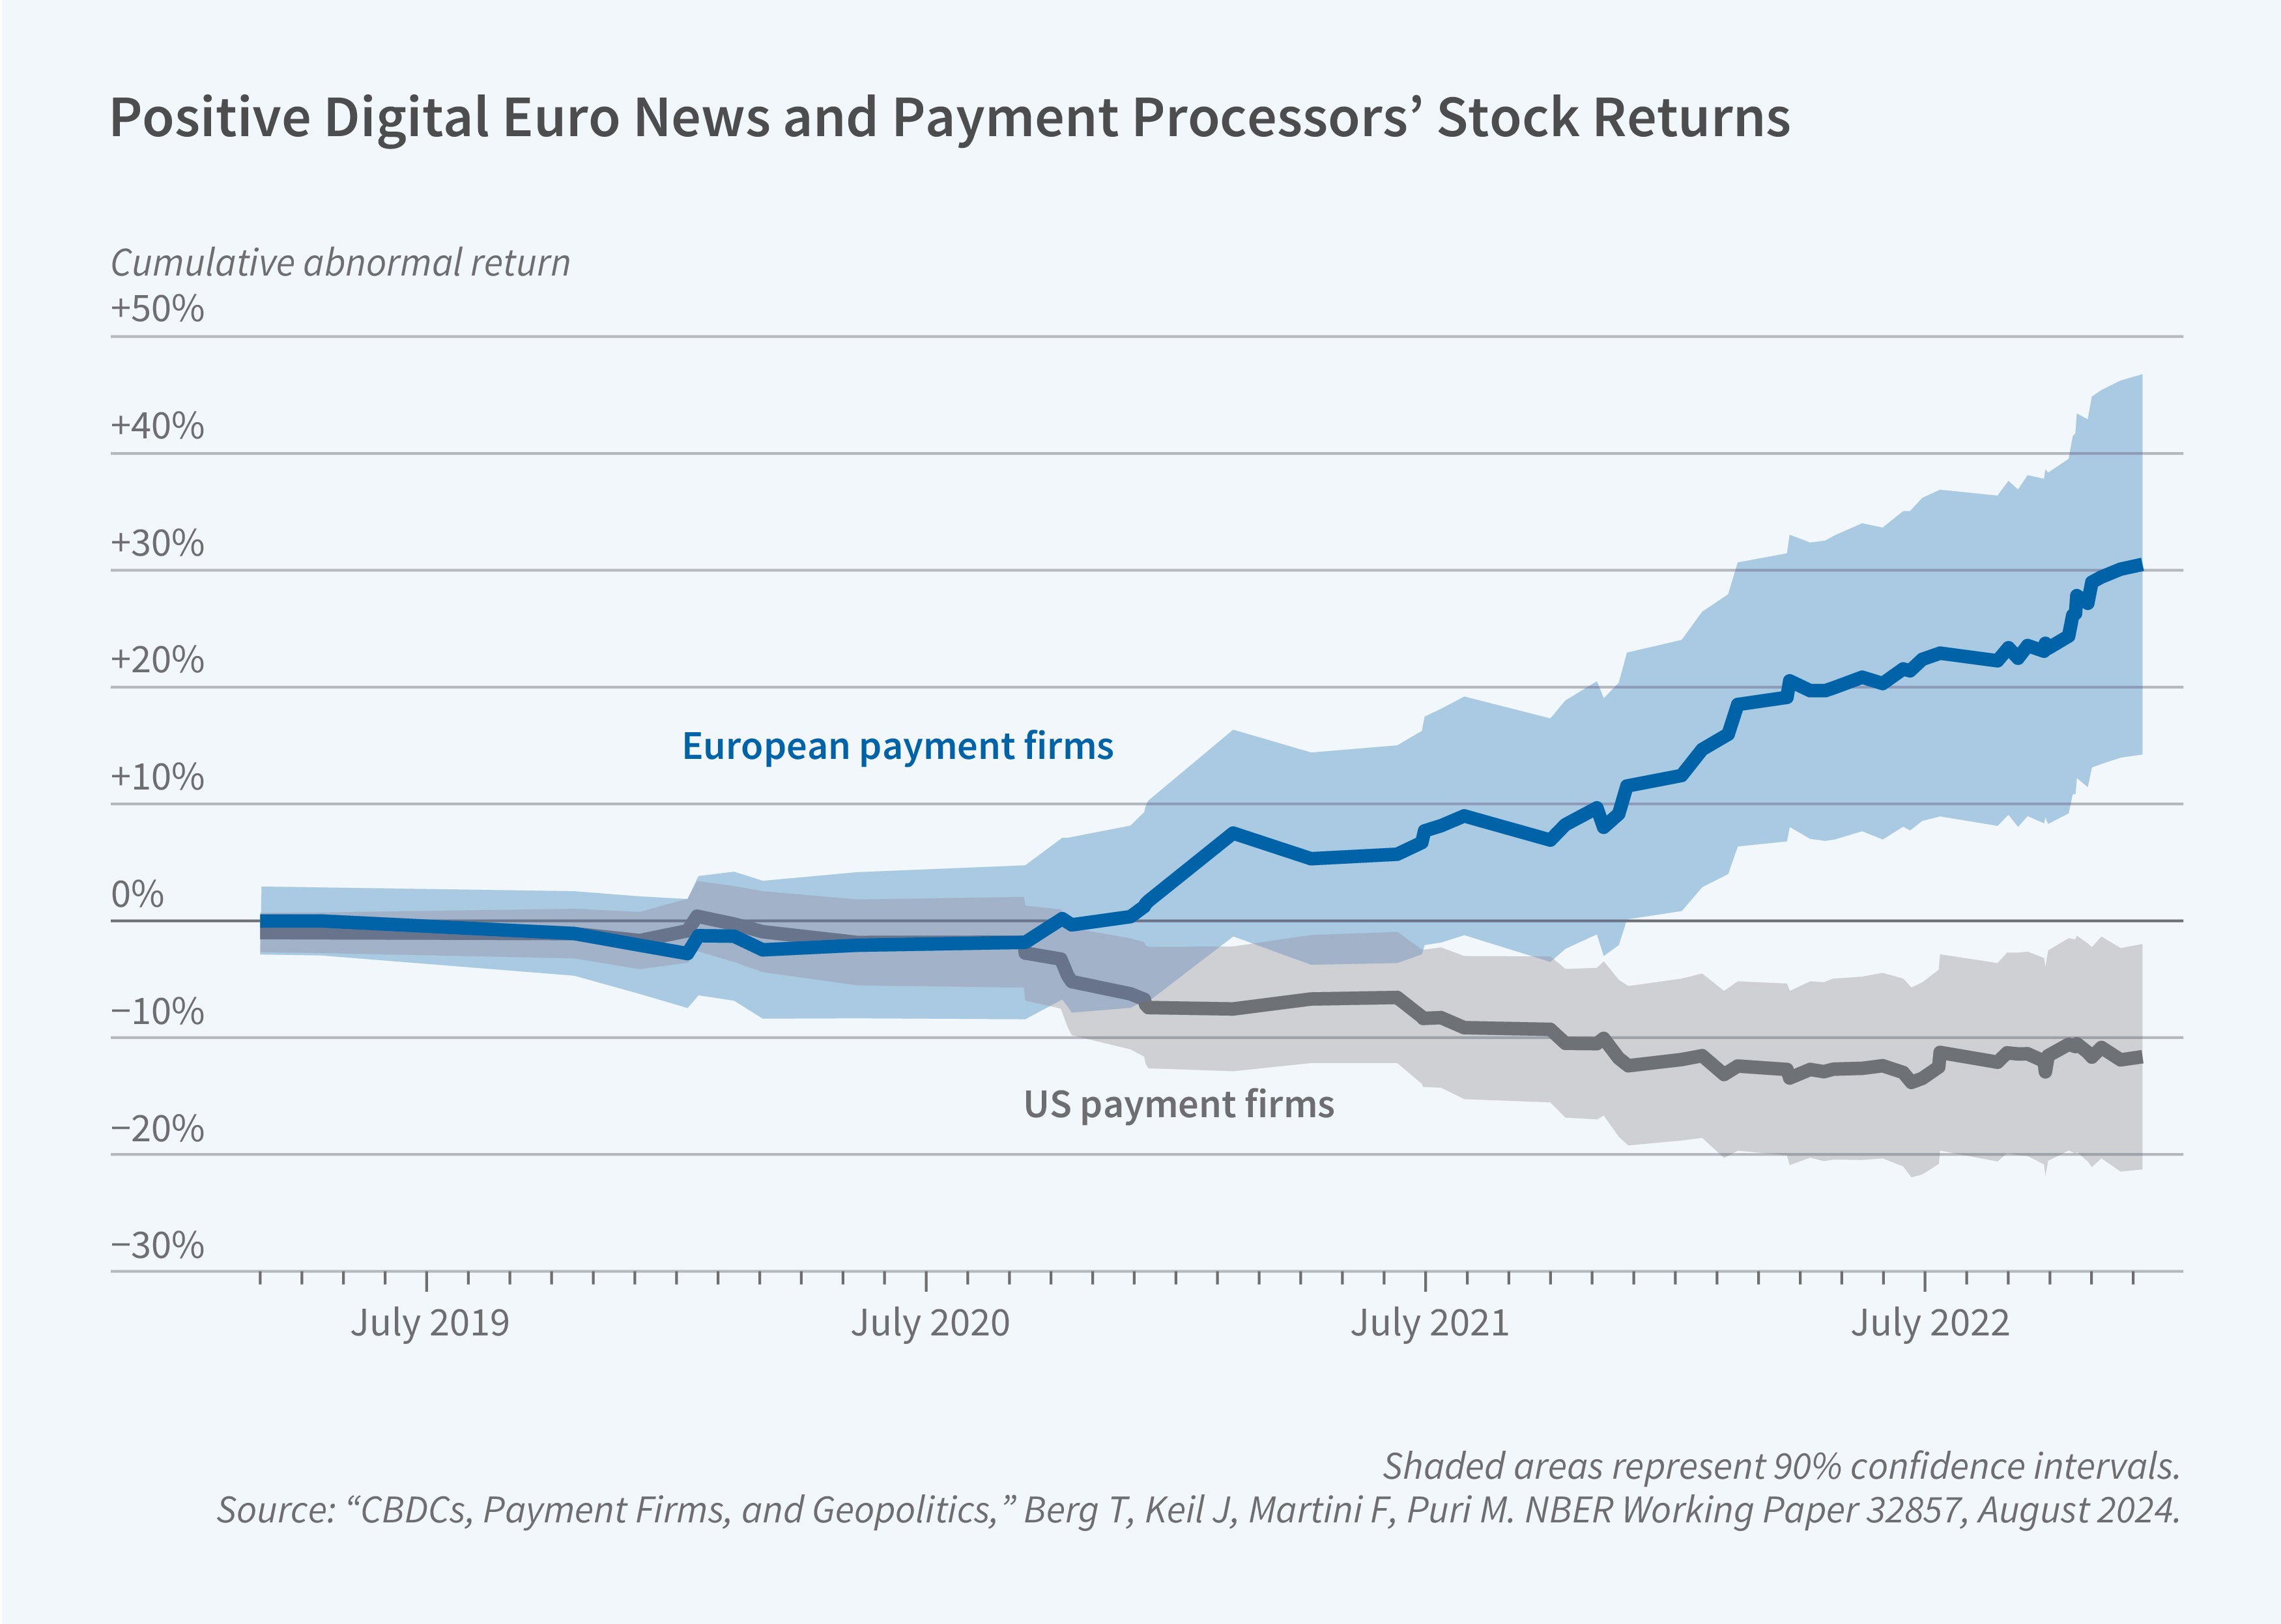
In the context of the digital euro project, most major announcements were made in speeches by members of the executive board of the ECB or of one of the national central banks in the eurozone. We show that positive news about the digital euro—implying that it will come sooner or more forcefully than expected previously—results in a negative stock market reaction for US payment firms (such as Visa, Mastercard, or PayPal) and a positive stock market reaction for European payment firms. This event study evidence is backed up by textual analysis of central bank speeches, annual reports, conference calls, and comments from industry associations. We also highlight how the institutional arrangements of the digital euro are designed to benefit European payment firms at the expense of US payment firms. We provide some of the first evidence of the importance of geopolitical motives in financial innovation in the current global environment.
Across these studies, a unifying theme emerges: Digital transformation is not just reshaping products and services but reconfiguring the relationships between consumers, financial institutions, and policymakers. Whether through expanded access to credit enabled by public infrastructure, new lending models pioneered by fintechs, strategic collaborations between incumbents and disruptors, or geopolitical motives driving future financial architecture, the financial landscape is undergoing a profound reordering. As digital systems continue to mature, their design—public or private—will increasingly shape who gets credit, how financial activity is intermediated, and how countries exert influence in a more fragmented and strategically contested global economy.
Endnotes
“On the Rise of FinTechs – Credit Scoring Using Digital Footprints,” Berg T, Burg V, Gombović A, Puri M. NBER Working Paper 24551, July 2018, and The Review of Financial Studies 33(7), July 2020, pp. 2845–2897.
“Breaking Barriers to Financial Access: Cross-Platform Digital Payments and Credit Markets,” Alok S, Ghosh P, Kulkarni N, Puri M. NBER Working Paper 33259, August 2025.
“FinTech Lending,” Berg T, Fuster A, Puri M. NBER Working Paper 29421, October 2021, and Annual Review of Financial Economics 14, November 2022, pp. 187–207.
“The Economics of ‘Buy Now, Pay Later’: A Merchant’s Perspective,” Berg T, Burg V, Keil J, Puri M. NBER Working Paper 33152, November 2024, and Journal of Financial Economics 171, September 2025, Article 104093.
“From Competitors to Partners: Banks’ Venture Investments in Fintech,” Puri M, Qian Y, Zheng X. NBER Working Paper 33297, December 2024.
“CBDCs, Payment Firms, and Geopolitics,” Berg T, Keil J, Martini F, Puri M. NBER Working Paper 32857, August 2024.


