The Effects of High-Skilled Immigration
High-skilled immigration remains at the forefront of the policy debate in the United States. While the economic consequences of high-skilled immigration are multifaceted and complex, there is significant suggestive evidence that immigrants play an important role in US innovation and firm creation. For example, immigrants comprised 23 percent of the total workforce in STEM occupations in 2016 and account for 26 percent of US-based Nobel Prize winners from 1990 through 2000.1 As of 2022, the four most valuable private, venture-backed US companies had immigrant founders, as well as three of the most valuable public companies globally.2 In fact, approximately one-quarter of new employer companies in the United States are started by immigrants.3,4 Motivated by these facts, in recent research we have sought to understand and quantify the role that immigrants play in US-based innovation and entrepreneurship. A particular focus of this agenda, which we detail below, has been to understand whether immigrants generate positive spillovers on their native counterparts and vice versa.
While skilled migrants may provide value to their destination countries, existing survey evidence suggests that return migration is a common phenomenon, with a significant fraction of international migrants returning to their origin (home) countries within five years.5 By participating in US economic activity, including the innovative and entrepreneurial activities described above, and by building up their professional networks, high-skilled immigrants may accumulate human capital they otherwise would not have. To the extent that migrants can transfer that acquired human capital to their origin countries through return migration, concerns surrounding brain drain may be mitigated. In a separate line of research, we have brought new data to bear in order to quantify the global migration and return migration flows of skilled workers across countries, understand the determinants of return migration, and study the accumulation of human capital by emerging-market skilled workers in advanced economies.
Immigrant Contributions to US Innovation
In joint work with Shai Bernstein, Rebecca Diamond, Abhisit Jiranaphawiboon, and Beatriz Pousada, McQuade characterizes the contributions of immigrants to US innovation as measured by patenting output.6 The analysis relies on the Infutor database, which provides the exact address histories of more than 300 million adults living in the US over the past 30 years. Beyond the exact address histories, the data also include the individuals’ names, years of birth, and the first five digits of their Social Security numbers. The data are linked to the universe of patents from 1990 to 2016 based on a merge of first and last names, as well as the city and state of residence as of the date of the patent. Immigrant status is then inferred by combining the first five digits of the Social Security number, which pins down the assignment year, with information on the year of birth.
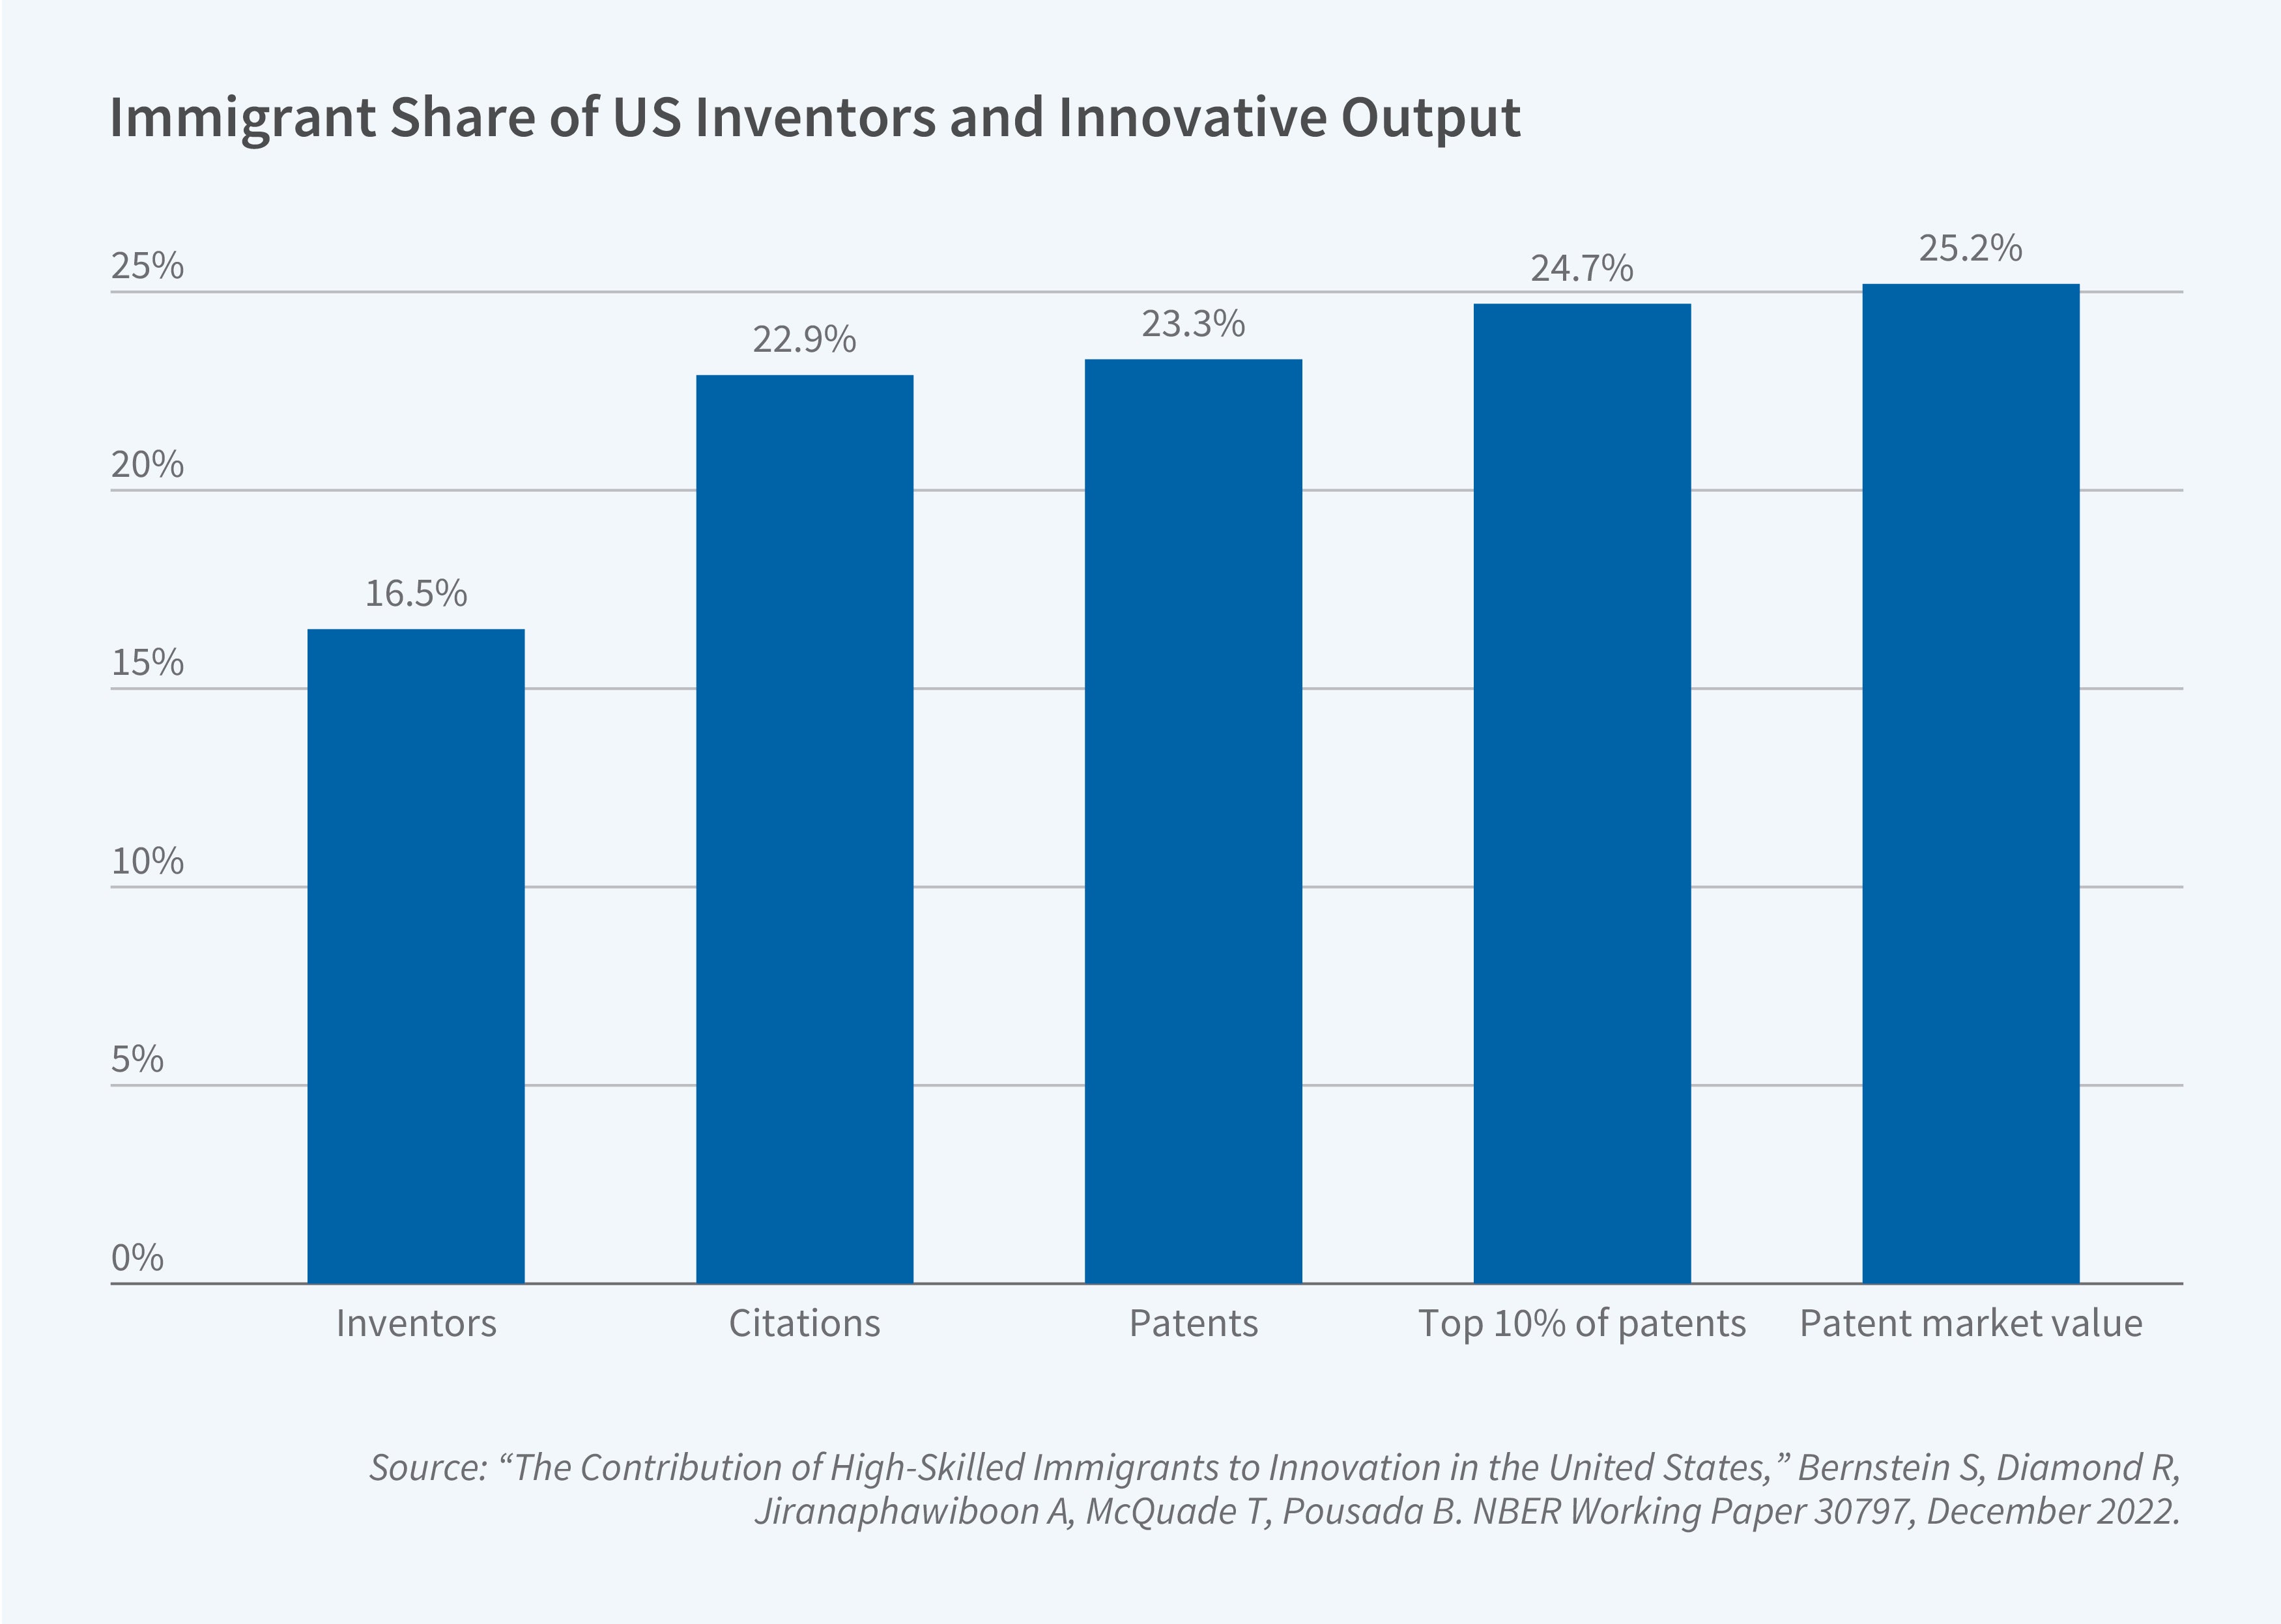
Between 1990 and 2016, immigrants who came to the United States when they were 20 years old or older made up 11 percent of the US population and 16 percent of all US-based inventors. As shown in Figure 1, immigrant inventors produced roughly 23 percent of all patents during this period, over 40 percent more relative to their share of the US-based inventor population and over 100 percent more relative to their share of the total US population. Immigrant patents do not appear to be of lower impact. Using the number of patents weighted by the number of forward citations, we find that the immigrant contribution is slightly higher at 24 percent. Using the stock market reaction measure of economic value developed by Leonid Kogan et al. and an imputation procedure for private firms, we find the immigrant contribution is 25 percent.7
Our paper further provides suggestive reduced-form evidence that immigrant inventors foster the importation of foreign ideas and technologies into the United States and facilitate the diffusion of global knowledge. During their careers, immigrant inventors rely more heavily on foreign technologies, as illustrated by their higher shares of backward foreign citations. Immigrants are twice as likely to collaborate with foreign inventors as with US-born inventors, and foreign inventors are about 10 percentage points more likely to cite the patents of US-based immigrant inventors than patents of US-born inventors.
Do immigrant inventors, through collaboration, make other US-based inventors more productive in their patenting? To construct causal estimates of productivity spillovers, we examine the premature deaths of inventor collaborators. The patenting behavior of inventors who had coauthored a patent with a deceased inventor is compared to the behavior of a matched control group of inventors who did not experience the premature death of a coauthor.
Premature death leads to a 10 percent decline in the innovative productivity of co-inventors, as measured by patents and top patents. This decline takes place gradually and has a long-lasting impact. Strikingly, the disruption caused by an immigrant inventor death leads to a significantly larger decline in the productivity of the co-inventors than that of a US-born inventor death. The death of an immigrant lowers co-inventor productivity by approximately 16 percent, while a US-born inventor’s death lowers productivity by approximately 9 percent. These gaps are large and persistent and take place across all measures of innovative productivity.
The analysis suggests that 32 percent of total US innovative output since 1990 can be ascribed to US-based immigrants, although they make up 16 percent of the inventor workforce and directly author 23 percent of patents. The additional 9 percentage points of innovation, over and beyond immigrants’ direct output, is due to immigrants’ substantial human capital externalities on US-born inventors. This decomposition highlights the importance of the two-way spillovers between immigrant inventors and US-born inventors, with one-quarter of US innovation attributable to this source.
Native-Immigrant Entrepreneurial Synergies
In recent work with Zhao Jin, we shift attention from immigrant inventors to immigrant entrepreneurs.8 Specifically, we focus on mixed entrepreneurial teams, that is, on firms that are created by both immigrant and US-born cofounders. Our research combines data from Revelio Labs and Crunchbase. The Crunchbase database provides comprehensive information on startups, including founding date, funding history, investors, acquisitions, and IPO status. The data are linked to Revelio Labs, which sources data from the LinkedIn profiles of more than 850 million individuals in over 200 countries. We identify immigrant entrepreneurs and workers in the United States using information on the initial country that appears in the LinkedIn profile, based on either education or job position.
As with innovation, immigrants play a significant role in US firm creation. Between 2000 and 2017, 33 percent of the startups in our sample had an immigrant founder. Moreover, collaboration between immigrants and US natives is common. Twenty-two percent of the startups in our sample had both immigrant and US-born cofounders. Immigrants provide an important source of labor for US startups. In our sample, about 30 percent of the average startup’s workforce consists of migrant employees.
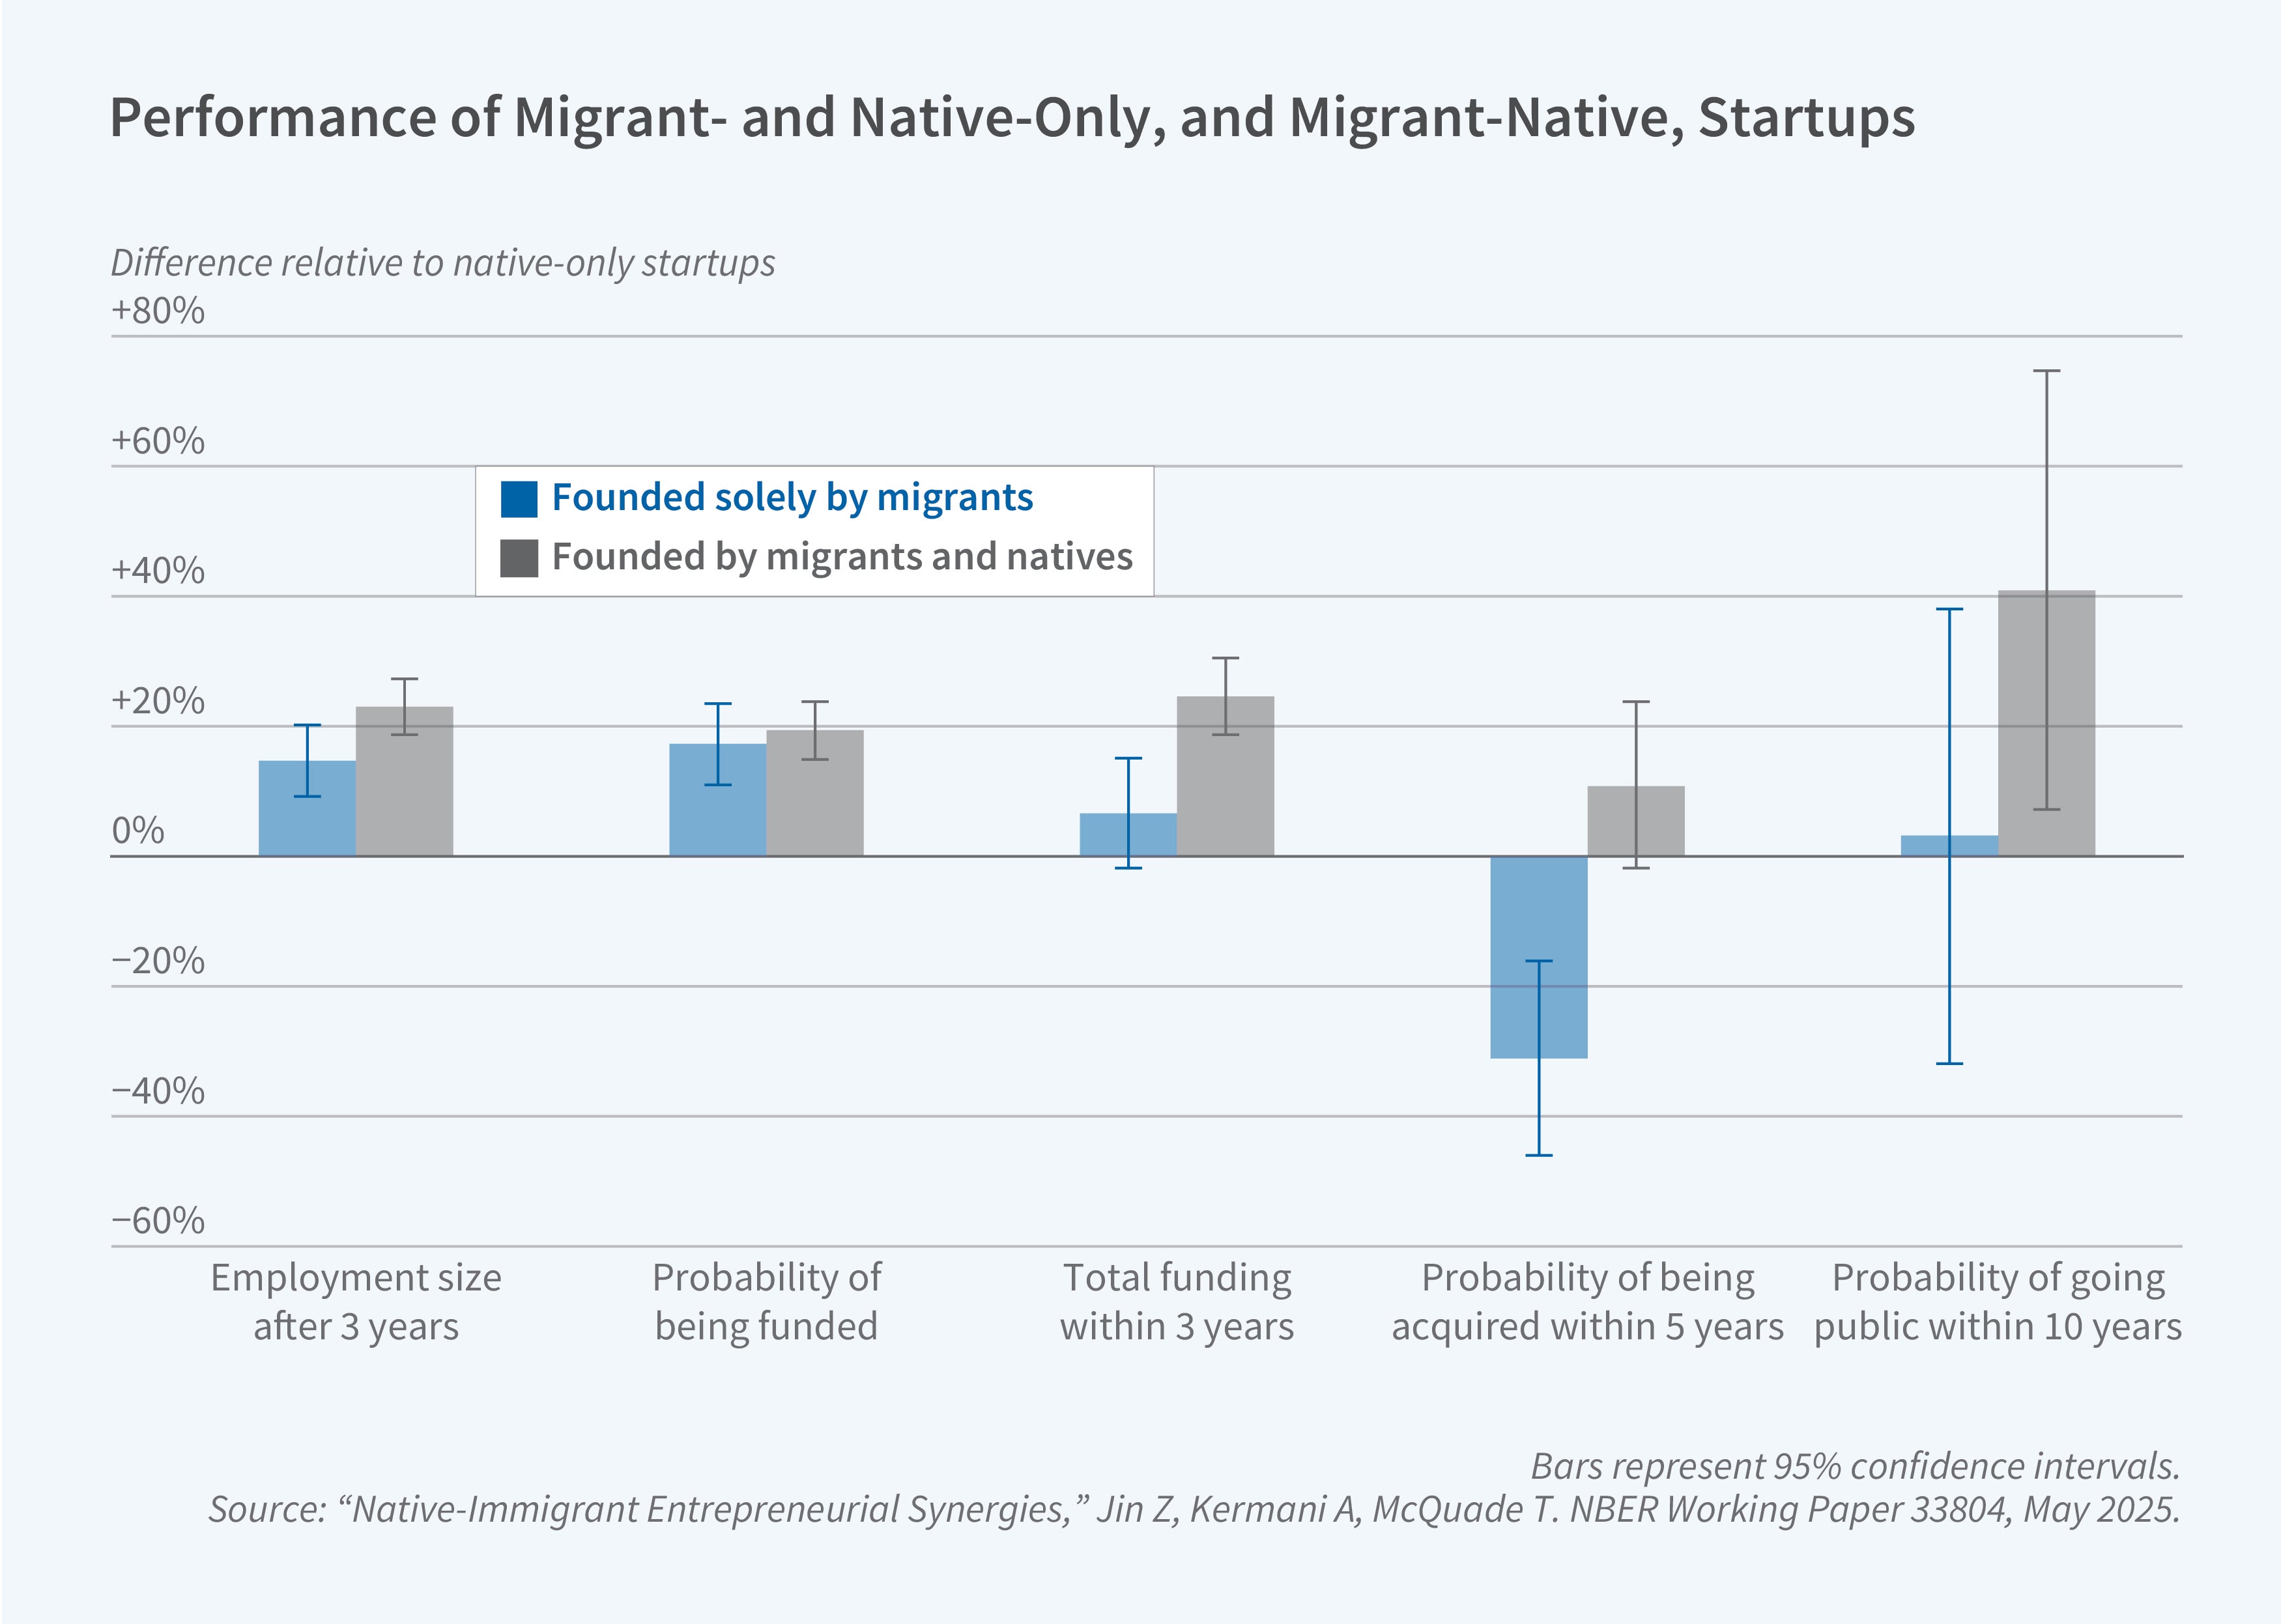
Startups founded by native-migrant teams outperform startups founded solely by natives or migrants. As shown in Figure 2, three years after inception, startups with native-migrant teams have 23 percent more employees than startups with native-only teams. While migrant-only startups outperform native-only startups, the effect is only 15 percent. Native-migrant startups are also significantly more likely to receive funding than native-only startups and raise substantially more capital than both native-only and migrant-only startups. Startups with native-migrant teams are also more likely to be acquired and more likely to exit through an IPO than either native-only or migrant-only startups.
What causes native-migrant startups to outperform native-only or migrant-only startups? We show that startups founded by immigrant-native teams hire more diverse, better-quality labor, have greater access to investor capital, and have access to wider product markets. Specifically, native-migrant startups hire 27.1 percent more migrant employees than native-only startups, while hiring slightly fewer migrant workers than migrant-only startups. Using internal and external promotions as a proxy for labor quality, we additionally find that native-migrant startups hire better quality workers than both native-only and migrant-only firms.
Similarly, startups founded by native-migrant teams are 7.7 percent more likely to be funded by non-US investors relative to startups without a migrant cofounder. Proxying for venture capital (VC) quality with the number of deals and the number of successful exits, we find that native-migrant teams disproportionately access capital from higher quality VCs relative to both native-only and migrant-only teams. We proxy for domestic and foreign product market access using patents filed both in and outside the United States and find that native-migrant firms have 117 percent more total granted patents than migrant-only firms and 28.4 percent more granted patents than native-only firms. Native-migrant teams are more likely to receive both US and non-US patents than both migrant-only and native-only startups.
The causal interpretation of our baseline empirical results is challenged by selection concerns. The greater performance of native-migrant startups could be driven by high-productivity entrepreneurs endogenously sorting into native-migrant teams, rather than productivity benefits created by the native-migrant combination itself. To address this concern, we develop an instrumental variables strategy exploiting plausibly exogenous variation in the year-over-year immigrant composition within the university-degree programs attended by startup founders. Intuitively, the proportion of native students in the degree program the native founder attends should impact the likelihood that an individual collaborates with migrants when forming a startup. Our first-stage regression results confirm this when controlling for year and university-by-degree fixed effects.
Our two-stage least squares (2SLS) estimates generally confirm the ordinary least squares analysis. Relative to native-only startups, native-migrant startups are 44 percent larger in terms of employment size three years following inception, are 35 percentage points more likely to receive funding within three years, and raise substantially more funding than native-only startups. A similar analysis within a sample of startups with at least one migrant cofounder confirms the superior performance of native-migrant startups over migrant-only startups.
Our 2SLS results also provide supporting evidence for the underlying mechanisms. Relative to native-only teams, native-migrant teams are more likely to hire migrant workers, hire higher-quality migrant workers, access foreign VC capital, and source capital from top VCs, as measured by the number of deals and the number of successful exits. Relative to migrant-only teams, native-migrant teams hire more native workers and higher-quality native workers, and are more likely to source capital from top domestic VCs and be granted a US patent.
Return Migration and Human Capital Accumulation
In addition to focusing on immigrants’ contributions to US-based innovation and entrepreneurship, we also study return migration and the potential benefits of migration for migrants’ countries of origin. In collaboration with Naser Amanzadeh, we use a uniquely rich dataset from Revelio Labs covering the employment histories of roughly 450 million individuals across 180 countries, supplemented with wage data from Revelio and Glassdoor.9 These records trace each worker’s education, jobs, location, and industry over time, enabling precise measurement of international moves, returns, and post-migration career trajectories.
Return migration is a common feature of the skilled labor market. Across all migrants, 10 percent return to their country of origin within a year, 33 percent within five years, and 38 percent within a decade. Rates vary widely; the US and advanced European economies see higher return rates, while large emerging markets such as India experience relatively low levels. Return behavior is closely tied to economic conditions—strong industry growth in the origin country raises the probability of return, while growth in the destination country reduces it—and is particularly sensitive to negative employment shocks at the migrant’s firm. A 20 percent drop in firm employment increases the likelihood of return by nearly 5 percent.
To assess the human capital consequences of these moves, we embed migration histories in a development-accounting framework that extends the Abowd–Kramarz–Margolis wage decomposition to allow for location-specific returns to experience. US experience commands striking premiums in origin countries, especially for workers from emerging markets. A year in the US raises subsequent wages in the home country by between 59 and 204 percent more than a year of domestic experience, depending on the specification we use, even after controlling for firm fixed effects. Experience in other advanced economies also carries a premium, but at lower levels.
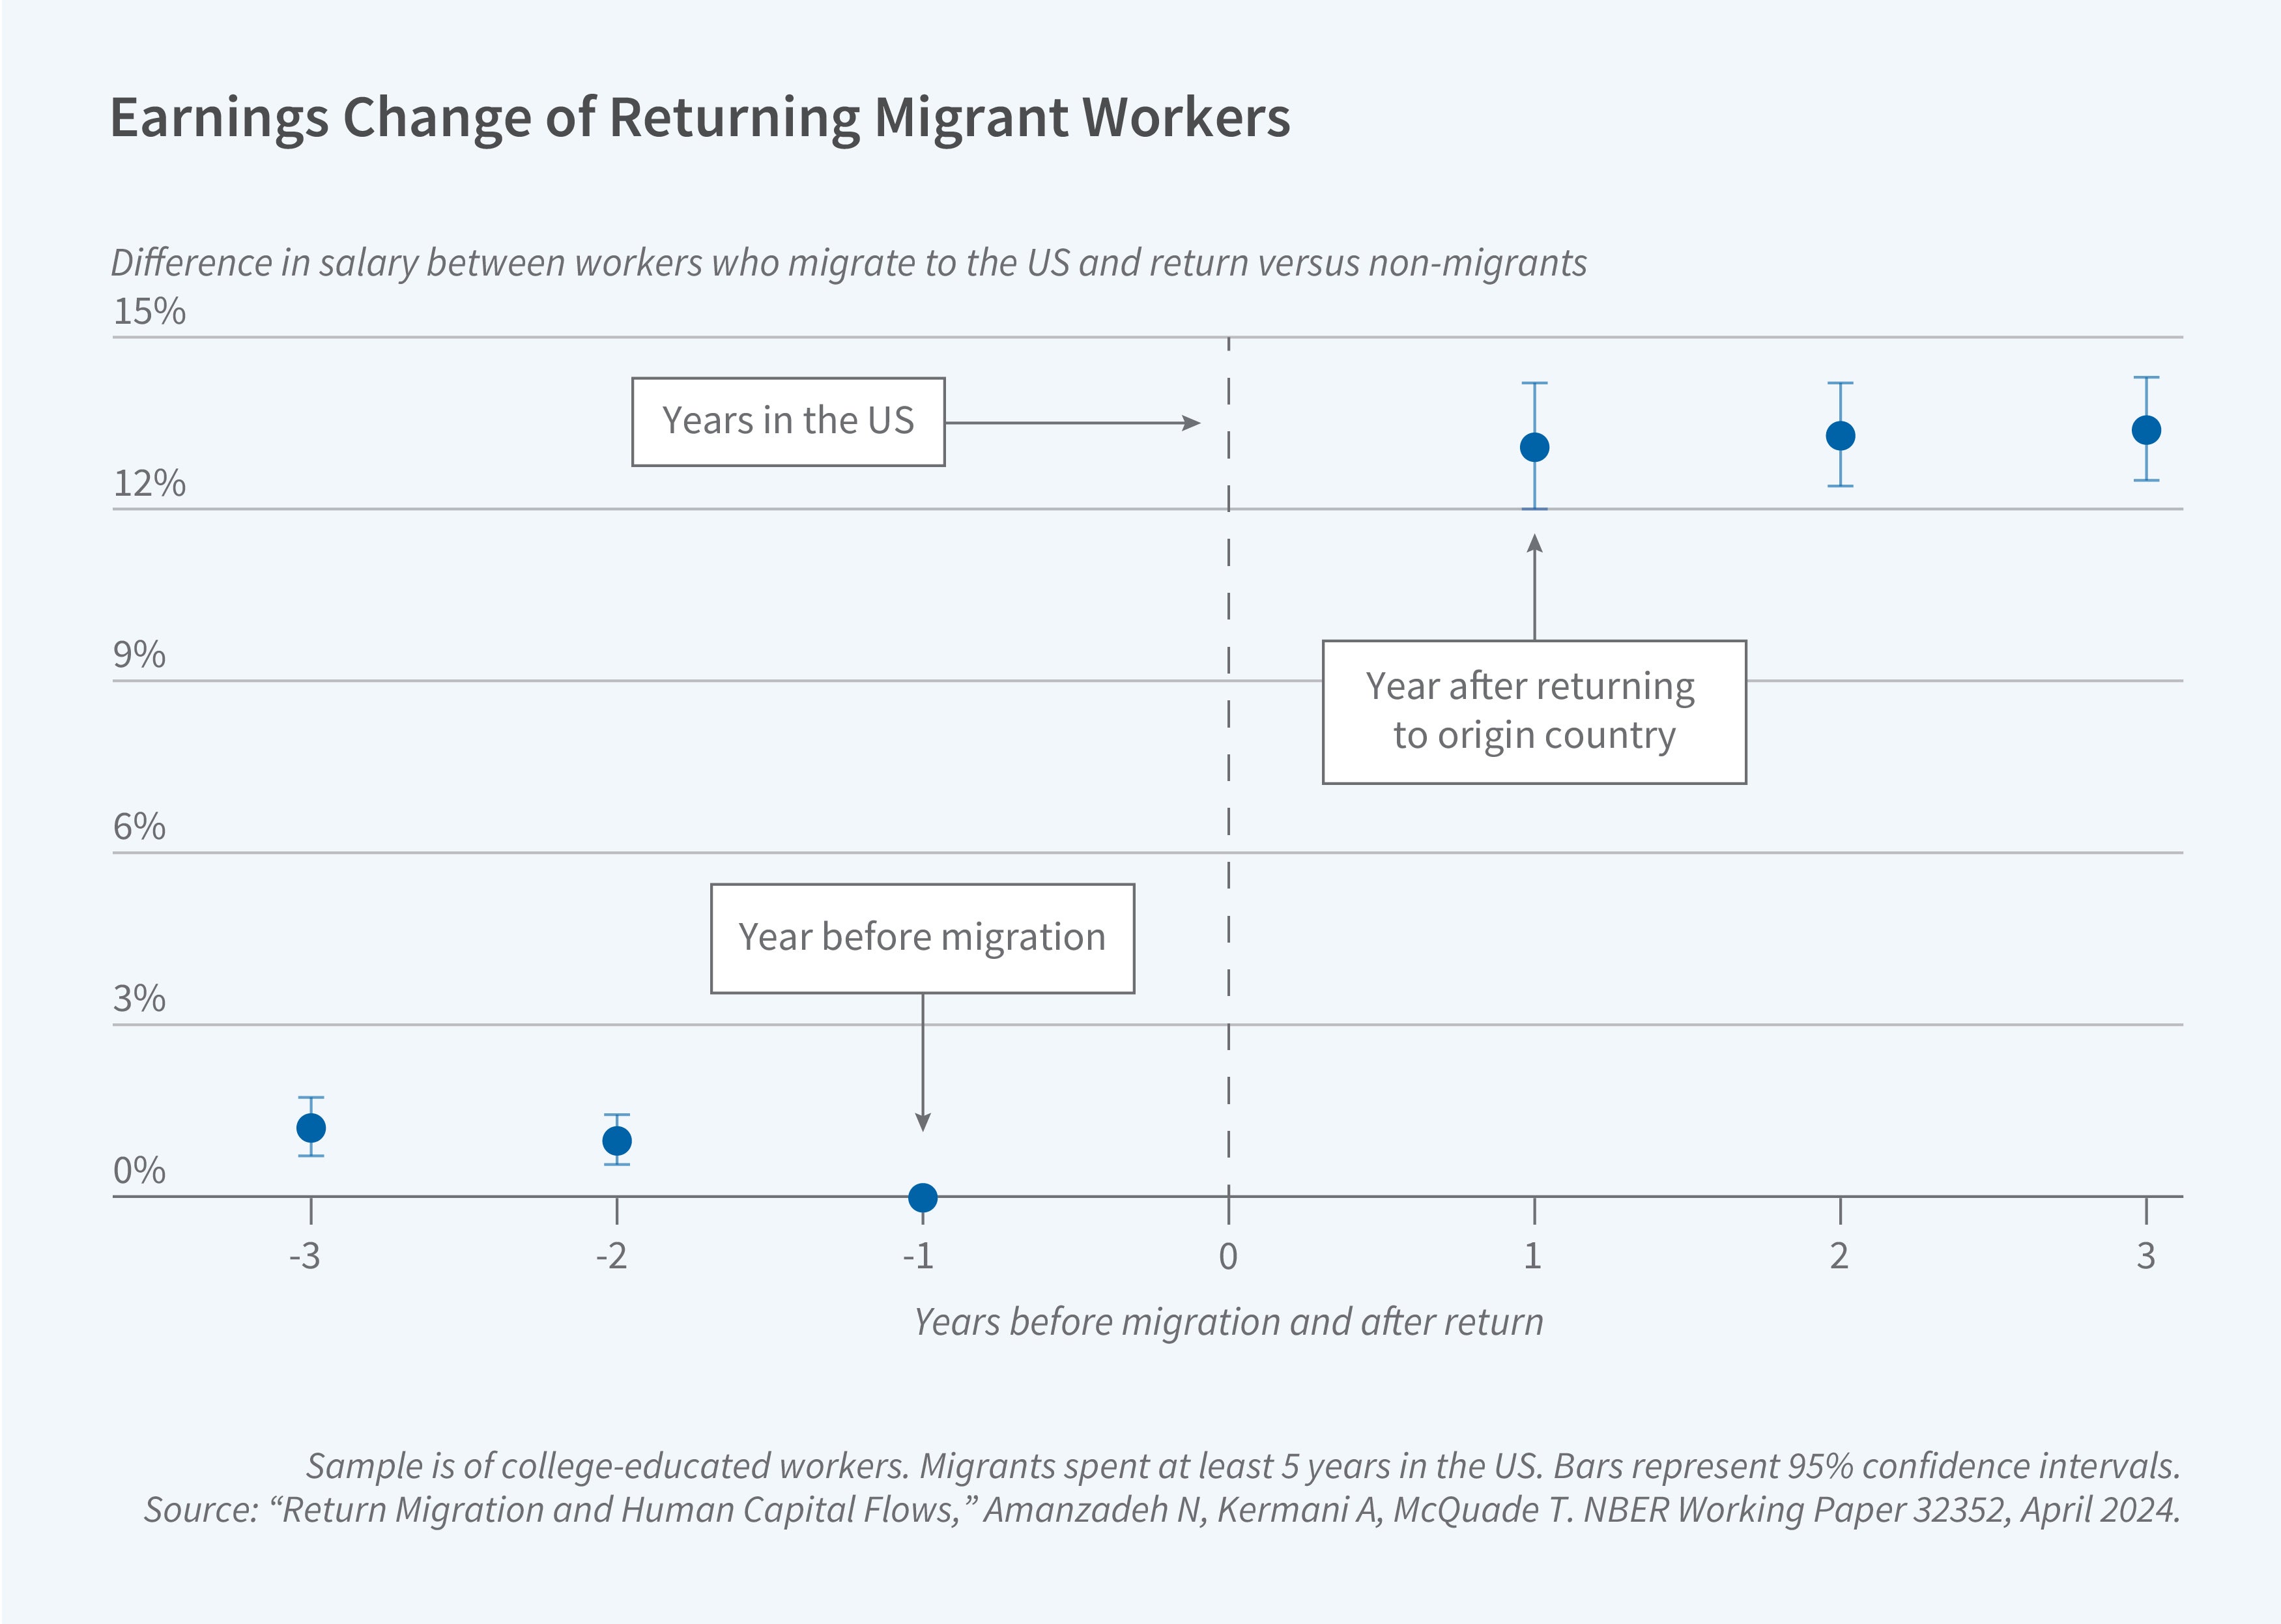
To address concerns that these differential returns might reflect differences in migrant and stayer characteristics rather than true causal effects, we employ an exact-matching design. Each return migrant is matched to a non-migrant from the same country, education cohort, and firm, and with the same position and pre-migration wage and experience profile. In these matched samples, returnees from the US to emerging markets earn about 8 percent more than their counterparts upon return, and those with at least five years in the United States earn about 13 percent more. These effects hold when restricting the sample to migrants whose return was triggered by large layoffs in their US firm, suggesting they are not driven by unobserved positive shocks to ability. Figure 3 illustrates these wage dynamics: Event-study estimates show a sharp post-return earnings divergence from matched peers, with no evidence of differential pre-trends. Gains are largest for long-tenured US returnees, consistent with the cumulative human-capital benefits of US experience.
We also study selection into migration and return. Migrants, especially those to the US, are positively selected on intrinsic human capital relative to non-migrants. Among US migrants, returnees have somewhat lower measured ability than those who remain abroad, though still above the average for non-migrants in their origin country. This suggests that return migration partly offsets, but does not fully reverse, the “brain drain” from developing economies. Counterfactual simulations reveal wide heterogeneity in the impact of skilled migration flows on national human capital stocks, with the largest losses in Gulf Cooperation Council countries that rely heavily on foreign talent and the largest gains in countries that currently lose many of their most skilled workers. The results underscore that migration and return migration are integral to the global circulation of skills and shape not only the innovative capacity of host economies like the US but also the development trajectories of migrants’ home countries.
Endnotes
Data are from the 2016 American Community Survey. STEM occupations are defined as engineers, mathematical and computer scientists, natural scientists, and physicians.
“Immigrant Entrepreneurship: New Estimates and a Research Agenda,” Chodavadia SA, Kerr SP, Kerr WR, Maiden LJ. NBER Working Paper 32400, May 2024.
“Immigrant Entrepreneurship,” Kerr SP, Kerr WR. In Measuring Entrepreneurial Businesses: Current Knowledge and Challenges, Haltiwanger J, Hurst E, Miranda J, Schoar A, editors, pp. 187–249. Chicago: University of Chicago Press, 2016.
“Immigration and Entrepreneurship in the United States,” Azoulay P, Jones B, Kim JD, Miranda J. NBER Working Paper 27778, September 2020, and American Economic Review: Insights 4(1), March 2022, pp. 71–88.
“Return Migration Around the World: An Integrated Agenda for Future Research,” Hagan JM, Wassink JT. Annual Review of Sociology 46, August 2020, pp. 533–552.
“The Contribution of High-Skilled Immigrants to Innovation in the United States,” Bernstein S, Diamond R, Jiranaphawiboon A, McQuade T, Pousada B. NBER Working Paper 30797, August 2025.
“Technological Innovation, Resource Allocation, and Growth,” Kogan L, Papanikolaou D, Seru A, Stoffman N. The Quarterly Journal of Economics 132(2), May 2017, pp. 665–712.
“Native-Immigrant Entrepreneurial Synergies,” Jin Z, Kermani A, McQuade T. NBER Working Paper 33804, May 2025.
“Return Migration and Human Capital Flows,” Amanzadeh N, Kermani A, McQuade T. NBER Working Paper 32352, April 2024.


