Generic Drugs: A Healthcare Market Trial
Can healthcare markets deliver access, affordability, and quality? While markets for hospital and physician services both have unique challenges, generic drug pricing is often seen as a success story for market forces. After patent-related exclusivity ends, prices fall dramatically. Consumers have access to a range of highly clinically valuable products at low prices. Is this success unique or can it be replicated in other parts of the healthcare sector?
As in other healthcare markets, insurers play a crucial role in determining both prices and utilization of prescription drugs. Patients purchase pharmaceuticals from a pharmacy, either in a physical location or by mail. Like many retailers of consumer goods, pharmaceutical retailers purchase products from wholesalers and manufacturers. A unique feature in the financing of drug purchases is that insurers negotiate reimbursements with pharmacies and set consumer out-of-pocket costs. Negotiated reimbursements tend to be composed of an ingredient cost, aimed at covering the wholesale cost of the product, as well as a dispensing cost, to allow pharmacies to earn a positive margin on their sales.
My research agenda is at the intersection of industrial organization and health economics. I use healthcare markets to understand general economic phenomena, including the role of information and market concentration in shaping equilibrium outcomes. I also use economic concepts to evaluate the performance of healthcare markets and the potential benefits of government intervention. In this article, I describe a series of papers that highlight the value and shortcomings of healthcare markets, using generic drugs as an example.
When negotiating reimbursement, it is critical that insurers be able to say “no” to expensive suppliers. In the context of drugs, this could mean not covering expensive branded drugs when generics are available. It could also mean steering consumers to lower-cost pharmacies. In healthcare markets more generally, saying “no” is critical for reducing spending.
David Dranove, Christopher Ody, and I compare the performance of public, state-administered pharmaceutical programs with that of programs administered by private insurers.1 Some states give private insurers the flexibility to deny coverage of certain pharmacies and drugs. In those states, transitioning to private insurers lowers drug spending dramatically.
Lower prices per prescription — not a reduction in prescriptions — drive the savings. Figure 1 illustrates this effect. It plots lag and lead coefficients relative to privatization to illustrate the extent of privatization over time and the resulting effect on the average point-of-sale price per prescription. This price variable is stable before privatization and falls immediately following privatization; our estimates suggest that full privatization of drug benefits would reduce the price per prescription by a staggering 28 percent. Further analysis shows that private insurers’ ability to negotiate lower point-of-sale prices with pharmacies for identical drugs accounts for one-third of the overall savings. The remaining two-thirds is driven by the greater use of lower-cost drugs, such as generics.
![This figure is a line graph titled, Private Insurer’s Prescription Drug Costs. The y-axis is labeled, change in price per prescription. It ranges from negative 40 percent to positive 10 percent, increasing in increments of 10. The x-axis is labeled, Quarter before states transition from public, state-administered programs to private insurers. It ranges from negative 9 to positive 9, increasing in increments of 1. There is a vertical dotted line at negative 1 that is labeled, quarter before states transitions from public state administered programs to private insurers. As negative 9, the line starts off at around negative 7 percent where it increases to just above zero by negative 1 quarters. To the right of the dotted line at negative 1 quarters, the line begins to steadily decline, dropping to around negative 25 percent at 7 quarters before leveling off. The note on the figure reads, shaded area represents 95 percent confidence intervals. The source on the figure reads, Source: Amanda Starc, David Dranove, and Christopher Ody. “A Dose of Manged Care: Controlling Drug Spending in Medicaid,” NBER Working Paper 23956 and the American Economic Journal: Applied Economics 13(1), January 2021, pp. 170–197. [Copyright American Economic Association; reproduced with permission of the American Economic Journal: Applied Economics]](/sites/default/files/inline-images/Starc_Figure1_Final-01.jpg)
Ashley Swanson and I further measure the costs and benefits of saying “no” to high-price pharmacies in the Medicare Part D program.2 In our setting, insurers negotiate aggressively with pharmacies. Plans form restrictive “preferred pharmacy networks” in which consumers face lower out-of-pocket costs at “preferred” pharmacies. Selective contracting can screen out unprofitable enrollees, steer enrollees to low-cost suppliers, or give insurers negotiating leverage. To understand strategic incentives and develop evidence-based policy, we must measure trade-offs between cost and access empirically. This is not just an important setting, as prescription drug costs are rising, but also an ideal setting for analysis, because we can control for detailed national drug codes, leaving pharmacies as the only important differentiator. While only 13 percent of sample plans used preferred pharmacy networks in 2011, 70 percent did in 2014.
We expect restrictive preferred pharmacy networks to achieve lower drug prices. However, the effect is mitigated by price-insensitive enrollees, as the reduced ability to steer such enrollees limits any potential increase in steering or bargaining leverage. Figure 2 shows that broad network plans with a high percentage of pharmacies in the preferred network have higher point-of-sale prices than narrower network plans. The effect is largest for plans without “low-income subsidy” enrollees, who face limited cost sharing. A 1 standard deviation increase in the percentage of pharmacies preferred is associated with a 4.2 cent price increase per day supplied if nearly all a plan’s enrollees face cost-sharing differences. By contrast, if very few enrollees face cost-sharing differences (the top quartile), there is no relationship between preferred pharmacy network breadth and point-of-sale prices. Overall, the estimates indicate that preferred-network plans pay between 4.2 and 5.1 cents less per day supplied, a difference of between 1.9 and 2.3 percent, for drugs at the point of sale. We model demand to quantify the welfare impact of reduced access and find that the average enrollee benefits from preferred pharmacy contracting due to reduced out-of-pocket costs at preferred pharmacies.
![This is figure is a scatter plot titled, Preferred Pharmacy Networks and Drug Plan Costs. The y-axis is labeled, Impact of a percentage point increase in “percent preferred” on prices in percentage terms. It ranges from negative 0.05 to positive 0.20, increasing in increments of 0.05. The x-axis is labeled, quartile of low-income subsidy in 2011 and ranges from 1 to 4. The point at 1 is labeled, nearly all enrollees face cost sharing differences, and the point at 4 is labeled, very few enrollees face cost sharing differences. At 1, the value is at about 0.15. At 2, it is about 0.12. About 0.05 at 3 and then 0 at 4. The note on the figure reads, bars represents 95 percent confidence intervals. The source line reads: Source: Amanda Starc and Ashley Swanson. “Preferred Pharmacy Networks and Drug Costs,” NBER Working Paper 24862 and the American Economic Journal: Economic Policy 13(3), August 2021, pp. 406–446. [Copyright American Economic Association; reproduced with permission]](/sites/default/files/inline-images/Starc_Figure2_Final_v3_Jim%20%281%29-01.jpg)
In many ways, the empirical findings summarized above describe the value of market institutions.
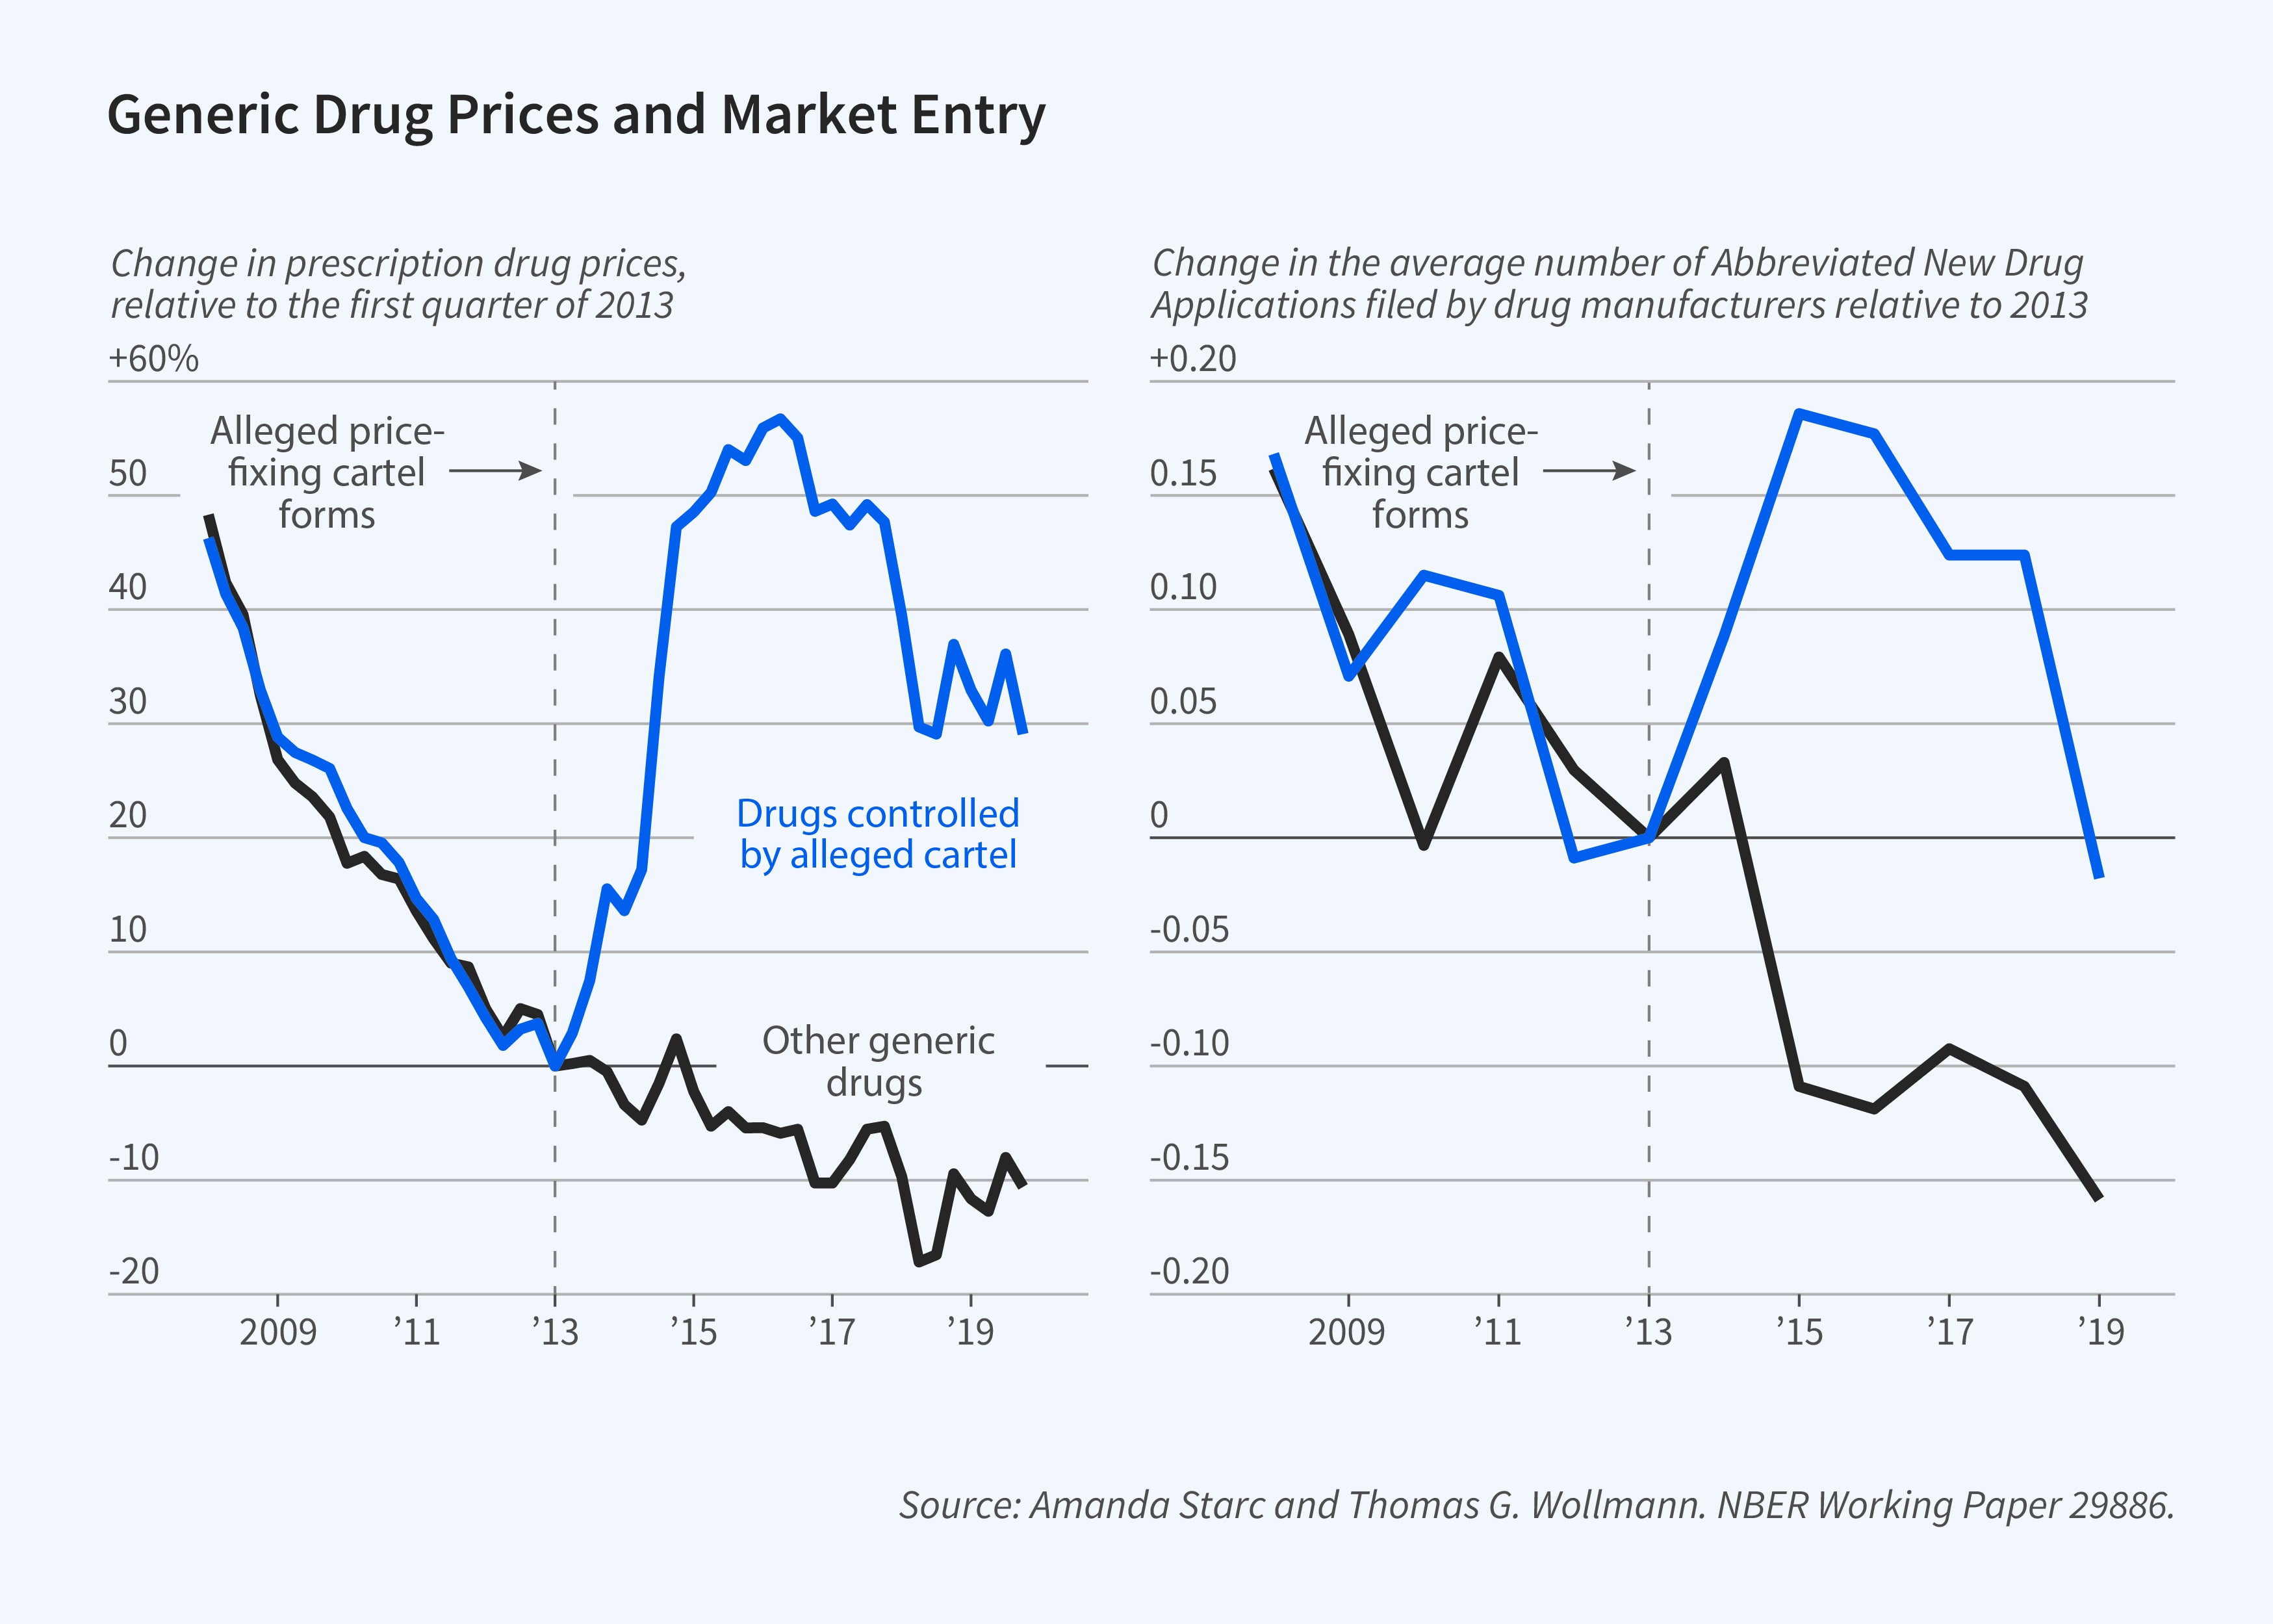
Despite this, prices of many generic drugs have risen substantially in the past decade. While many factors are responsible, collusion has contributed to large price hikes in a subset of markets. Anticompetitive behavior is a threat to market efficiency in all industries. Nowhere is this more true than in healthcare, and generic drugs in particular provide an instructive example. For several years beginning in 2013, generic manufacturers are alleged to have fixed, and thereby raised, prices of many drugs.
Thomas G. Wollmann and I explore strategic responses to cartel formation.3 We first document the impact of alleged price-fixing on prices, comparing generic drug prices for drugs that were allegedly part of the price-fixing scheme to prices for drugs that were not. The prices for both groups of drugs followed similar downward trends over the 2008–13 period, but their paths diverged after 2013. Prices that were allegedly controlled by the price-fixing cartel rose by 50 percent.
This episode raises the question of whether market forces can protect consumers. There are two potential market checks on harms from collusion: cheating and entry. In practice, the latter is quite important. Entry rose in response to price increases. The filing of abbreviated new drug applications (ANDAs) increased in cartelized markets. These filings indicate an intent to enter. Yet while ANDAs increase almost immediately following cartelization, regulatory review delays entry, often by years. Two key questions are whether entrants can earn profits that exceed the sunk cost of entry, and whether they can exert downward pressure on prices in the meantime.
To explore these issues, we model price and entry. We find that pricing is consistent with collusion even after a price-fixing investigation is opened. We also find that the cartel is stable, and cartel members are unlikely to deviate. Yet entry can also be profitable for nonmembers. These nonmembers undercut the cartel and prices fall, albeit not to competitive levels. We estimate that cartel profits would have been 35 percent higher absent entry.
In addition to antitrust enforcement, there is an important policy role for the FDA in our setting.
The cost of the research that is required to enter a drug market averages about $3.2 million. This figure reflects both the costs of proving the generic is identical to the branded molecule and various government fees. Even more important, the approval process can take up to four years. Both lower entry costs and speedier approvals can reduce drug prices: a one-year reduction in time to approval would have led to average savings of $596 million. Reducing regulatory delays generates a substantial increase in consumer welfare.
The historical success of generic drugs in reducing healthcare costs is a result of market forces. Yet whether markets can deliver more broadly on the promise of affordability and access is unclear. My research suggests two broad lessons. First, insurers play a crucial role beyond providing risk protection. When serving as an appropriate counterpoint to providers, they can steer consumers in ways that lower healthcare costs. Second, when public policy entrenches incumbents in uncompetitive markets by preventing substitution or creating barriers to entry, higher prices are a likely result. These insights are likely to apply to healthcare markets other than pharmaceuticals.
Endnotes
“A Dose of Managed Care: Controlling Drug Spending in Medicaid,” Dranove D, Ody C, Starc A. NBER Working Paper 23956, October 2017, and American Economic Journal: Applied Economics 13(1), January 2021, pp. 170–197.
“Preferred Pharmacy Networks and Drug Costs,” Starc A, Swanson A. NBER Working Paper 24862, July 2018, and American Economic Journal: Economic Policy 13(3), August 2021, pp. 406–446.
“Does Entry Remedy Collusion? Evidence from the Generic Prescription Drug Cartel,” Starc A, Wollmann TG. NBER Working Paper 29886, April 2023.


