How Do Corporate Taxes Affect Economic Activity?
This article surveys our recent work on the economic effects of corporate taxes, first discussing research on the effects of state corporate tax cuts and then considering how federal tax policies that encourage investment impact workers. It concludes by outlining new avenues for research on related issues.
State Corporate Taxes and Local Economic Activity
Local and state policymakers compete to attract companies to their jurisdictions. Proponents of using business tax cuts as incentives for firm location argue that increases in job creation justify losses in revenue, while detractors argue that incentives have little economic impact and mostly benefit firm owners. Our research provides new empirical evidence of the effects of corporate taxes on local economic outcomes and develops a new framework to quantify the incidence of business tax cuts and the distribution of the benefit of such cuts among firm owners, land owners, and workers.1
Corporate taxes in an open economy are conventionally thought to reduce both efficiency and equity: they distort the location and scale of economic activity and ultimately fall on workers via lower wages. Previous models of corporate taxation and spatial equilibrium have limitations for addressing this issue. Models of corporate taxation usually assume that firms earn zero profits, which implies that firm owners cannot benefit from business tax cuts. On the other hand, models of spatial equilibrium assume a single firm in each location, which obviates a meaningful role for firm location incentives. We develop a spatial equilibrium model with imperfectly mobile firms and workers. Firm owners may earn profits and may be inframarginal in their location choices due to differences in location-specific productivities. This modeling innovation allows the analysis of the effects of tax incentives to attract firms to be informed by data.
We find that tax cuts are associated with an increase in the number of local firms. Moreover, as firms locate in areas with lower taxes, there is an increase in employment, wages, and rents. We use the evidence on these responses to tax changes to estimate who benefits from tax cuts. We find that firm owners bear a substantial portion of incidence. This implies that while business tax cuts may grow the local economy, most of the benefits of the tax cut accrue to relatively wealthy firm owners.2 In contrast, the burden of higher sales taxes, which are often used to counterbalance the reduction in revenue from business tax cuts, falls disproportionately on lower-income workers.
Our most recent work presents new theoretical and empirical results.3 First, we enhance the empirical analysis of the effects of state business taxes using new data from the US Census Bureau’s Longitudinal Business Database and Annual Survey of Manufactures. We provide new evidence that business tax cuts increase the local labor demand of incumbent firms and lead to the entry of relatively less productive firms. Second, we show that these new reduced-form effects identify the benefits to firm owners from state corporate tax cuts. We update our modeling approach to estimate profit effects and to account for the effects of taxes on the composition of firms and the cost of capital, thereby allowing for more flexible responses of the local cost of capital to changes in business taxes.4 Finally, we show how to derive income shares for each of the agents of the model and compute income-share-weighted incidence estimates. Our central finding is that firm owners receive roughly half of the benefit of a corporate tax cut, while workers and landowners receive 35–40 percent and 10–15 percent, respectively.
While states compete for businesses by lowering tax rates, they also attract them by providing tax credits and generous deductions. We reassess the state corporate tax structure — tax rates and tax base rules — and document how it has changed over time.5 The average state-level corporate tax rate has remained relatively stable over the last three decades, while the ratio of corporate tax revenue to state GDP has generally decreased. Changes in tax base rules, such as loss carry forward provisions and investment tax credits, explain more of the variation in the ratio of state corporate tax revenue to GDP than do changes in state corporate tax rates. These rules account for 60 to 90 percent of the explained variation in corporate tax revenues, and the trend toward narrower state corporate tax bases helps explain the reduction in corporate tax revenues as a share of GDP. This shows that relatively obscure changes in tax policy may be more important for state finances than well-debated changes in state tax rates. Overall, we find that changes in the structure of the corporate tax system have been favorable for corporations and have reduced the extent to which tax rate increases raise corporate tax revenue.
In addition to tax rates and tax base rules, business tax incentives are also relied upon by states to attract and retain companies. Cailin Slattery and Zidar characterize these firm incentive policies, describe the selection process that determines which places and firms give and receive incentives, and evaluate their economic consequences.6 In 2014, states spent between $5 and $216 per capita on incentives for firms in the form of firm-specific subsidies and general tax credits. These mostly targeted investment, job creation, and research and development (R&D). Collectively, these incentives amounted to nearly 40 percent of state corporate tax revenues on average, but in some states incentive spending exceeded corporate tax revenues. States with higher per capita incentives tended to have higher state corporate tax rates. Recipients of firm-specific incentives were usually large establishments in manufacturing, technology, and high-skilled service industries. The average discretionary subsidy cost $160 million in return for 1,500 promised jobs. Firms tend to accept subsidy deals from places that are richer, larger, and more urban than the average county, while poor places provide larger incentives and spend more per job. While the study yields some evidence of direct employment gains from attracting a firm, it does not find strong evidence that firm-specific tax incentives increased broader economic growth at the state and local levels. Although incentives are often intended to attract and retain high-spillover firms, the evidence on spillovers and productivity effects of incentives is mixed.
Ethan Rouen, Suresh Nallareddy, and Suárez Serrato use regression and matching techniques to study the effects of corporate tax cuts on income inequality.7 They find that state corporate tax cuts lead to increases in the share of income accruing to the top 1 percent of tax filers. Specifically, a 1 percentage point (pp) state corporate tax cut increases the share of income to the top 1 percent of the income distribution by 1.5 pp. Since the share of income accruing to the top 1 percent increased by 6.1 pp between 1990 and 2010, this implies that the average tax rate cut of 0.5 pp was responsible for 12.4 percent of this overall increase in the top income share. This result corroborates the findings that landowners and business owners gain the most from business tax cuts.
Analyzing the regional effects of changes in spending and taxes allows us to use policy changes as plausibly exogenous natural experiments to measure the effects of fiscal policy on economic activity. A drawback of this approach is that reduced-form regional analyses are not able to measure the aggregate consequences of policy changes. In work with Pablo Fajgelbaum and Eduardo Morales, we quantify the nationwide effects of fundamental tax reform across states by combining the insights from our work on corporate taxation in spatial equilibrium models with a quantitative model of trade between states.8
One insight is that when firms choose a location, they trade off higher productivity, which is partly location specific, with lower taxes and production costs. Thus, a location that lowers its taxes attracts more firms that were, on the margin, more productive elsewhere. While the local increase in jobs may benefit the local population, the aggregate consequences may be negative on net, as overall productivity and employment may decrease. We explore this issue by studying whether the wide variation in taxes across states generates spatial misallocation in the United States. We build a spatial general-equilibrium framework that incorporates salient features of the US state tax system. It allows us to compute national-level effects of reforms that limit cross-state competition in business taxation, as well as to simulate the effects of specific aspects of the Tax Cuts and Jobs Act of 2017 (TCJA).
Our model includes the amenity value of public services. This allows us to compute the effects of tax reform on worker welfare, accounting for the fact that some states may be underproviding public goods due to cross-state tax competition. We use changes in state tax rates between 1980 and 2010 to estimate the model parameters that determine how worker and firm-location decisions respond to changes in state taxes and government spending.
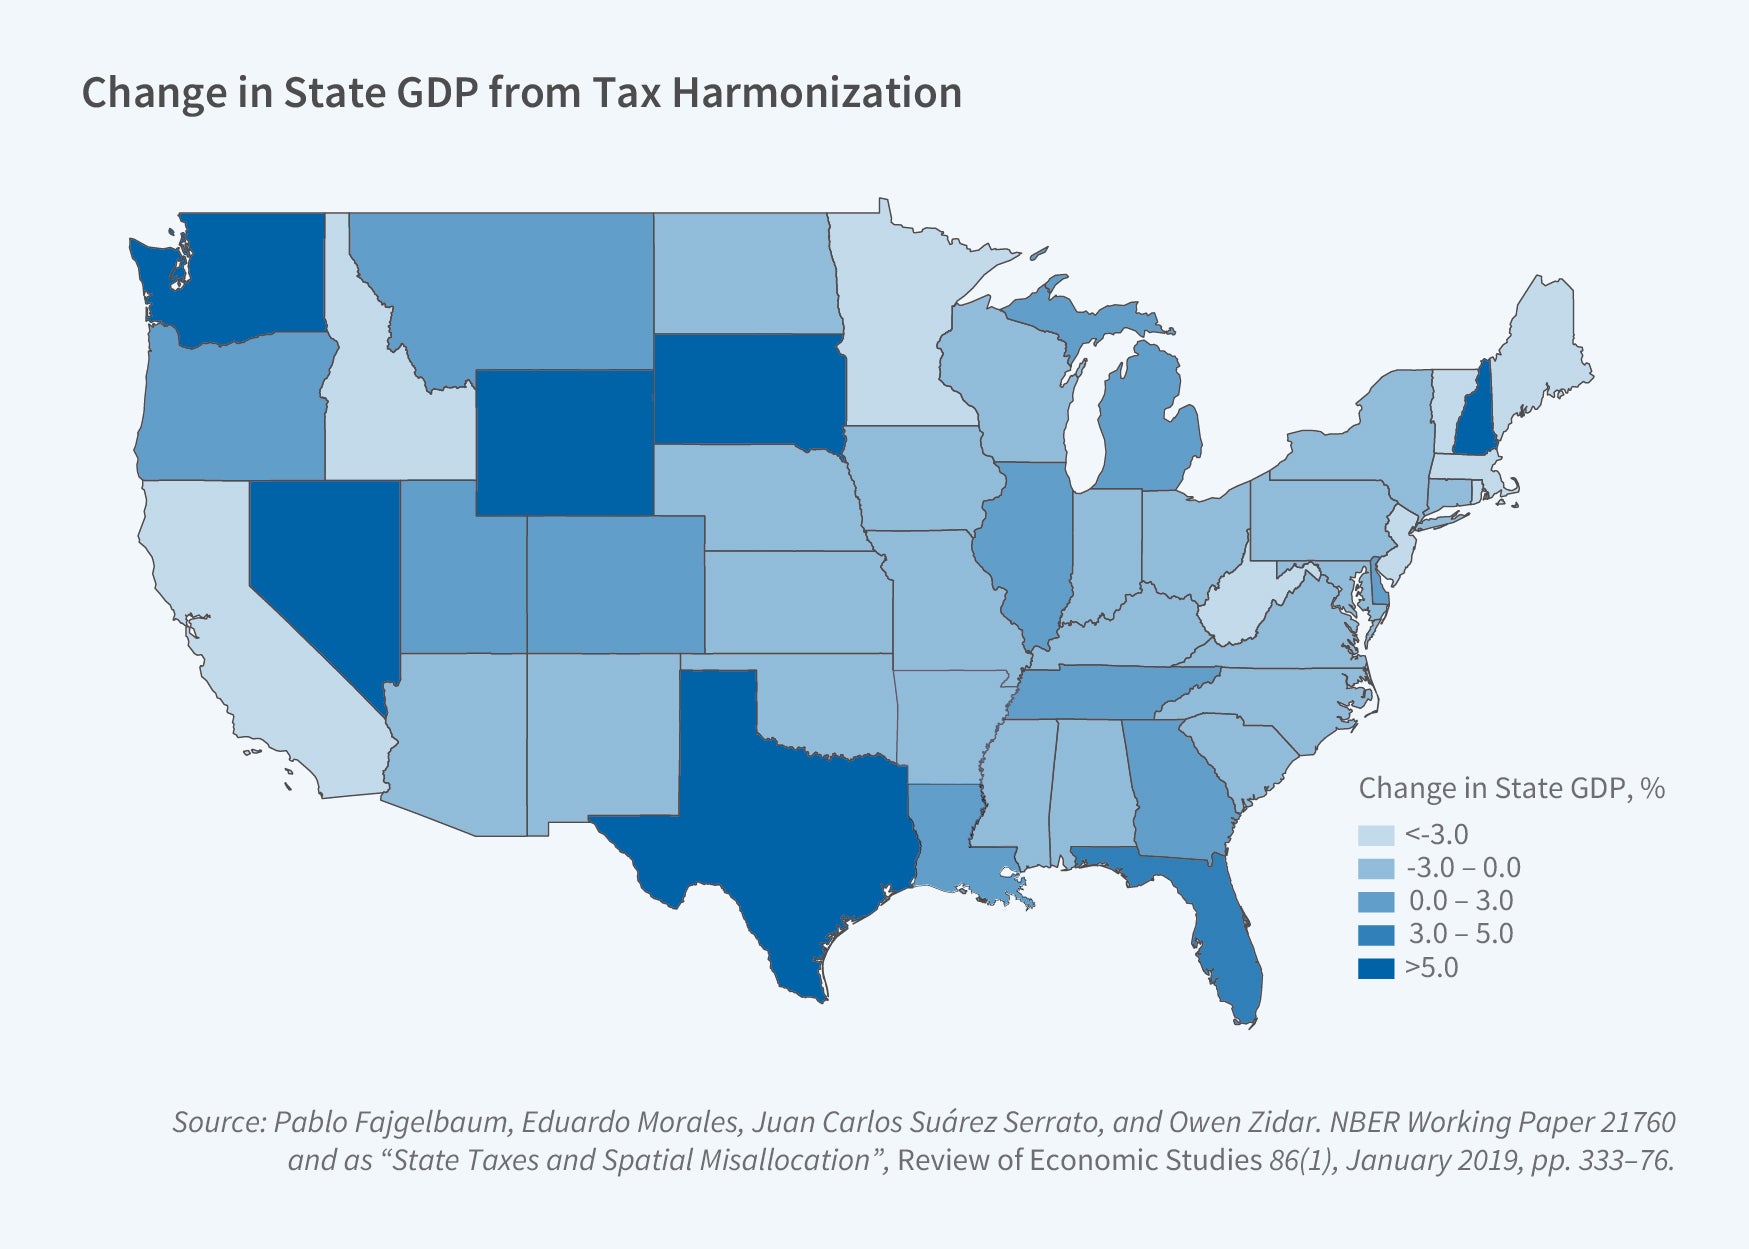
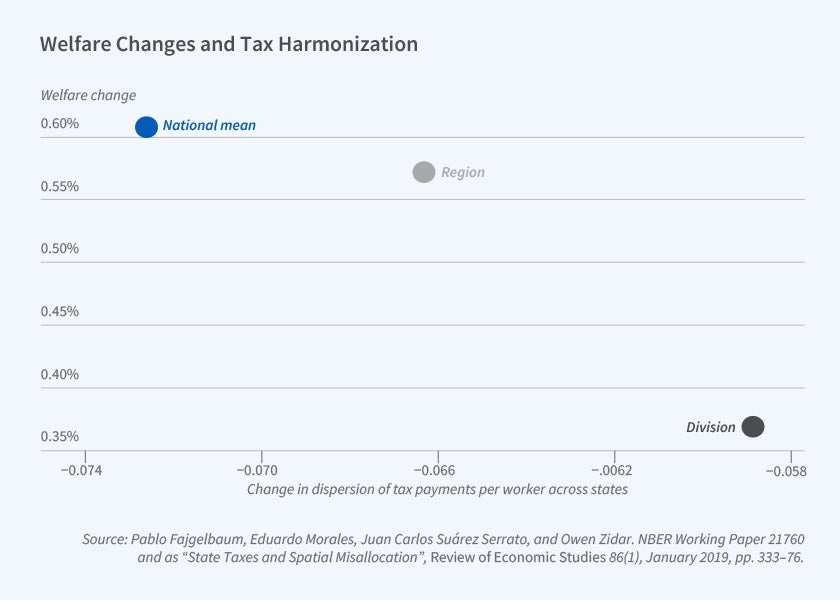
We find that state differences in tax rates generate spatial misallocation, which leads to aggregate losses in GDP and welfare. Specifically, worker welfare increases by 0.6 percent when we simulate the effects of harmonizing taxes across states while holding spending constant. The gains to workers are twice as large when government spending responds endogenously to the changes in taxes. Panel A in Figure 1 shows how the gains in GDP are distributed across states. While there is considerable variation in effects, states that experience large increases in government spending, such as Texas, Florida, Nevada, and New Hampshire, experience the largest gains from harmonization. Panel B shows that most of the gains from tax harmonization can be achieved by harmonizing state taxes within census regions.
In addition to studying the effects of tax harmonization, we simulate the effects of the limit on the state and local tax (SALT) deduction that was enacted as part of the TCJA. Prior to the TCJA, taxes paid to state and local governments were deductible from federal income taxes. This policy effectively subsidized taxes in states with higher tax rates, but it also reduced the dispersion in net tax rates across states. We find that removing the SALT deduction nearly doubles the standard deviation in average effective personal income tax rates across states. This increase in tax dispersion lowers welfare by 0.75 percent.
Corporate Investment Incentives and the Labor Market
Policymakers in the US and elsewhere often use tax incentives to stimulate the economy. While many of these incentives target corporate investment, policymakers often advocate for them by arguing that the additional investment will create jobs and raise wages for workers. In contrast, detractors of these policies argue that by lowering the cost of labor-saving machines, tax incentives for investment may accelerate the pace of automation. We have studied whether incentives for capital investment stimulate the labor force, lead to productivity growth, or lead to the substitution of workers with machines. To identify the effects of changes in capital investment, we analyze the effects of a policy called bonus depreciation, which lowers the tax cost of investment by allowing companies to claim an additional tax deduction in the year that equipment investments are made. Bonus depreciation policies, which have been in place in the US for most years since 2001, were significantly expanded as part of the TCJA, and have been adopted by other countries, including China, Germany, and the United Kingdom.
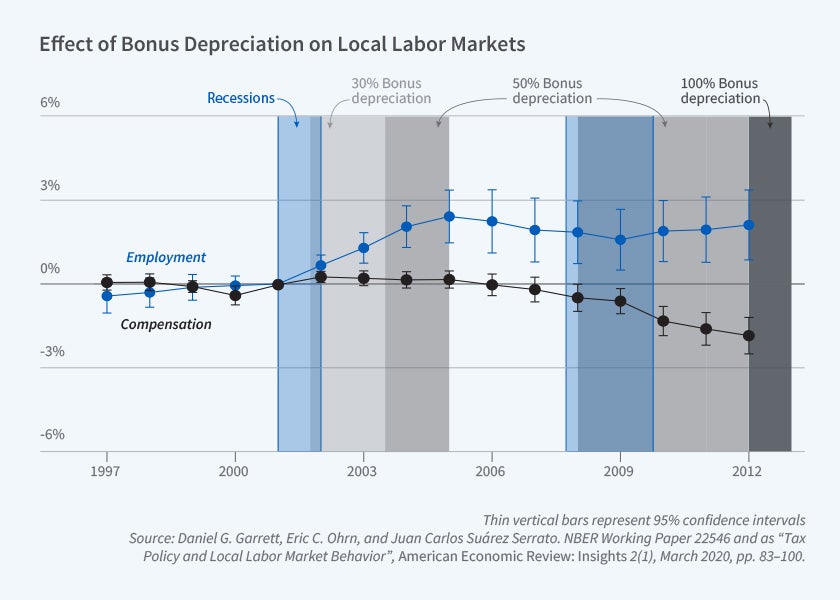
In work with Dan Garrett and Eric Ohrn, Suárez Serrato studies the local labor market effects of bonus depreciation.9 While bonus depreciation applies to all corporations in the US, firms in industries that rely on assets with longer depreciation schedules benefit most from the policy. The effects of the policy can be identified by studying local labor markets with greater exposure to the industries that benefit the most from it. Figure 2 plots the results of an event-study analysis showing that the introduction of the policy in 2001 led to significant employment growth in locations with greater exposure to bonus depreciation. Increasing a location’s exposure to bonus depreciation from the 25th to the 75th percentile of the distribution increased employment by 2.1 percent on average over the sample period. The estimates suggest that every job created by this policy cost taxpayers between $20,000 and $50,000. On the other hand, Figure 2 also shows that these employment increases were not accompanied by increases in the average earnings of workers.
A benefit of studying the local labor market effects of tax policies is that these estimates capture spillover effects of capital investment on the local economy. However, this benefit comes at the cost of not being able to directly estimate how individual plants substitute between capital and labor or whether the policy leads to additional productivity growth.
A related study by Mark Curtis, Kevin Roberts, Garrett, Ohrn, and Suárez Serrato examines how US manufacturing plants responded to this tax policy.10 It analyzes confidential plant-level data from the Census Bureau. To measure the effects of the policy, the study compares plants that had more to gain from the policy to those that would benefit less, relying on industry-level tabulations from Eric Zwick and James Mahon.11 The data show that plants that could benefit the most from bonus depreciation saw sustained relative increases in capital investment and in capital stocks.
Relative to other firm-level datasets such as financial statements data or tax data, the data from the Census Bureau provide insight into manufacturing plants’ response to tax policy. Plants that increase their capital use also have large increases in employment. Interestingly, the employment increases are concentrated among production workers, who are more likely to operate new machines.
Using more aggregate data, the research also shows that bonus depreciation led to larger employment increases for workers in demographic groups that have been historically excluded from the manufacturing sector: Black, Hispanic, female, and less-educated workers see larger employment increases because of the policy.
These employment gains raise the question of whether policies that incentivize capital investment can also increase worker pay. In the case of bonus depreciation, capital accumulation was not accompanied by gains in total factor productivity at the plant level, or by increases in the average earnings of workers at the plants that could benefit the most from the policy.
These findings bear on the question of whether tax incentives for capital investment benefit workers or lead to automation. The finding of employment increases suggests that the worst fears about policy-driven automation did not materialize. At the same time, increased capital accumulation did not translate into productivity or wage growth. While wages did not increase on average, the results show that the policy helped workers from traditionally underrepresented groups gain a foothold in the manufacturing industry, historically a pathway to the middle class.
New Directions in Corporate Tax Research
While the research described above focuses on the US economy, research by business tax scholars on other leading economies has also made inroads. A particularly interesting case study is that of China, which has long spent more in capital investment than the US and which is also increasing its emphasis on innovation and R&D. In a series of coauthored papers, Suárez Serrato has studied the structure of business taxation in China,12 how Chinese firms respond to tax incentives for R&D investment,13 and how tax policies interact with other investment frictions.14 Research on business taxation in China can improve our understanding of policies used to stimulate the economy and to transition from a production-based to a knowledge-based economy.
International taxation is also a fertile area for business taxation research. A key concern in this literature is that multinational corporations shift profits to low-tax countries at the expense of domestic taxpayers. Some of our recent work uses tax data to document the prevalence of advanced tax planning structures among US multinationals15 and to examine whether policies meant to limit profit shifting can be circumvented by multinational corporations.16 Ongoing research also studies the domestic employment effects of policies that either facilitate profit shifting17 or that aim to limit the use of tax havens by US multinationals.18 This research focus is particularly timely given that international corporate taxation is in a period of flux, with the introduction of global minimum taxes and increased interest in new approaches for cooperation. We are currently exploring the effects of recent reforms on the investment behavior of US multinationals.19
Endnotes
“Who Benefits from State Corporate Tax Cuts? A Local Labor Markets Approach with Heterogeneous Firms,” Suárez Serrato JC, Zidar O. NBER Working Paper 20289, July 2014, and American Economic Review 106(9), September 2016, pp. 2582–2624.
“Top Wealth in America: New Estimates and Implications for Taxing the Rich,” Smith M, Zidar O, Zwick E. NBER Working Paper 29374, October 2021, and The Quarterly Journal of Economics 138(11), August 2022, pp. 515–573.
“Who Benefits from State Corporate Tax Cuts? A Local Labor Market Approach with Heterogeneous Firms: Further Results,” Suárez Serrato JC, Zidar O. NBER Working Paper 31206, May 2023.
Malgouyres, Mayer, and Mazet-Sonilhac (2022) observe that Suárez Serrato and Zidar (2016) did not account for the compositional margin, which is the effect of tax changes on average idiosyncratic firm productivity, and was inconsistent in addressing whether or not the cost of capital varied across locations. In Suárez Serrato and Zidar (2023), we show that accounting for the composition margin and the cost of capital in the baseline structural model has modest effects on estimates of corporate tax incidence.
“The Structure of State Corporate Taxation and Its Impact on State Tax Revenues and Economic Activity,” Suárez Serrato JC, Zidar O. NBER Working Paper 23653, August 2017, and Journal of Public Economics 167, November 2018, pp. 158–176.
“Evaluating State and Local Business Tax Incentives,” Slattery C, Zidar O. NBER Working Paper 26603, January 2020, and Journal of Economic Perspectives 34(2), Spring 2020, pp. 90–118. This study relies on data from “Bidding for Firms: Subsidy Competition in the US,” Slattery, C. Working Paper, University of California, Berkeley, 2022. https://cailinslattery.com/s/Slattery-2022-Bidding-for-Firms.pdf
“Do Corporate Tax Cuts Increase Income Inequality?” Nallareddy S, Rouen E, Suárez Serrato JC. NBER Working Paper 24598, August 2019.
“State Taxes and Spatial Misallocation,” Fajgelbaum P, Morales E, Suárez Serrato JC, Zidar O. NBER Working Paper 21760, November 2015, and Review of Economic Studies 86(1), January 2019, pp. 333–376.
“Tax Policy and Local Labor Market Behavior,” Garrett DG, Ohrn EC, Suárez Serrato JC. NBER Working Paper 25546, February 2019, and American Economic Review: Insights 2(1), March 2020, pp. 83–100.
“Capital Investment and Labor Demand,” Curtis EM, Garret DG, Ohrn EC, Roberts KA, Suárez Serrato JC. NBER Working Paper 29485, June 2022.
Tax Policy and Heterogeneous Investment Behavior,” Zwick E, Mahon J. NBER Working Paper 21876, January 2016, and American Economic Review 107(1), January 2017, pp. 217–248.
“The Structure of Business Taxation in China,” Chen Z, He Y, Liu Z, Suárez Serrato JC, Xu DY. NBER Working Paper 28051, November 2020, and Tax Policy and the Economy 35, 2021, pp. 131–177.
“Notching R&D Investment with Corporate Income Tax Cuts in China,” Chen Z, Liu Z, Suárez Serrato JC, Xu DY. NBER Working Paper 24749, October 2020, and American Economic Review 111(7), July 2021, pp. 2065–2100.
“Tax Policy and Lumpy Investment Behavior: Evidence from China’s VAT Reform,” Chen Z, Jiang Z, Liu Z, Suárez Serrato JC, Xu DY. NBER Working Paper 26336, June 2020, and The Review of Economic Studies 90(2), March 2023, pp. 634–674.
“Tax Planning Multinational Behavior,” Altshuler R, Boller L, Suárez Serrato JC. Working Paper, August 2023.
“The Race Between Tax Enforcement and Tax Planning: Evidence From a Natural Experiment in Chile,” Bustos S, Pomeranz D, Suárez Serrato JC, Vila-Belda J, Zucman G. NBER Working Paper 30114, June 2022.
“Effects of International Tax Provisions on Domestic Labor Markets,” Garrett DG, Ohrn E, Suárez Serrato JC. Proceedings, Annual Conference on Taxation and Minutes of the Annual Meeting of the National Tax Association 113, 2020, pp. 1–2.
“Effects of International Tax Provisions on Domestic Labor Markets,” Garrett DG, Ohrn E, Suárez Serrato JC. Proceedings, Annual Conference on Taxation and Minutes of the Annual Meeting of the National Tax Association 113, 2020, pp. 1–2.


