Longevity and the Well-Being of Populations
Life expectancy has increased tremendously in the United States, from an average of roughly 47 years in 1900 to 77 years in 2020. However, increases in longevity have not been equally distributed among all subgroups of the population. Longevity is an important component of well-being, possibly as important as income; people are willing to pay very large sums to protect and increase it. Understanding the evolution and distribution of lifespan is critical to understanding changes in population well-being. In this article I discuss how my research has contributed to our understanding of these patterns.
Disparities in Childhood Environments
Lifespan is unequally distributed across space and depends on where individuals are born and where they live. For example, among women born in 1900 who survived to age 40, those born in West Virginia lived to age 76.6, while those born in North Dakota lived 3.4 years longer. Similarly, the gap between men born in the highest and lowest life expectancy states was about four years.1 This suggests that some disparities can be traced to childhood and particularly to the environments in which children grow. But what elements of the environment matter and, more importantly, what interventions would benefit children and increase their longevity?
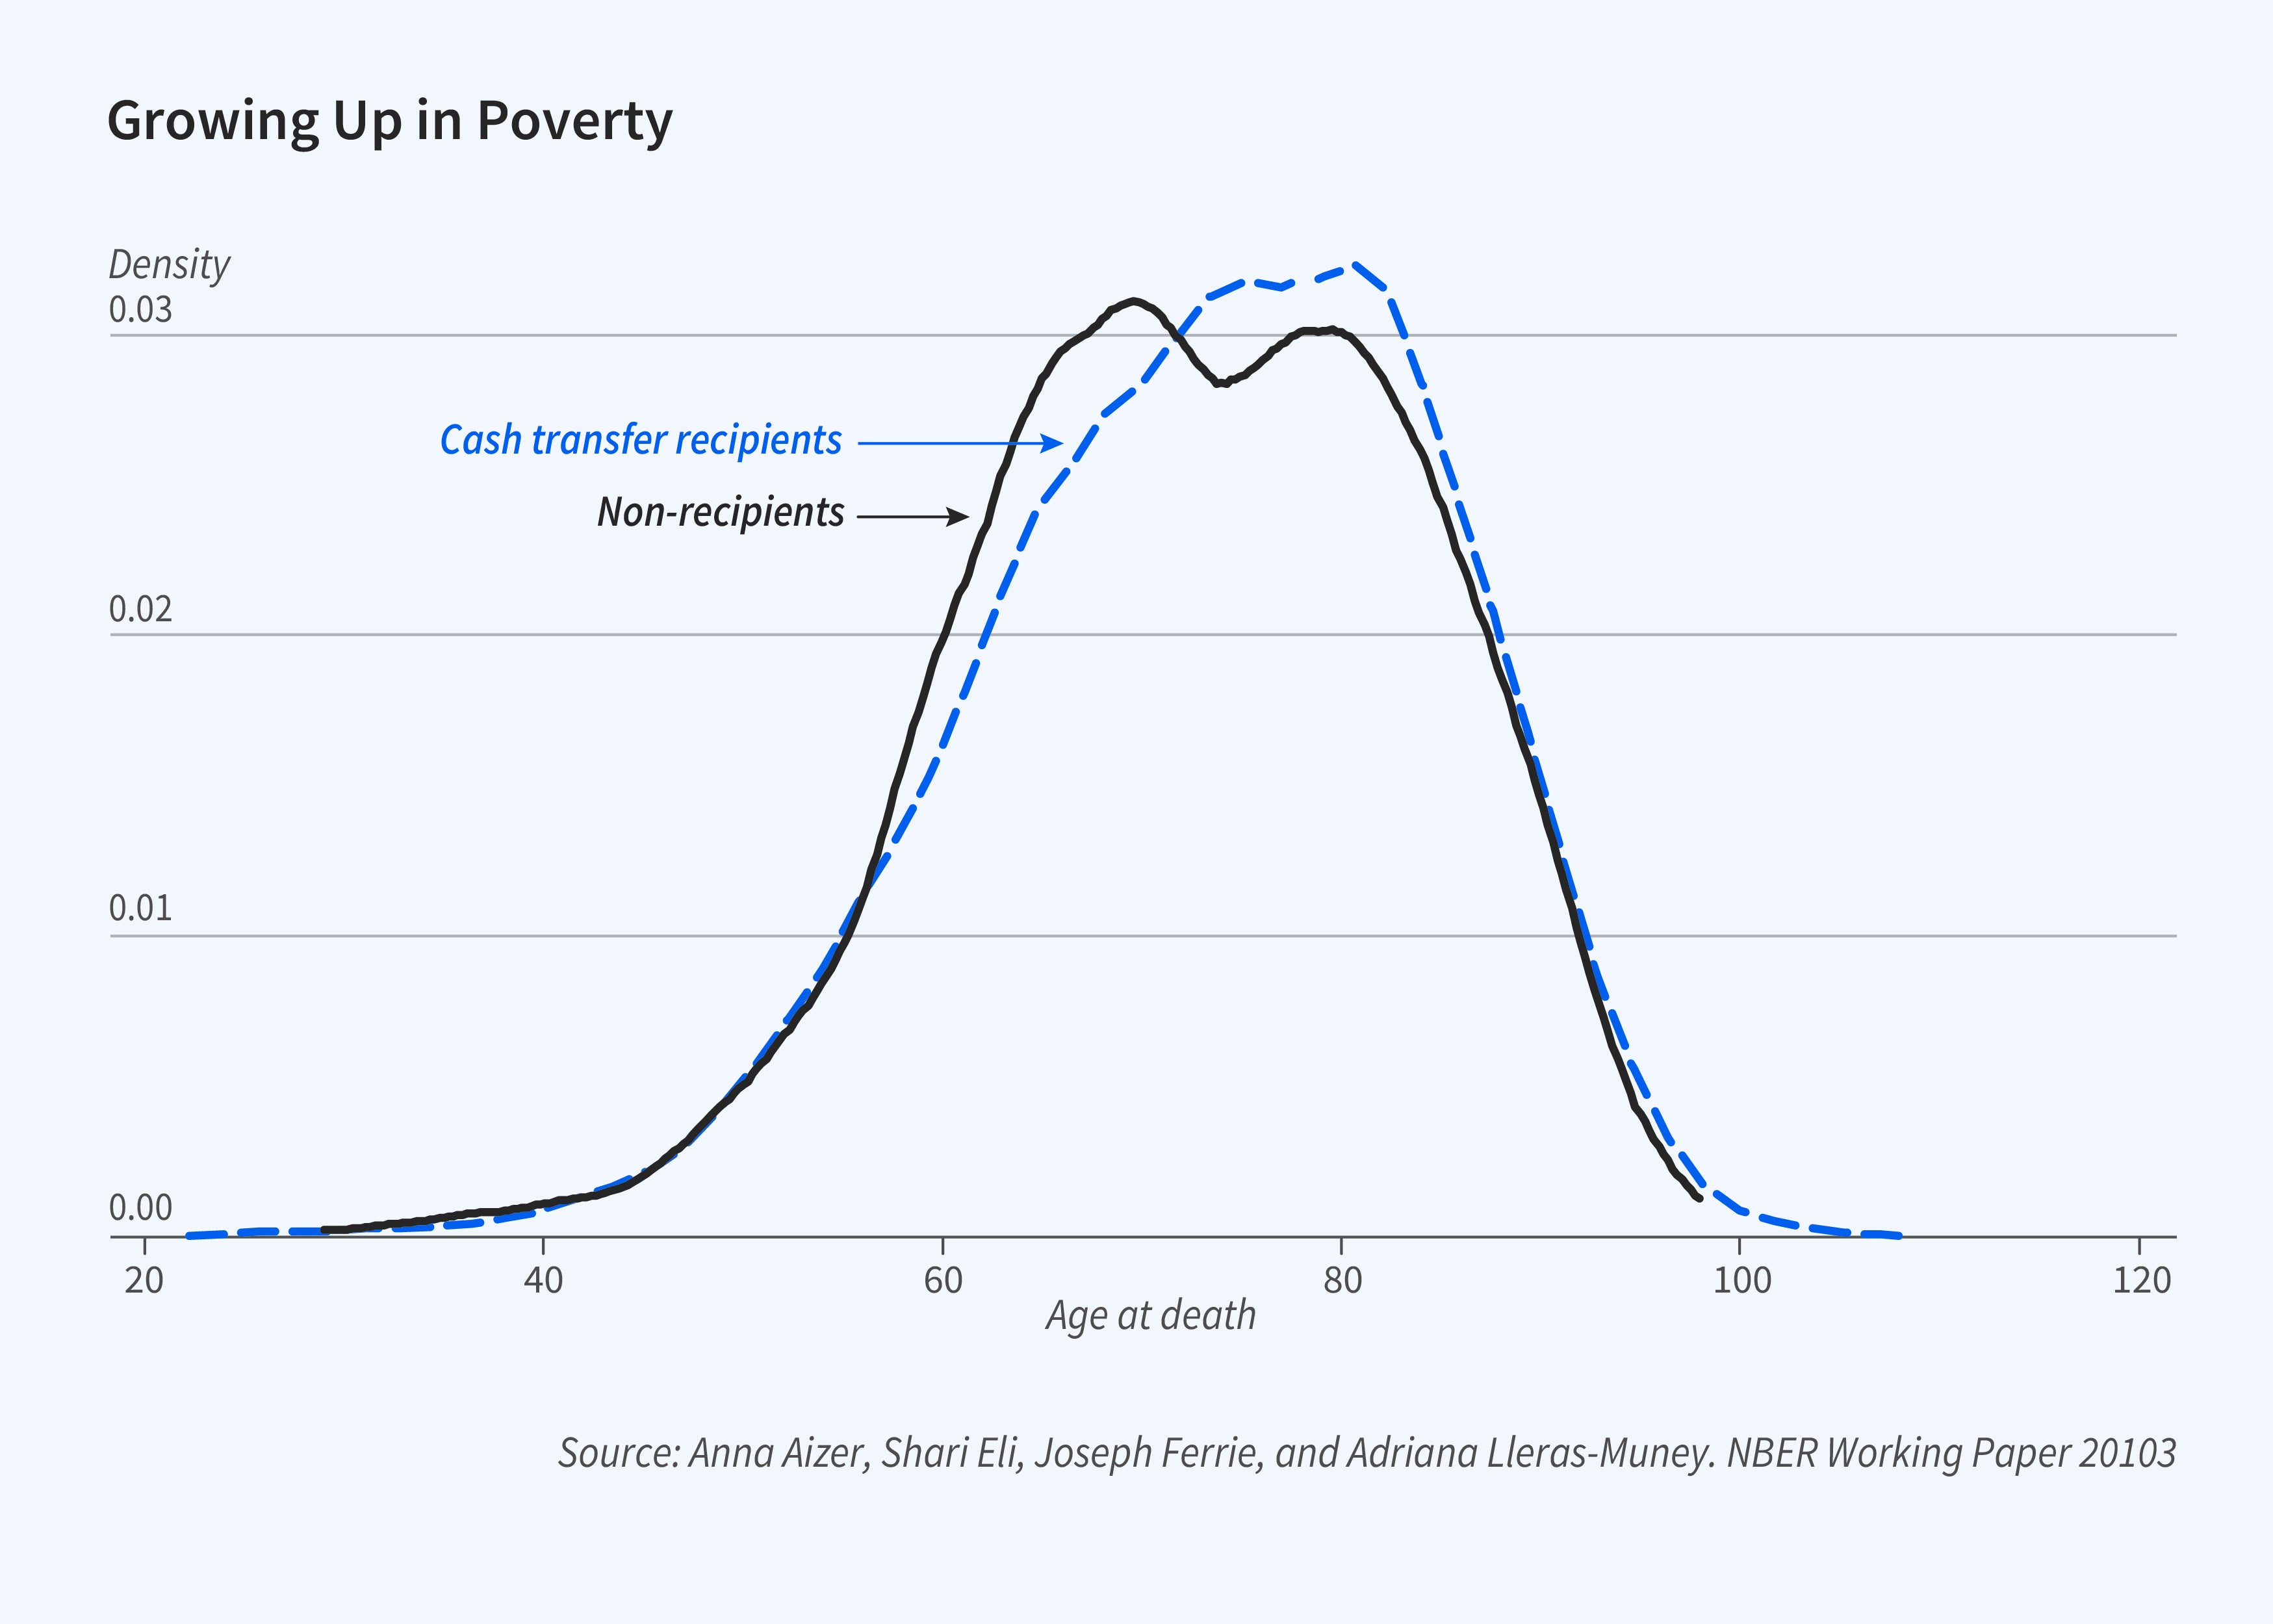
Perhaps not surprisingly, family income during childhood matters. Previous work has shown that the association between family income and health is small at birth but grows over the lifetime.2 Poor children eventually turn into poor adults, and poor adults live substantially shorter lives.3 But can governments help children growing up in poverty? Anna Aizer, Shari Eli, Joseph Ferrie, and I show that cash transfers to poor mothers given through the Mothers’ Pensions program — the precursor to Aid to Families with Dependent Children — increased the longevity of their sons (Figure 1).4 The median transfer lasted three years and amounted to roughly 30 percent of family income. Boys in families that received transfers lived more than a year longer as a result.
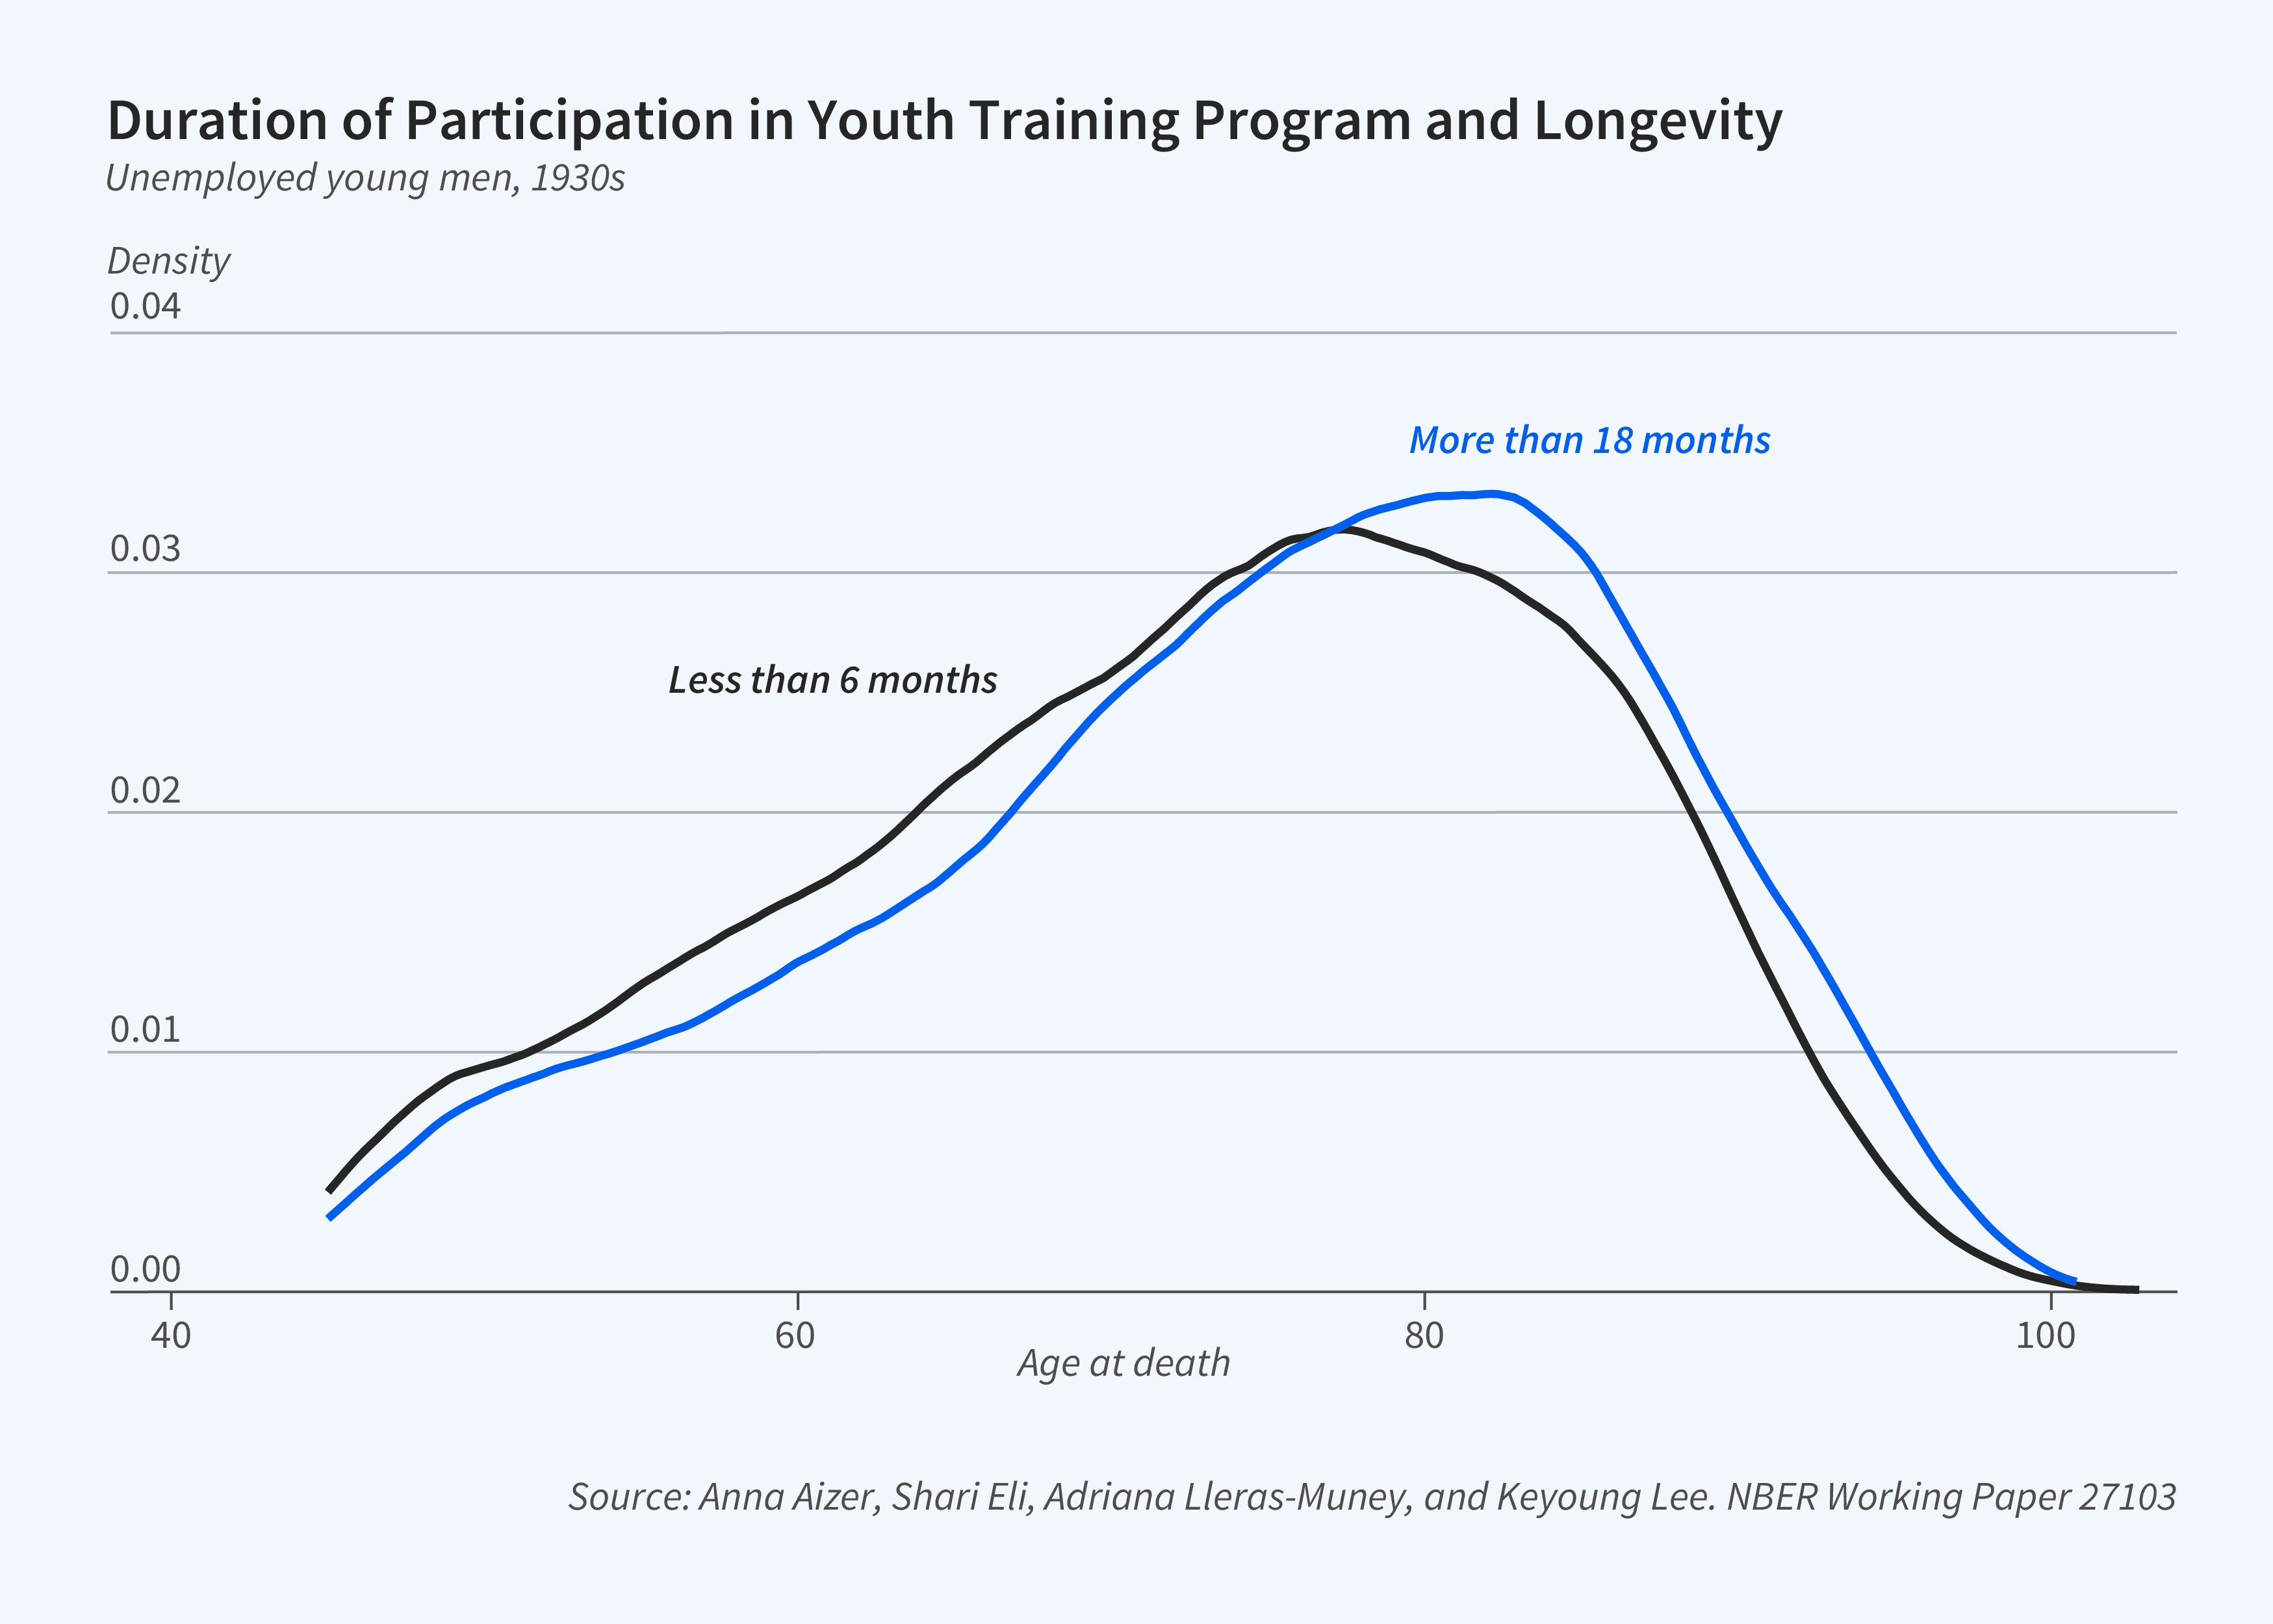
Previous work also has shown that individuals graduating from college in recessions have substantially higher mortality later in life, and lower lifetime incomes, than those who graduate in stronger economic circumstances.5 But can programs that target unemployed youth undo these harms? Aizer, Eli, Guido Imbens, Keyoung Lee, and I study the impacts of the Civilian Conservation Corps, a youth employment program in place during the Great Depression that provided employment and training to unemployed men (but not women) ages 17 to 25.6 We find that young men who participated in the training program for a longer time had greater lifetime earnings and longevity (Figure 2).
These studies show that the environments in which children grow up and the conditions in which they enter adulthood matter, and more importantly, they show that interventions to improve their circumstances can have large consequences over the lifetime, at least for men.
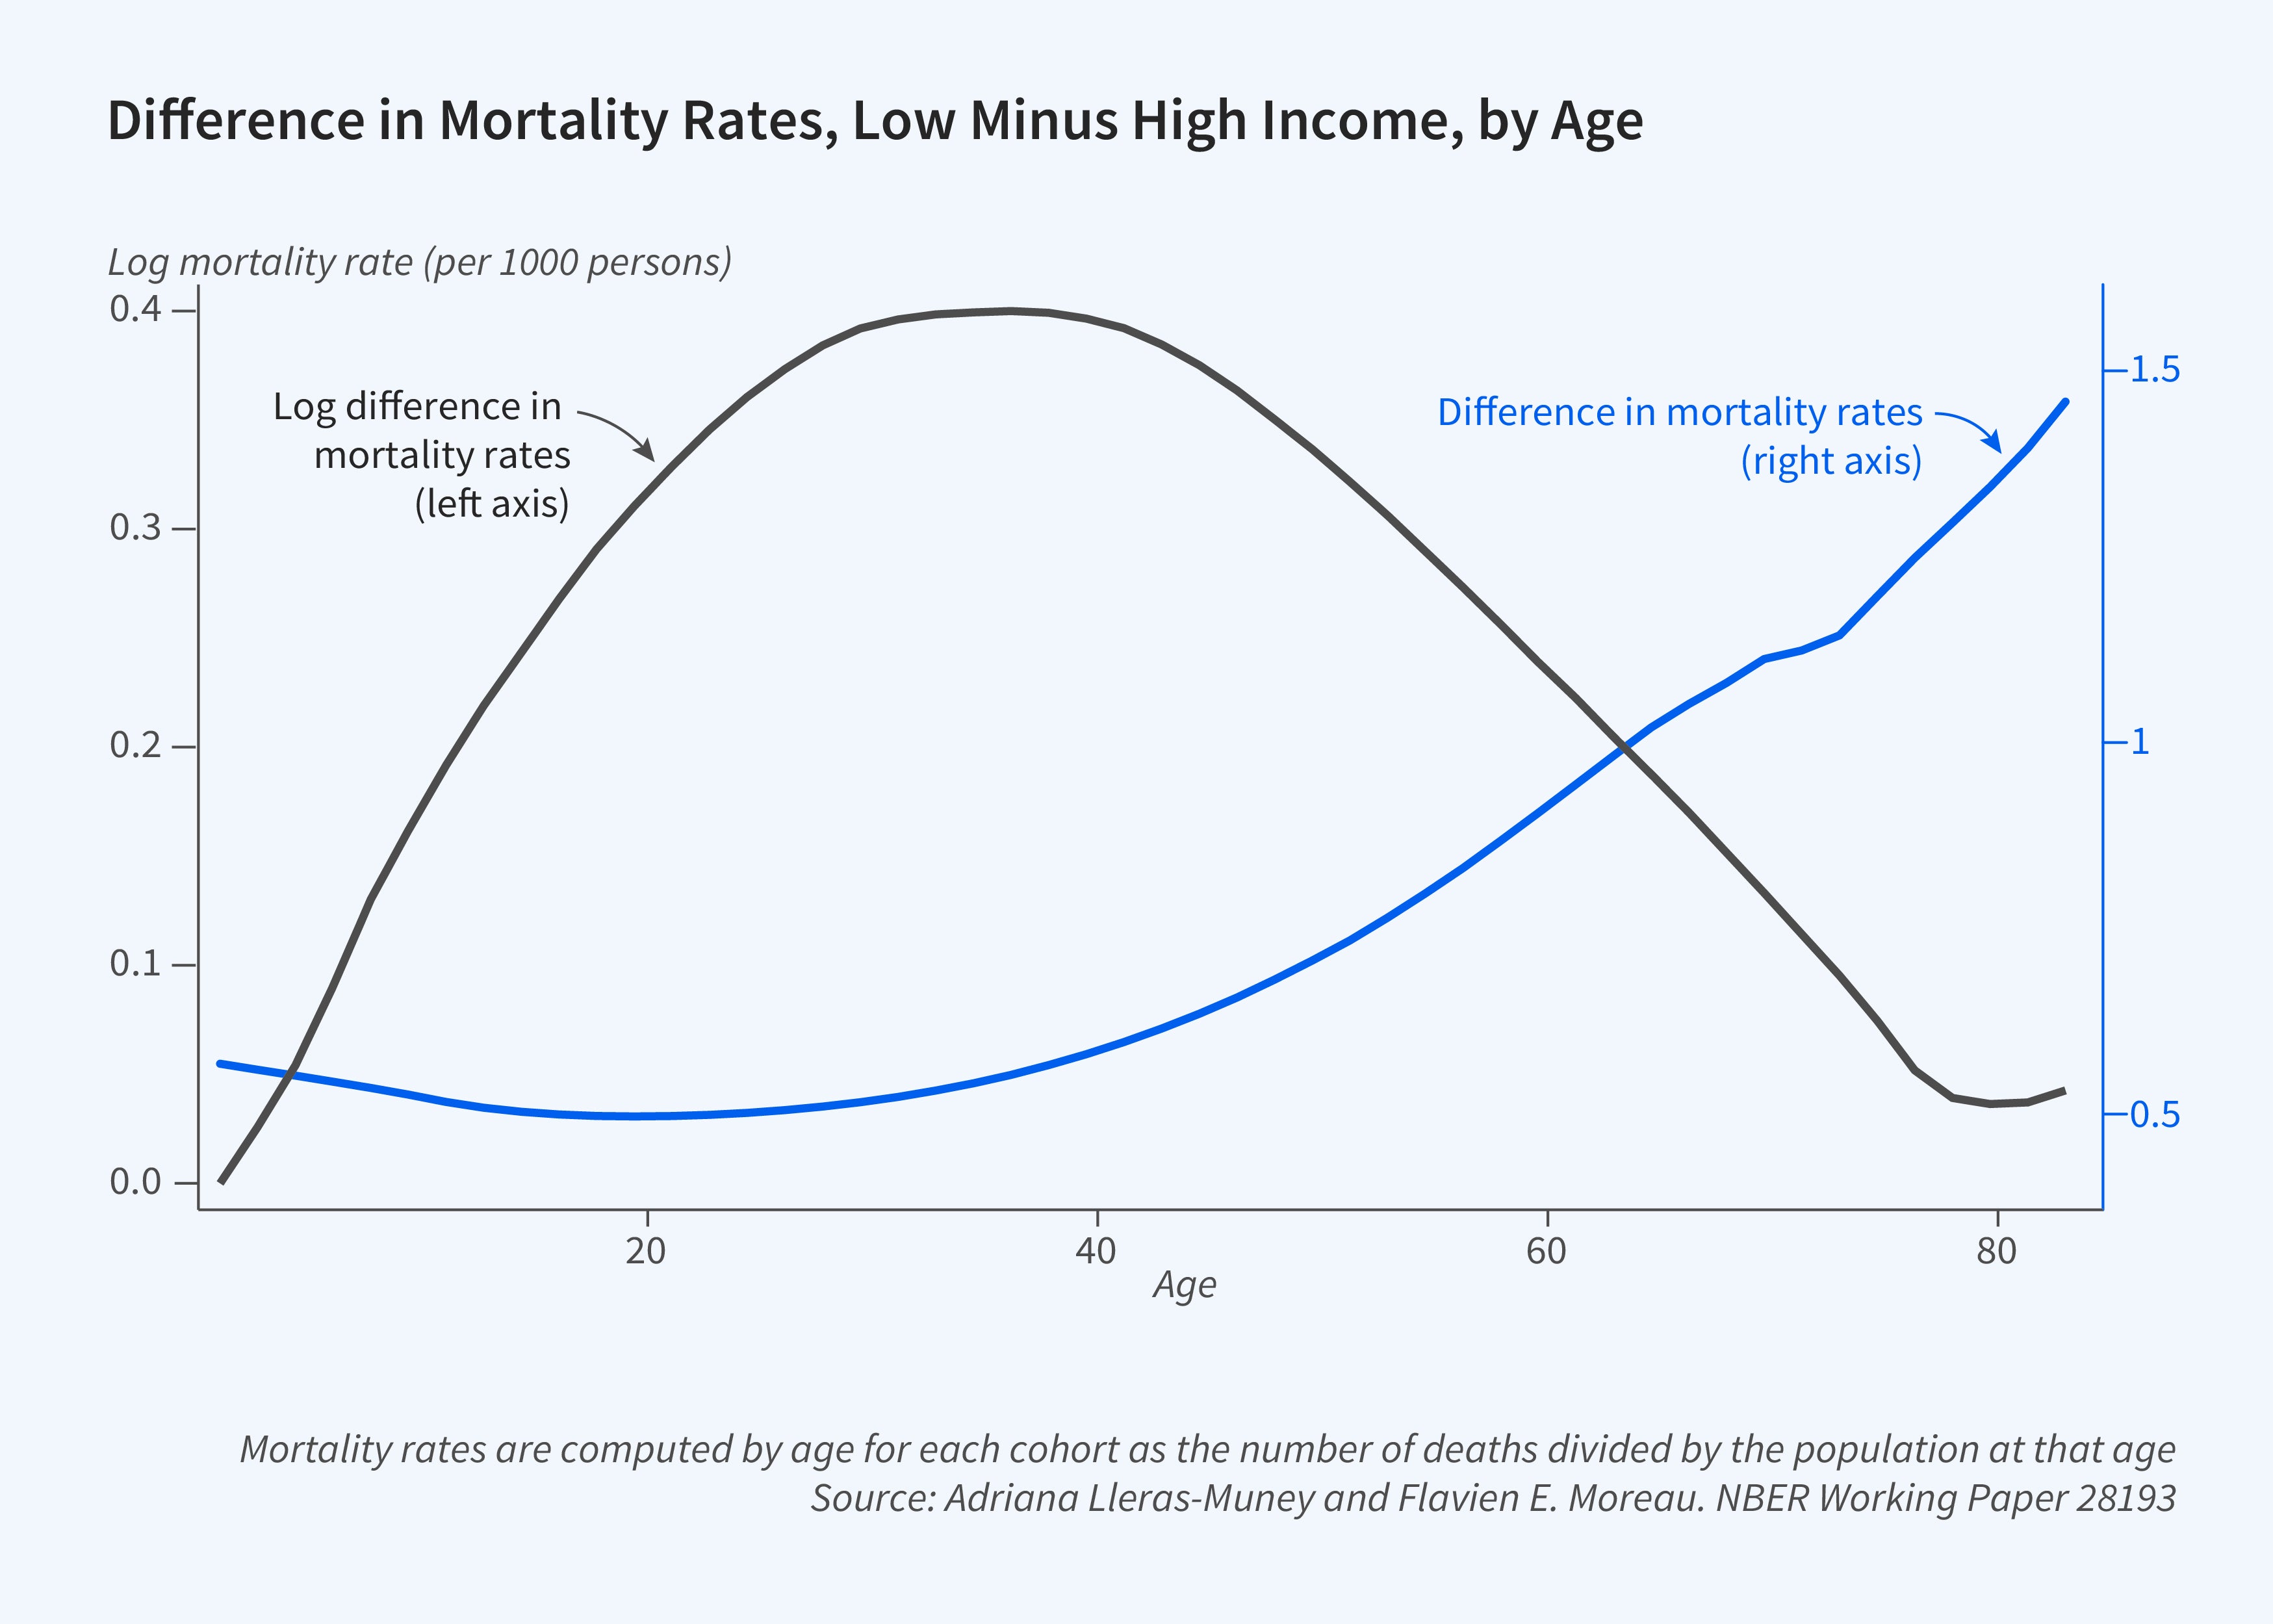
In both studies, we only observe intervention-related declines in mortality at older ages: there is no visible impact before age 55 or so. Why do the effects of childhood conditions manifest only later in life, and how can we predict the long-term effect of changes in the environment? To understand this, Flavien Moreau and I posit and estimate a model that tracks the evolution of health and mortality from birth to death for a given cohort and use it to understand the effects of temporary and permanent shocks.7 The model predicts that adverse conditions throughout life will have nonlinear effects on health and mortality. The gap in mortality rates between affected and unaffected populations is U-shaped (Figure 3, right axis). Early on, adverse circumstances increase mortality. But because of selective mortality — the least healthy die — and health investments among the survivors, the gaps in mortality between affected and unaffected populations will not be large between ages 5 and 40. Starting in middle age, when mortality rates start rising with age, the gap in mortality rates between affected and unaffected populations grows. As the figure shows, these patterns are quite different when expressed in logs (left axis): log gaps, or effects in roughly percentage terms, are hump shaped instead of U shaped and diminish with age after a certain point. These predicted patterns by age match previously documented differences in mortality rates by education and income.
Our model in combination with the empirical evidence suggests caution for those evaluating interventions: longevity gains to early interventions may be substantial, but we should not expect to observe them before individuals reach mature ages. These results also suggest optimism for the future of populations I have not studied. Disparities in longevity by race today are large, but it is likely that the improved childhood conditions experienced by Black people in recent years, manifested in the continued decline in under-5 mortality rates for this group in the last four decades, presage increased longevity in the future despite recent negative shocks.8
Education Disparities: When and Why?
Education, which is largely experienced in childhood, is a very strong predictor of many lifetime outcomes, including longevity. In the early 1990s, those with a college degree could expect to live 2.6 years longer than those without one. By 2020, this gap had grown to more than 6 years.9 A key question then is whether the effect of education on longevity is causal or whether the association is due to other factors.
I attempted to answer this question by comparing the life expectancy of those who attended secondary school for different durations in the first half of the twentieth century because compulsory education laws in the US forced children to attend school for a different number of years over time and across states.10 Many subsequent studies followed a similar strategy in other countries and for different cohorts. Titus Galama, Hans van Kippersluis, and I summarized this body of research.11 Although the original US study suggested the effect of education on mortality was causal and large, the same does not hold true in all other settings. In general, the benefits of education appear to be larger for men than for women, but even among men the effects only exist for some cohorts and in some countries. Why?
I argue that the effect of education on health and longevity — the “education gradient” — is mediated by context. One important contextual dimension is the rate of technological innovation. Gradients vary with technical innovation and knowledge because individuals with more education can adopt and access innovations first and at greater rates. Indeed, David Cutler and I document that more educated individuals were more likely to smoke in the 1950s, but they became less likely to smoke in subsequent decades as information about the harms of smoking was disseminated.12 Relatedly, in work with Sherry Glied, I find that education disparities in mortality are larger for diseases for which there has been more innovation.13 This relationship suggests that the effects of education on longevity might be less important when there is less innovation.
Economic conditions also matter because they determine the employment and earnings paths of individuals throughout their lives. Both employment and lifetime income affect longevity. Cutler, Wei Huang, and I show that education is more strongly associated with longevity among those graduating in bad economic times than for those graduating in good times.14 This suggests that the effects of education on longevity are larger when the labor market benefits of schooling are larger.
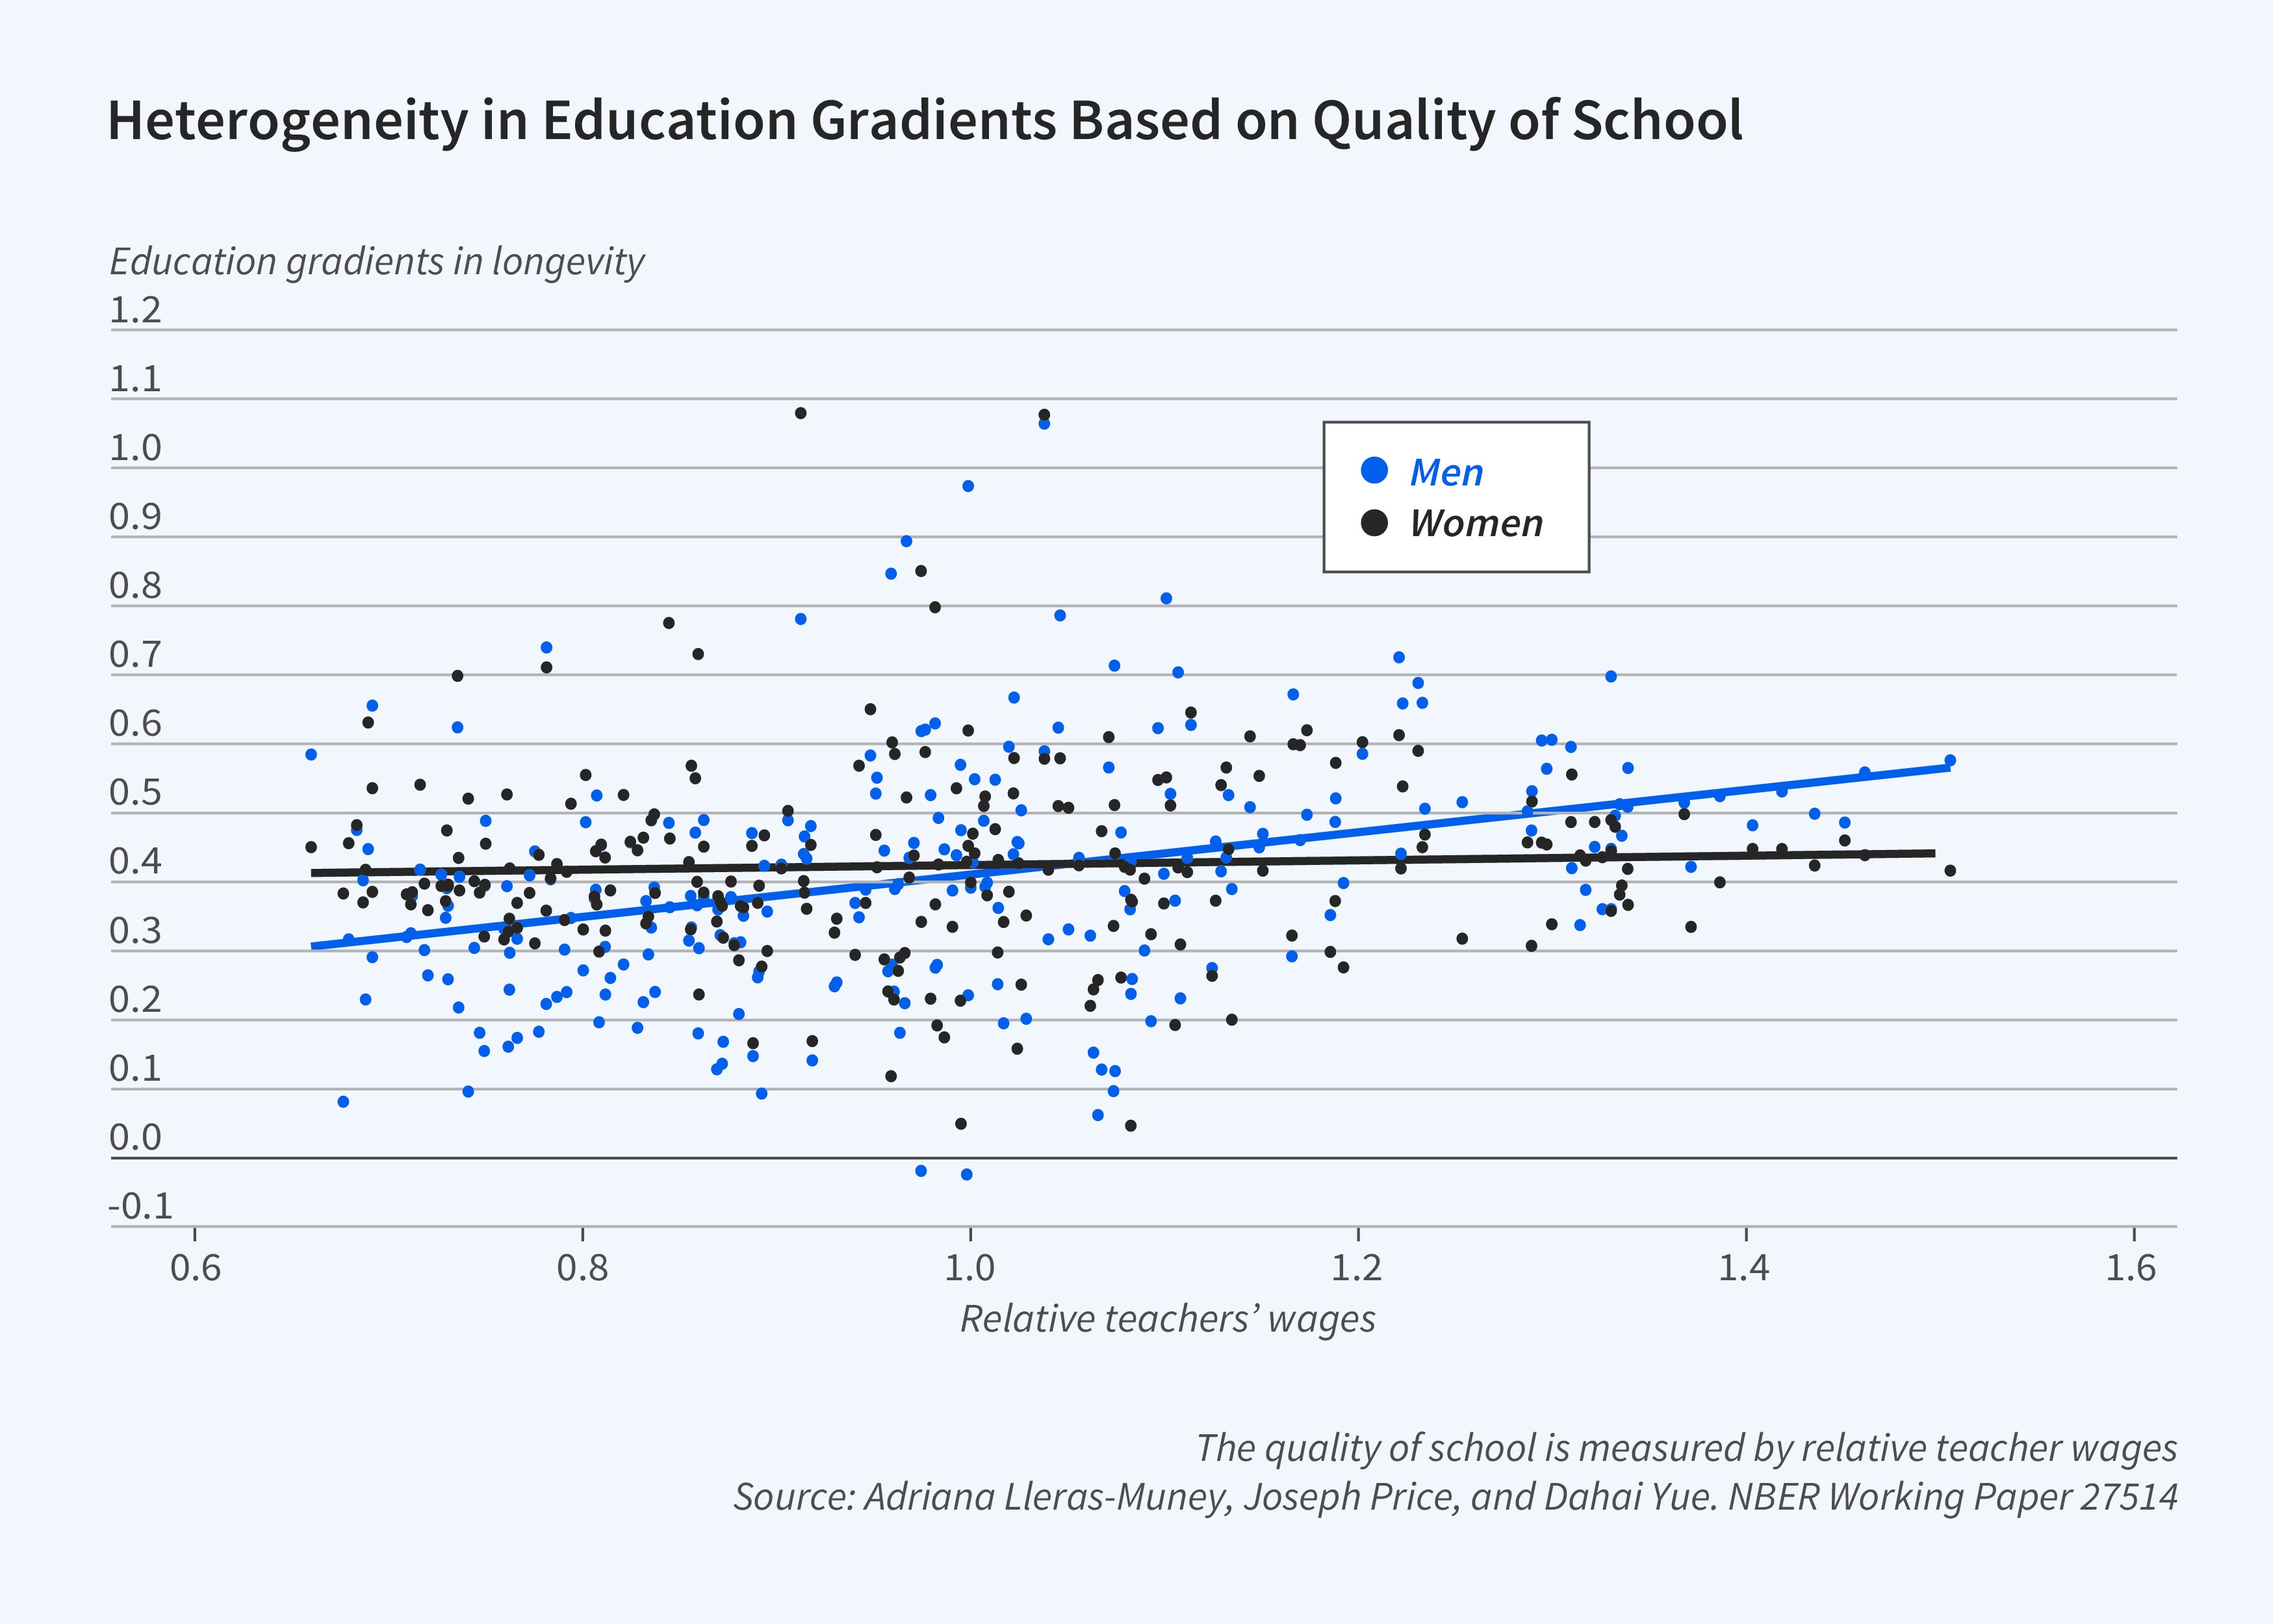
Finally, variation in education gradients may reflect variation in the quality of schooling. The number of years spent in school, the measure most typically used in research studies, can lead to different levels of cognitive and noncognitive skills in different settings because the quality of education varies: two individuals with 12 years of school can have vastly different levels of mathematics skills, or levels of writing proficiency for example, depending on the quality of the school they attended. These differences can matter for health because many of the skills learned in school affect decision-making. Joseph Price, Dahai Yue, and I document that for White men, but not women, the gap in longevity between the more and less educated within families was substantially larger in places where teachers were well paid, the school year was longer, and pupil-teacher ratios were lower. Figure 4 shows these results for teachers’ wages. We find that these education gaps also were larger for men who grew up in richer environments and among more educated people, and where the level of health care was greater. In sum, in places with greater inputs to human capital, the benefits of schooling in terms of longevity are also larger, at least for men.
Gender Puzzles
Today, women live longer than men in almost every country. In the US, women live on average to age 79.8, whereas men live only to age 74.1, a 5.7-year gap. In 1900 this gap was only 2.5 years.15 Though several genetic and other biological differences benefit women, it is not clear why gender gaps in longevity have grown so much. Some of the increases in female longevity were driven by the near elimination of maternal mortality, due to the development of sulfa drugs and later of blood transfusions and penicillin, as Seema Jayachandran, Kim Smith, and I show.16 However, Claudia Goldin and I demonstrate that these declines in maternal mortality can explain only a modest portion of the increases in life expectancy for women and thus of the gender gap in life expectancy.17 Declines in fertility might explain another portion, but this explanation also seems unlikely to be a large contributor: in 1900 the total fertility rate was already relatively low, at fewer than four births per woman.
Innovation in female disease could also explain the gaps. However, with some important exceptions, technological advances in medicine after 1950 typically targeted diseases associated with males and were tested mostly on men. It thus remains a puzzle whether or why women have gained more over time from these advances. It is also not clear that women’s life expectancy gains are due to the economic progress of women more generally. In fact, others have noted that the gender gap in life expectancy started to fall as women entered the labor force and became “more like men” in terms of work and consumption behaviors such as smoking. Goldin and I hypothesize instead that the decline in infectious disease that occurred in the first half of the twentieth century benefited women more: as caretakers, women were more likely to be exposed to infectious disease early in life, and they might have suffered more long-term consequences from this exposure in the past when infectious diseases were rampant. However, this theory linking exposure to infectious disease early in life and longevity remains untested.
More generally, the environments or conditions that benefit women’s longevity are poorly understood but they appear to be quite different from those that benefit men. Aizer, Eli, Sungwoo Cho, and I find that poor women who received transfers as adults through the Mothers’ Pension program did not live longer, even though their sons did.18 In recent (unpublished) work, we follow the daughters of the recipients and we also find that, in contrast to their brothers, daughters did not live longer as a result of the cash transfers. It is unclear why.
Socioeconomic gradients in mortality by gender also present a puzzle. As noted earlier, education gradients are typically larger, when they exist, for men than for women. Even when gradients are observed for both men and women, factors that predict the size of the gradient for men cannot explain it for women. As Figure 4 shows, the correlation between education and longevity is larger for men who grew up in states where the quality of education was better. However, the same does not appear to be true for women. In fact, we cannot find any marker for childhood conditions that explains why the associations between education and longevity vary for women across cohorts and places, whereas almost all the characteristics of the environments we measure — average education, income, health care availability — affect the correlation between education and longevity for men. The finding that innovation leads to greater education disparities in mortality among men was not true for women either.19 Understanding what environments benefit women and why women’s health and longevity respond differently to the same inputs as men’s is an important area for future research.
Endnotes
“The Association between Educational Attainment and Longevity Using Individual Level Data from the 1940 Census,” Lleras-Muney A, Price J, Yue D. NBER Working Paper 27514, July 2020, and Journal of Health Economics 84, July 2022, 102649.
“Economic Status and Health in Childhood: The Origins of the Gradient,” Case A, Lubotsky D, Paxson C. NBER Working Paper 8344, June 2001, and American Economic Review 92(5), December 2002, pp. 1308–1334.
“The Association between Income and Life Expectancy in the United States, 2001–2014,” Chetty R, Stepner M, Abraham S, Lin S, Scuderi B, Turner N, Bergeron A, Cutler D. Journal of the American Medical Association 315(16), April 2016, pp. 1750–1766.
“The Long Term Impact of Cash Transfers to Poor Families,” Aizer A, Eli S, Ferrie J, Lleras-Muney A. NBER Working Paper 20103, May 2014, and American Economic Review 106(4), April 2016, pp. 935–971.
“Socio-Economic Decline and Death: The Life-Cycle Impacts of Recessions for Labor Market Entrants,” Schwandt H, von Wachter TM. NBER Working Paper 26638, January 2020.
"Do Youth Employment Programs Work? Evidence from the New Deal,” Aizer A, Eli S, Imbens G, Lee K, Lleras-Muney A. NBER Working Paper 27103, June 2020.
“A Unified Model of Cohort Mortality for Economic Analysis,” Lleras-Muney A, Moreau F. NBER Working Paper 28193, December 2020. Published as “A Unified Model of Cohort Mortality” in Demography 59(6), December 2022, pp. 2109–2134.
"Mortality Inequality: The Good News from a County-Level Approach,” Currie J, Schwandt H. NBER Working Paper 22199, April 2016, and Journal of Economic Perspectives 30(2), Spring 2016, pp. 29–52.
"Mortality Rates by College Degree before and during COVID-19,” Case A, Deaton A. NBER Working Paper 29328, October 2021.
“The Relationship between Education and Adult Mortality in the United States,” Lleras-Muney A. NBER Working Paper 8986, June 2002, and The Review of Economic Studies 72(1), January 2005, pp. 189–221.
“The Effect of Education on Health and Mortality: A Review of Experimental and Quasi-Experimental Evidence,” Galama T, Lleras-Muney A, van Kippersluis H. NBER Working Paper 24225, January 2018, and Oxford Research Encyclopedia of Economics and Finance 24, May 2018.
“Education and Health: Insights from International Comparisons,” Cutler DM, Lleras-Muney A. NBER Working Paper 17738, January 2012, and Encyclopedia of Health Economics 1, Culyer AJ editor, , pp. 232–245, San Diego: Elsevier, 2014.
“Technological Innovation and Inequality in Health,” Glied S, Lleras-Muney A. Demography 45(3), August 2008, pp. 741–761.
“When Does Education Matter? The Protective Effect of Education for Cohorts Graduating in Bad Times,” Cutler DM, Huang W, Lleras-Muney A. NBER Working Paper 20156, May 2014, and Social Science & Medicine 127, February 2015, pp. 63–73.
The data on life expectancy over time and by gender comes from the Social Security Administration’s period life tables available here: https://www.ssa.gov/oact/HistEst/PerLifeTables/2023/PerLifeTables2023.html.
“Modern Medicine and the 20th Century Decline in Mortality: Evidence on the Impact of Sulfa Drugs,” Jayachandran S, Lleras-Muney A, Smith KV. NBER Working Paper 15089, June 2009, and American Economic Journal: Applied Economics 2(2), April 2010, pp. 118–146.
“XX>XY? The Changing Female Advantage in Life Expectancy,” Goldin C, Lleras-Muney A. NBER Working Paper 24716, October 2018, and Journal of Health Economics 67, September 2019, 102224.
“The Impact of Cash Transfers to Poor Mothers on Family Structure and Maternal Well-Being,” Aizer A, Cho S, Eli S, Lleras-Muney A. Working paper, 2023.
“Technological Innovation and Inequality in Health,” Glied S, Lleras-Muney A. Demography 45(3), August 2008, pp. 741–761.


