Sin Taxes: Good, Better, Best
Economists have long recognized that when consuming a good produces externalities, welfare can be raised by imposing corrective taxes. More recently, there has been a growing belief that some goods should be taxed because of internalities — harms that people might impose on themselves due to limited attention, misunderstanding of financial instruments, systematically biased beliefs about themselves such as overconfidence, or lapses of self-control. One of the agendas that we have pursued at the intersection of public economics and behavioral economics is the optimal design of corrective taxes and subsidies to mitigate both externalities and internalities. Relative to externalities, internalities have received much less attention from economists, but they have been a key focus of our work — and, quantitatively, we have found that they are as significant as externalities. Taxes addressing externalities and internalities are sometimes referred to colloquially as “sin taxes.”
There are several domains where economists and policymakers worry about both externalities and internalities. One concerns goods that are ostensibly harmful to health, such as cigarettes, alcohol, and sugary drinks. The externalities include burdens on the health system, and the internalities may range from incorrect beliefs about harmful health effects to lapses of self-control. Another domain concerns appliances or automobiles that vary in energy or fuel efficiency. Purchasing less-efficient goods increases environmental externalities and may also harm consumers themselves if they misperceive or are inattentive to the energy or fuel costs.
An additional consideration in these domains is that “sin goods” are more heavily consumed by low-income people. Thus, if the sin tax is not combined with some form of progressive redistribution of its revenues, the tax will increase financial inequality.
This summary draws together our research, involving both theory and measurement, which provides a reasonably holistic framework for designing and evaluating sin taxes. This research program takes into account both the difficult task of incorporating internalities and the additional question of optimal redistribution of tax revenue.
A Framework for Optimal Sin Taxes
As laid out by Arthur Pigou in the case of externalities, if consuming a good harms others, then people will consume too much in an unregulated market.1 Thus, taxing a good with negative externalities can raise welfare by reducing consumption toward the efficient level at which marginal social cost equals marginal social benefit.
A similar logic applies to markets with internalities. If behavioral biases cause an individual to ignore some harms from consuming a good, then their demand for that good is higher, at every price, than it would be if they were unbiased. The key to quantifying the welfare-maximizing sin tax is not measuring the overall harms from consumption but rather measuring the extent to which consumers underestimate those harms due to behavioral biases.
When consumers’ surplus and government revenues are weighted equally, the optimal tax equals the sum of the average marginal internalities and the average marginal externalities.2 This is a slight generalization of the principle of Pigouvian taxation, special cases of which have been previously studied by behavioral economists for parametric models of consumer mistakes like quasi-hyperbolic discounting.3
In our work, we relax the assumption that surplus is equally valuable for all consumers.4 We study a more general framework that can address concerns about regressive taxes that increase financial inequality. In this framework, the surplus of lower-income consumers receives more weight, which means that both their transfer to the government and, more subtly, their welfare gain from internality reduction receive more weight. The second point is sometimes omitted from public debates but it’s an important one: even if the financial incidence from a tax is regressive — lower-income people consume more of the good — the impact on costs from internalities may be progressive. The internality cost change will be most progressive when lower-income consumers are the ones making the larger mistakes and responding most to the tax. This is a key distinction from conventional analyses that only consider externalities: when externalities are borne by all of society, there is no notion of progressive behavior change in such frameworks.
The size of the optimal sin tax depends on the extent to which it is regressive or progressive, and on the extent to which any financial inequality in its incidence can be mitigated by progressive redistribution of its revenue. To what extent does it make sense to distribute the tax revenues progressively? A corollary of a classic result from public finance — the Atkinson-Stiglitz theorem — is that optimal progressive redistribution of the sin tax revenue must fully offset the regressive incidence of the sin tax when the only reason that lower-income people consume more of the sin good is that they have less money. However, if some of the across-income consumption patterns can be explained by differences in internalities or preferences, then optimal redistribution of tax revenue will be less progressive because it will be more distortionary of labor supply. Thus, the optimal sin tax will be lower because on net it will increase financial inequality. Our analysis provides a quantitative result about the optimal degree of redistribution, which we show can be computed by comparing the correlation of income and sin good consumption to the causal effect of income on sin good consumption.
While the above analysis focuses on linear sin taxes, some taxes/subsidies — such as those on energy use or savings — are nonlinear, means-tested, or both. We have extended our analysis to consider more-flexible tax policies, including nonlinear taxes on sin goods.5 In this setting, the extent to which it makes sense to offset the regressivity of the commodity tax through other policy channels is again determined by the difference between the correlational and causal associations of income and the taxed good.
We have applied these conceptual insights in three areas.
Application: Taxes on Sugary Drinks
Taxes on sweetened beverages are motivated by reducing both externalities (in this case, health care costs not paid by the individual) and internalities (such as self-control problems or lack of information about health harms). We have collected the necessary empirical parameters to quantify the welfare-maximizing tax level on sugary drinks.6
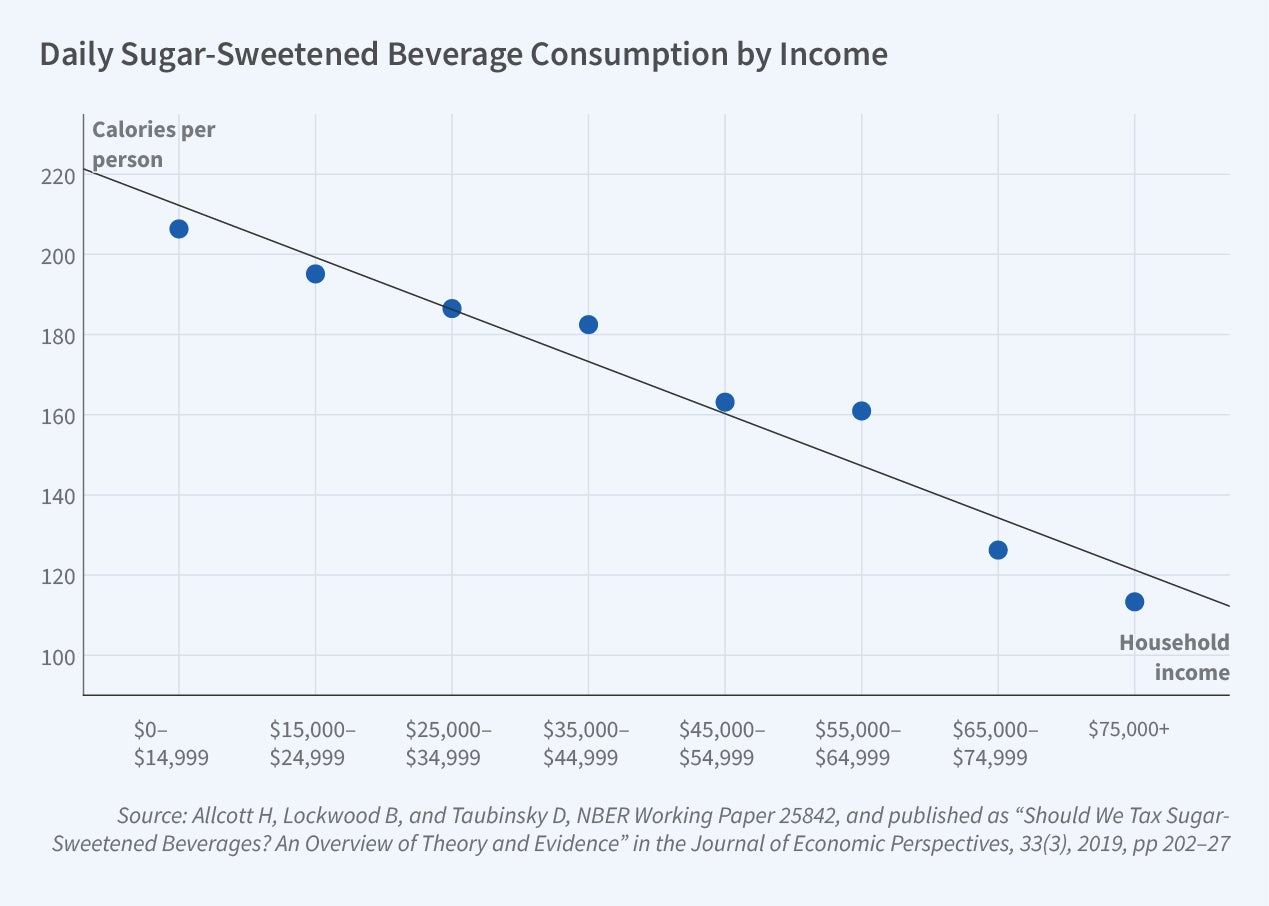
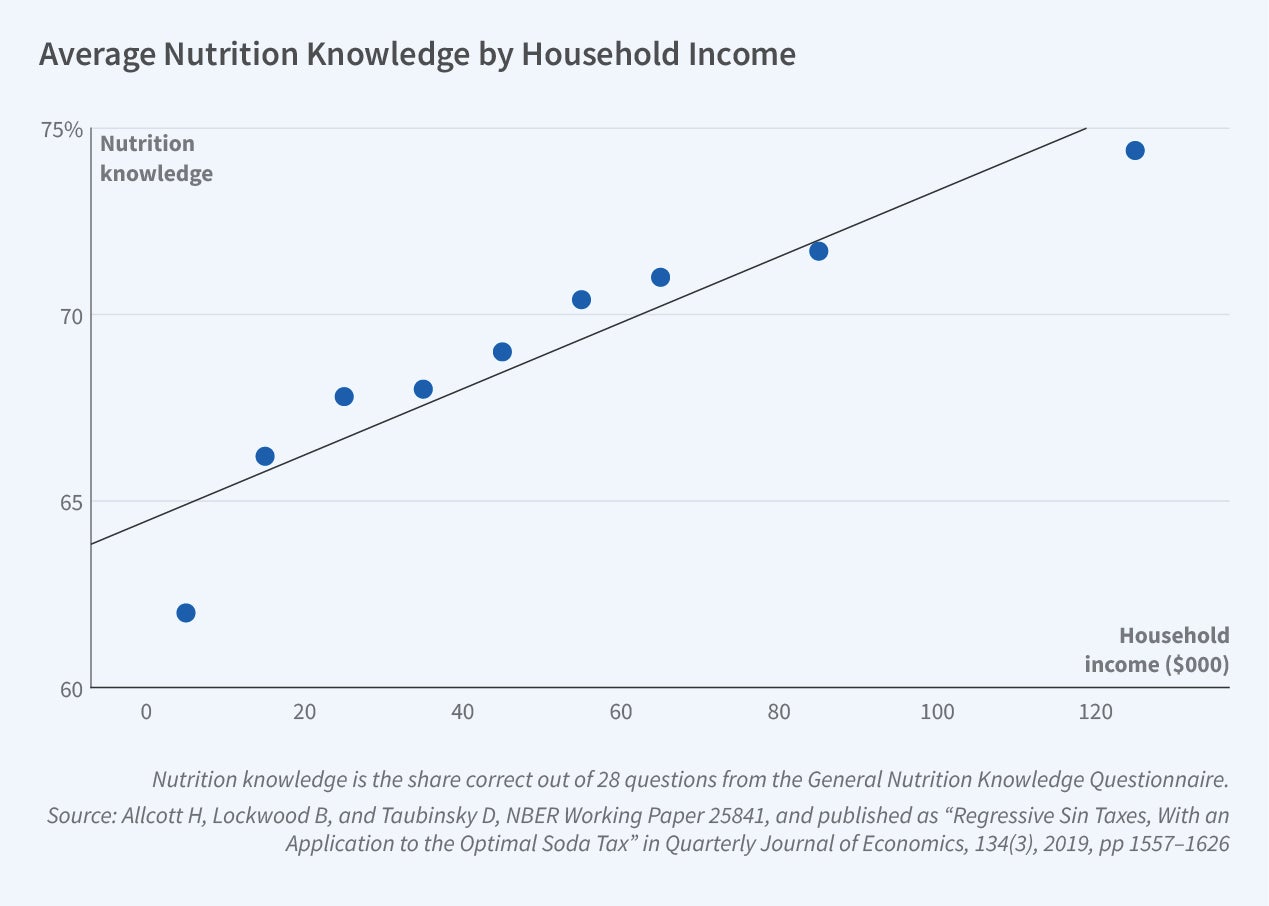
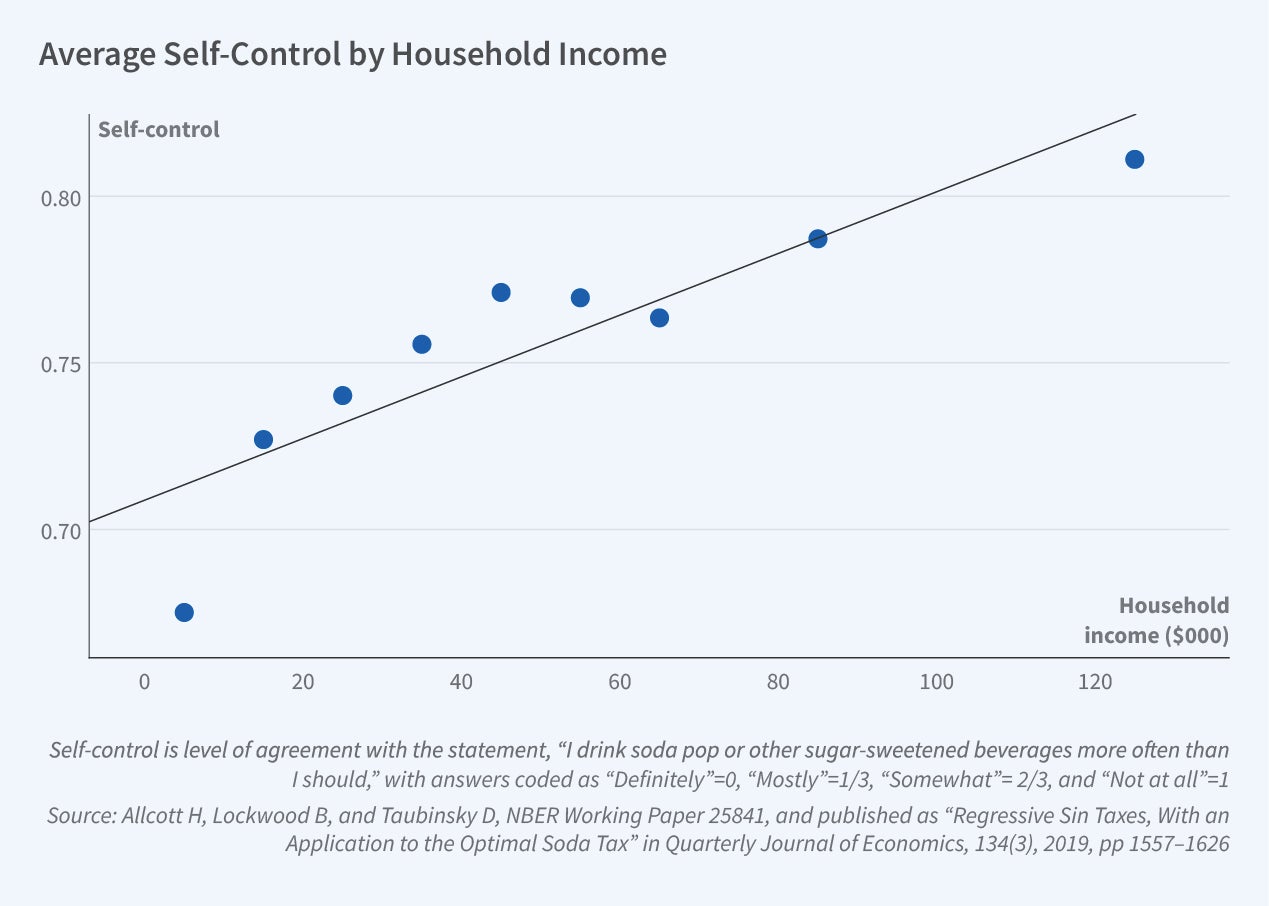
Figure 1 shows a key fact: lower-income people drink more sugary drinks. This might suggest that sugary drink taxes are financially regressive: lower-income households will pay more of these taxes. However, Figure 2 demonstrates an offsetting fact: lower-income people have less nutrition knowledge and Figure 3 shows that they report having less self-control over sugary drink consumption. They are more likely to say that they drink more sugary drinks than they should.
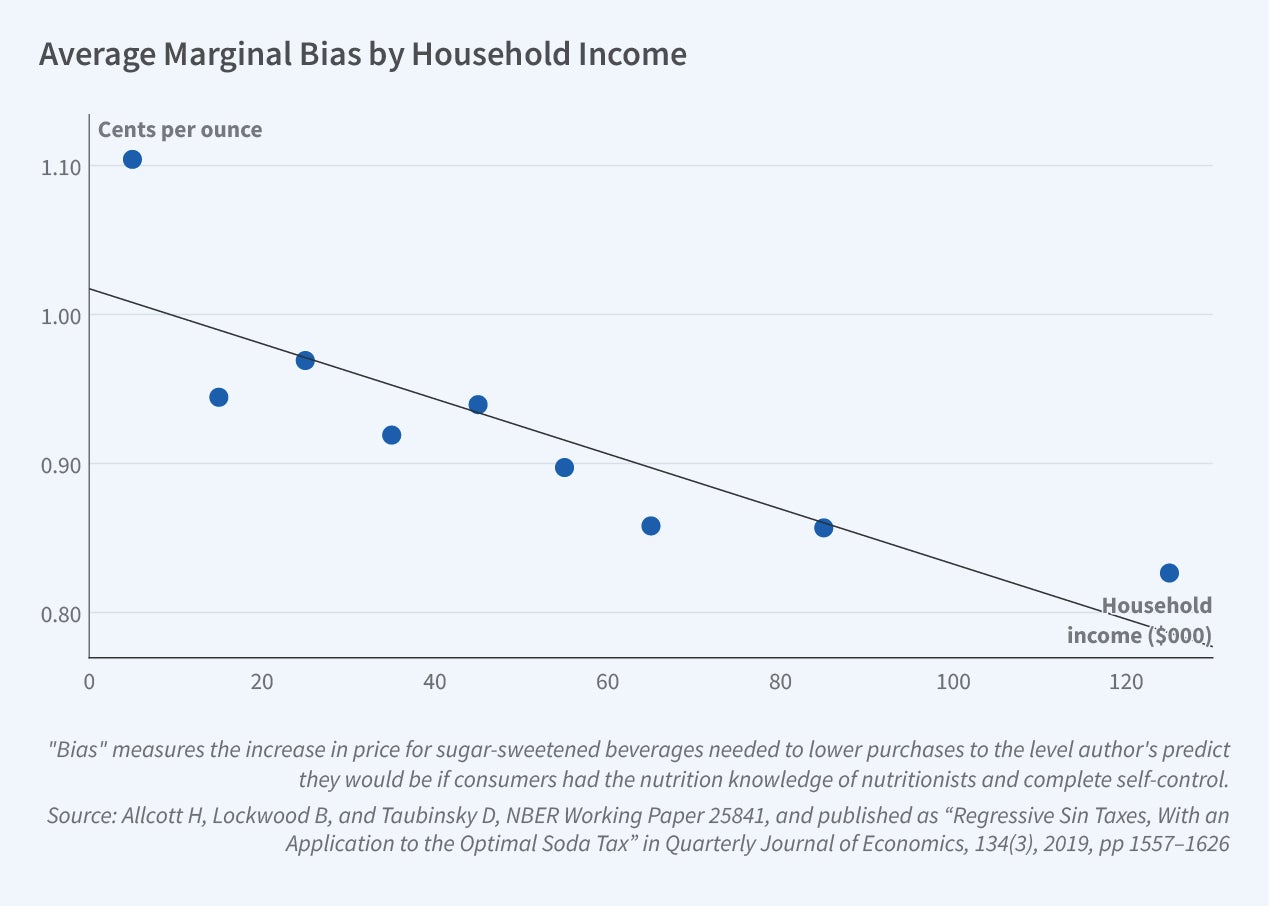
Quantitatively, we find that the lowest-income households overestimate total utility from sugary drinks by about 1.1 cents per ounce, while the highest-income households overestimate utility by about 0.8 cents per ounce. Figure 4 presents our estimates of bias across the income distribution. We also estimate that consumer demand is relatively elastic to sugary drink prices (and thus taxes) but that this elasticity does not vary significantly by income. The fact that lower-income households are more biased but not less elastic implies that the corrective benefits from sugary drinks taxes are progressive.
Finally, we estimate that sugary drinks are a normal good: the causal effect of income on their consumption is positive. This implies that the negative correlation between sugary drink consumption and income is due to differences in preferences and biases. Thus, it is not optimal to fully offset the regressivity of the sugary drinks tax, which lowers its optimal size because of its impact on financial inequality.
We use our theoretical model to take into account all of the empirical facts to determine the optimal sugary drink tax. In our model, the welfare-maximizing tax on sugary drinks in the US is 1 to 2 cents per ounce, which is similar to current tax rates in the seven US cities that have such taxes.7 If, however, taxes were optimized at a more local level and thus were to lead to some cross-border shopping, their optimal size would be somewhat smaller. We find that the average household at all income levels benefits from a sugary drink tax, although higher-income households may benefit more depending on how we quantify behavioral bias.
Application: Energy Efficiency
A second application is to energy efficiency policies such as subsidies for energy-saving appliances and corporate average fuel economy standards. One justification for these policies is that they are second-best substitutes when there are political constraints on pollution taxes. Another is that they act like sin taxes — or their opposite-signed counterparts, “virtue subsidies” — that counteract alleged information asymmetries and behavioral biases.
It has been argued that consumers are poorly informed about or inattentive to electricity costs when buying lightbulbs, causing them to buy too many energy-wasting incandescents rather than more efficient options like compact fluorescents and LEDs. To offset these biases, many governments subsidize energy-saving lightbulbs or ban incandescents. As another example, it is sometimes argued that people buying cars don’t pay sufficient attention to fuel costs, causing them to buy too many gas guzzlers. Fuel economy standards can offset this by forcing automakers to sell more high-fuel-economy vehicles.
We have tested these arguments. In one study, we recruited people shopping for lightbulbs and randomized them into two groups: a treatment group that was given clear information on the electricity costs of different lightbulb technologies and a control group that was not. If lack of information or attention reduces demand for energy-efficient lightbulbs, then the experimental treatment should offset this and increase demand. Across two different experiments, we found some support for this hypothesis, but the effect sizes were not large enough to generate an increase in social surplus from banning incandescent lightbulbs.8
We found qualitatively analogous results in our work on fuel economy. Consumers do not appear to pay full attention to gasoline costs, and in our field experiment we found that providing fuel economy information had no effect on vehicle purchases.9 A large body of excellent work by other scholars finds similarly mixed results. In one model we developed, the estimated impacts of fuel economy standards are not large enough to increase social surplus.10
Application: State-Run Lotteries
A final application is to state-run lotteries.11 Such lotteries are subject to an implicit tax because a portion of each ticket’s purchase price is retained by the government rather than being distributed to consumers through prizes. The economic principles are thus similar to those of other sin tax applications but they are applied to the general case where the government can differentially tax various characteristics of the sin good.
Do these revenue-generating lotteries raise total welfare? As with the other applications, there are two sides to the debate. On the one hand, state-run lotteries might be a “win-win” that increases both state budgets and consumer surplus if consumers’ decisions to buy lottery tickets are not affected by behavioral biases. Although these lotteries typically have negative expected monetary value, consumers might still rationally buy them either for entertainment value or because they generate anticipatory utility from the possibility of winning. On the other hand, if consumer demand is primarily driven by behavioral biases such as overconfidence, self-control problems, or innumeracy, then these lotteries may be welfare reducing, particularly if both lottery demand and biases are disproportionately concentrated among lower-income people.
Empirically, we find that purchasing lottery tickets is associated with survey measures of innumeracy, poor statistical reasoning, and other proxies for behavioral bias. Collectively, these proxies explain 43 percent of lottery purchases. As with sugary drinks, these biases seem to be concentrated among lower-income people. However, since lottery tickets are cheap — the administrative costs are modest and about 30 percent of proceeds go to states for education and other programs — there is a trade-off between overconsumption due to bias, normatively respectable consumer surplus, and government revenues. In our model, the current designs of the large multistate lotto games increase welfare overall although they may harm heavy spenders.
Endnotes
The Economics of Welfare, Pigou A. London: Macmillan and Co., 1920.
“Energy Policy with Externalities and Internalities,” Allcott H, Mullainathan S, Taubinsky D. NBER Working Paper 17977, January 2014, and Journal of Public Economics 112, April 2014, pp. 72–88.
“Optimal Sin Taxes,” O’Donoghue T, Rabin M. Journal of Public Economics 90(10-11), November 2006, pp. 1825–1849.
“Regressive Sin Taxes, with an Application to the Optimal Soda Tax,” Allcott H, Lockwood B, Taubinsky D. NBER Working Paper 25841, May 2019, and The Q uarterly Journal of Economics 134(3), August 2019, pp. 1557–1626.
“Sufficient Statistics for Nonlinear Tax Systems with General Across-Income Heterogeneity,” Ferey A, Lockwood B, Taubinsky D. NBER Working Paper 29582, April 2022.
“Should We Tax Sugar-Sweetened Beverages? An Overview of Theory and Evidence,” Allcott H, Lockwood B, Taubinsky D. NBER Working Paper 25842, May 2019, and Journal of Economic Perspectives 33(3), Summer 2019, pp. 202–227.
“State and Local Backgrounders: Soda Taxes.” Urban Institute, March 2022.
“The Lightbulb Paradox: Evidence from Two Randomized Experiments,” Allcott H, Taubinsky D. NBER Working Paper 19713, August 2014. Published as “Evaluating Behaviorally Motivated Policy: Experimental Evidence from the Lightbulb Market,” American Economic Review 105(8), August 2015, pp. 2501–2538.
“Are Consumers Poorly Informed about Fuel Economy? Evidence from Two Experiments,” Allcott H, Knittel C. NBER Working Paper 23076, February 2018, and American Economic Journal: Economic Policy 11(1), February 2019, pp. 1–37.
“Gasoline Prices, Fuel Economy, and the Energy Paradox,” Allcott H, Knittel C. NBER Working Paper 18583, November 2012, and Review of Economics and Statistics 96(5), December 2014, pp. 779–795.
Return to Text
“What Drives Demand for State-Run Lotteries? Evidence and Welfare Implications,” Lockwood B, Allcott H, Taubinsky D, Sial A. NBER Working Paper 28975, March 2022.


