Impact of New York City’s Congestion Pricing Program
In January 2025, New York City (NYC) implemented the first cordon-based congestion pricing program in the United States. The program levies charges on vehicles entering Manhattan’s central business district (CBD) during peak hours, 5 am–9 pm on weekdays and 9 am–9 pm on weekends. Passenger vehicles pay $9 each day they enter during peak hours, motorcycles pay $4.50, and trucks and buses pay between $14.40 and $21.60, depending on their size. For-hire vehicles are charged on a per-trip basis: $0.75 for taxi trips and $1.50 for rideshare trips that start, end, or pass through the CBD. In The Short-Run Effects of Congestion Pricing in New York City (NBER Working Paper 33584), Cody Cook, Aboudy Kreidieh, Shoshana Vasserman, Hunt Allcott, Neha Arora, Freek van Sambeek, Andrew Tomkins, and Eray Turkel evaluate the policy’s initial impacts on traffic conditions, travel times, and vehicle emissions.
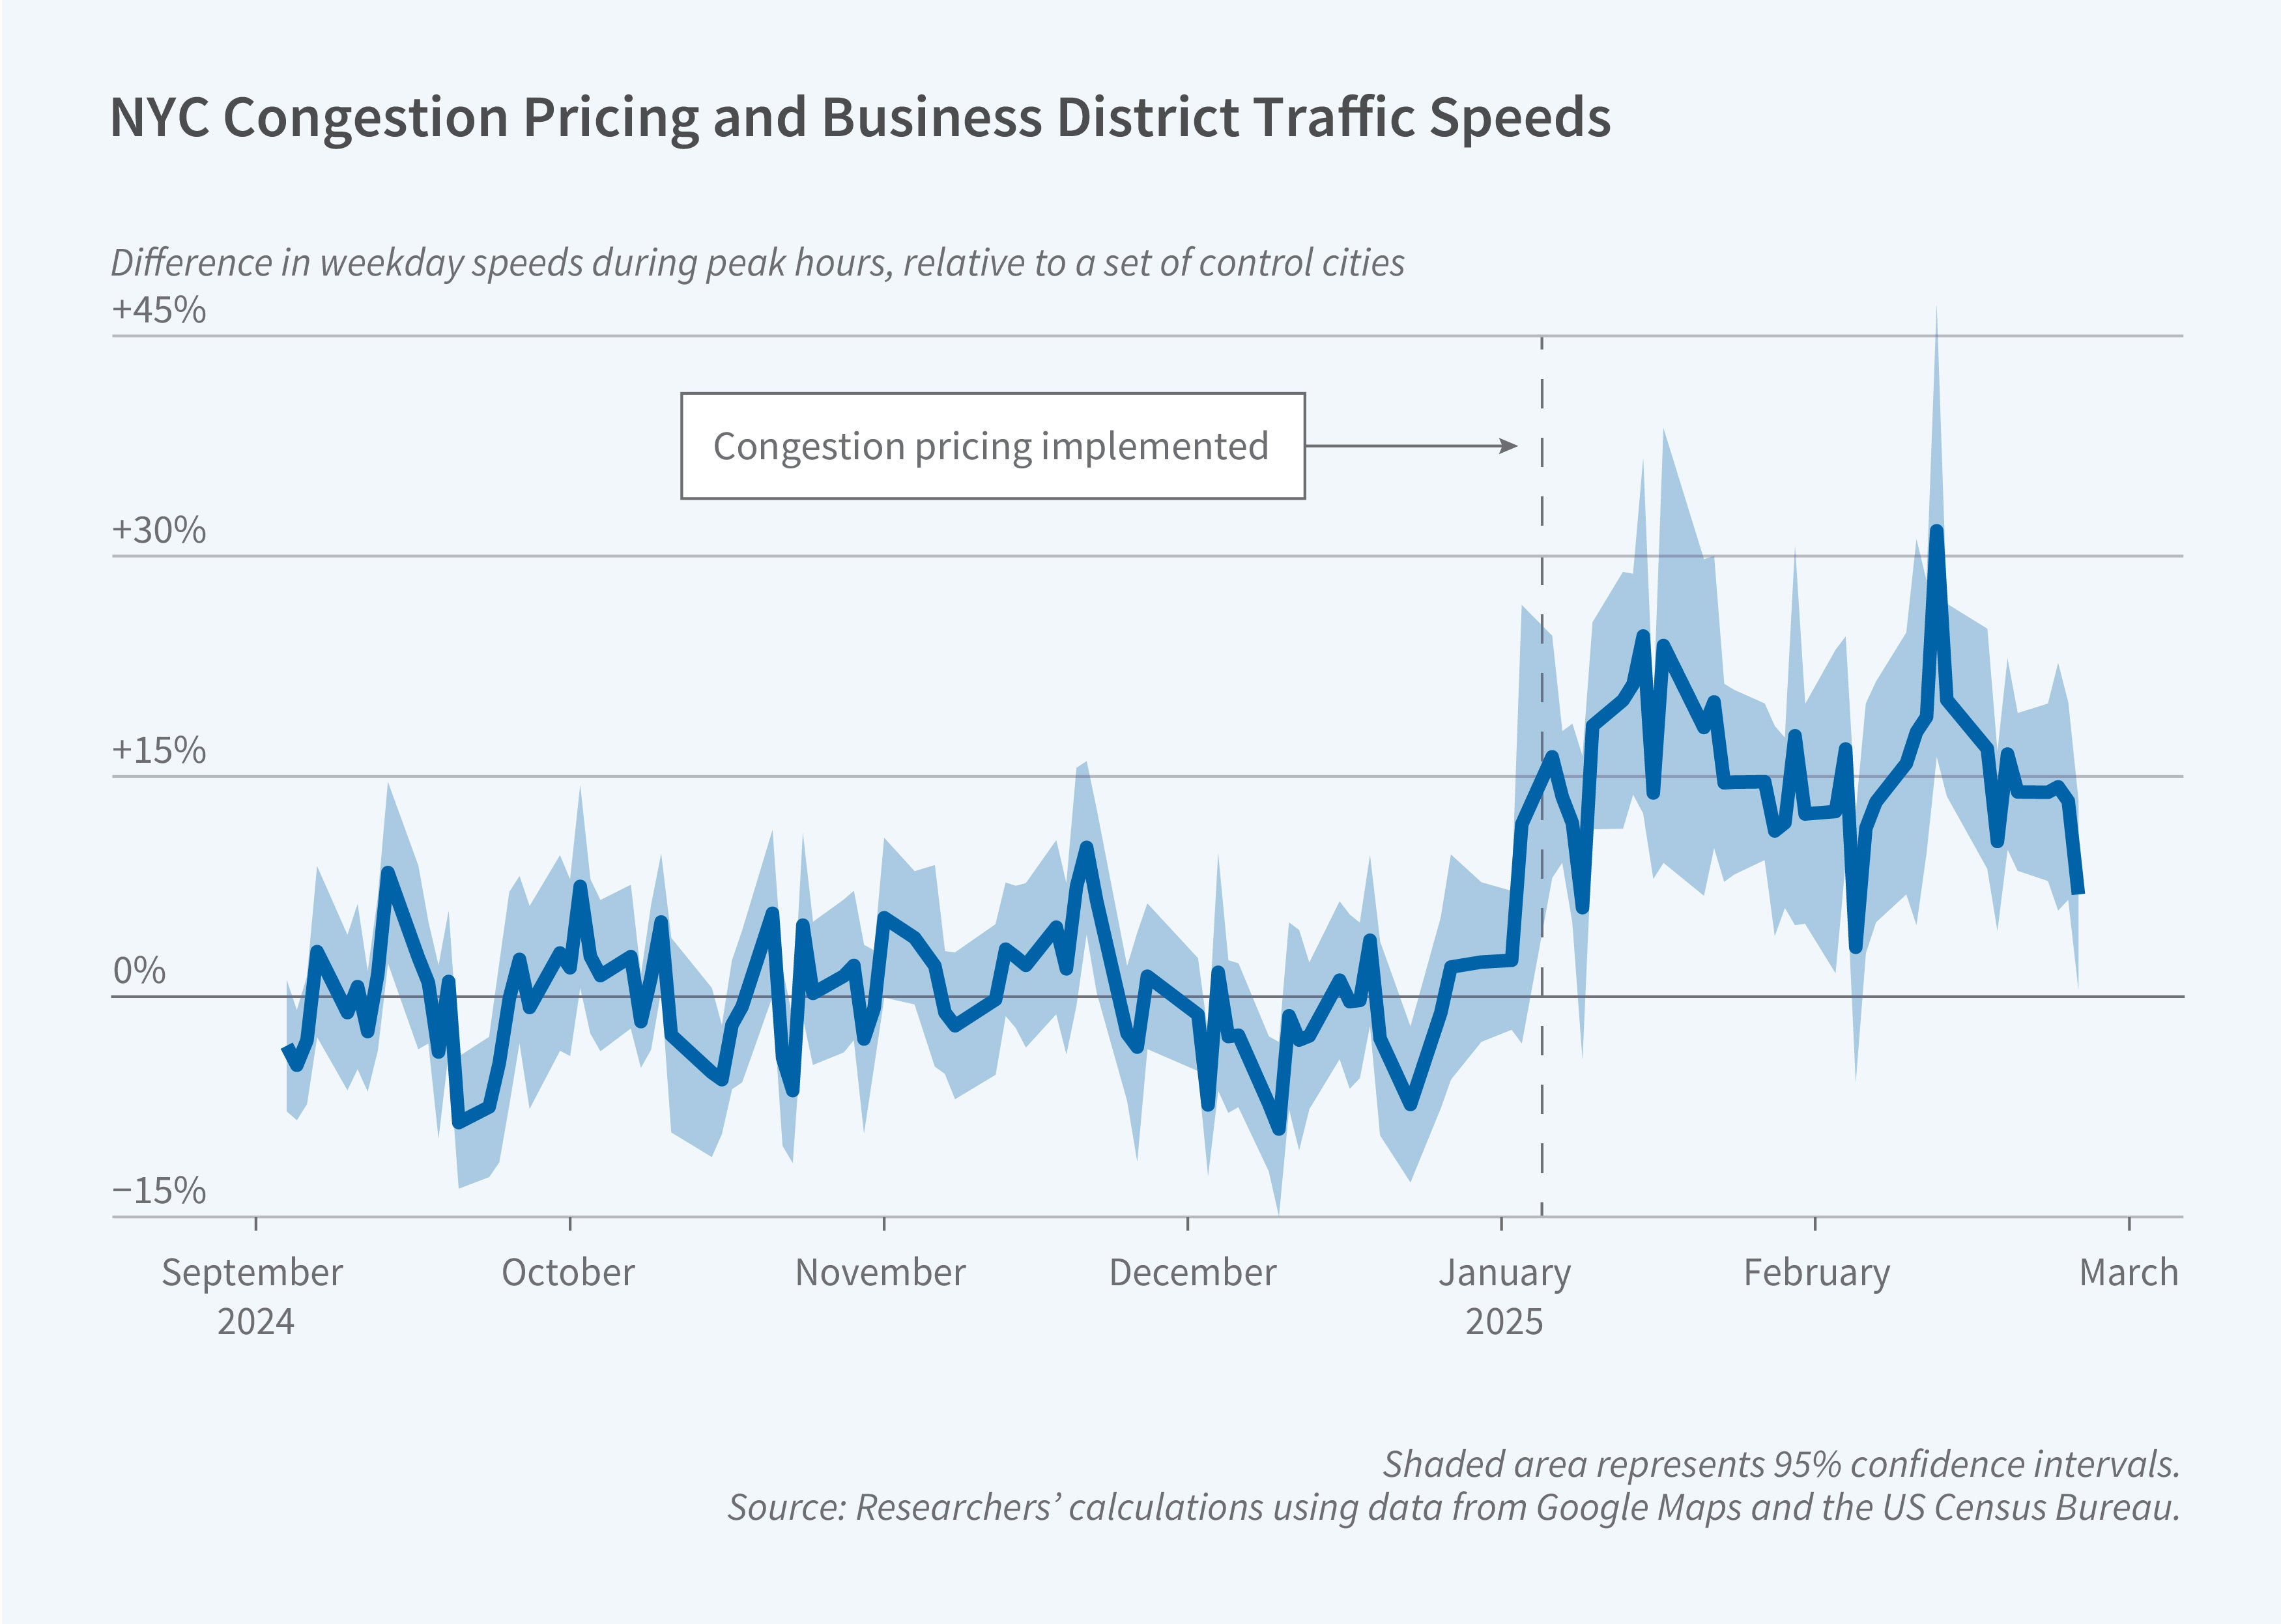
The researchers analyze data from Google Maps Traffic Trends spanning September 2024 through February 2025 and compare NYC’s traffic conditions to those of five similar cities: Philadelphia, Boston, Chicago, Atlanta, and Baltimore. They find that average speeds within the CBD increased from 8.2 to 9.7 mph following the implementation of the congestion charge, a 15 percent jump. These improvements were most pronounced during congested periods, with increases exceeding 20 percent during weekday afternoons between 1 pm and 7 pm and 25 percent during weekend evenings between 3 pm and 9 pm. The effects varied by road type, with highways experiencing 13 percent faster speeds, arterial roads 10 percent, and local roads 8 percent.
The benefits extended beyond the tolled zone, particularly to roads where a high percentage of drivers traversing the segment prior to the congestion pricing policy eventually entered the CBD (defined as a segment’s “co-occurrence” with the CBD). Road segments outside the CBD with co-occurrence over 80 percent—such as the Lincoln Tunnel and the Holland Tunnel—experienced a 16 percent increase in average speeds. Even on road segments with co-occurrence of under 20 percent, the implementation of congestion pricing increased average speeds by 4 percent. The improvement on different road segments depends, in part, on the level of congestion before the fee took effect. For example, while the Queensboro Bridge and Holland Tunnel experienced similar changes in traffic levels following the policy’s implementation, the change in speeds was 5 mph larger on the Queensboro Bridge. Prior to the policy’s implementation, the Queensboro Bridge was operating on a steep part of its “congestion function,” where even small changes in the number of cars can have large impacts on speeds.
The changes in road speeds translated to shorter total travel times for drivers. Car trips within or to the CBD became approximately 8 percent faster, while trips from the CBD to outside areas increased in speed by 2.5 percent. For a hypothetical commuter, this could result in an annual saving of more than 10 hours per year.
CO2 emission rates per kilometer driven decreased by 2–3 percent for vehicles traveling in the CBD and on roads with high co-occurrence. However, the study did not find any statistically significant effect on ambient PM2.5 concentrations.
— Leonardo Vasquez


