Real Estate Values in the Time of COVID
Real estate values capture the agglomeration benefits tied to the area where properties are located. Improvements to these locations, for example infrastructure investments, increase real estate values. Conversely, these values are vulnerable to reductions in local economic activity. My recent research uses changes in real estate values to measure the location-specific impact of the pandemic and to evaluate location-improving policies.
One branch of this work focuses on how the pandemic has affected residential real estate markets in US metropolitan areas. Arpit Gupta, Vrinda Mittal, Jonas Peeters, and I document the exodus from urban centers to suburban locations at the start of the pandemic.1 Using cellphone ping data to determine location of residence, we find large outmigration from urban centers into suburban locations between late February and late March 2020. While cellphone data are suitable for measuring higher-frequency mobility, change-of-address data may be more appropriate for tracking persistent relocation. Data from Infutor confirm that outmigration rates were high from urban cores and low in the suburbs.
Not only did households move within metropolitan areas, they also moved between them. Data from the US Census Bureau, the Postal Service, and interstate moving companies reveal migration from large coastal metropolitan areas to smaller, lower-density cities and to nonmetropolitan areas. For example, cities with population above 1 million lost 0.16 percent of their population between July 2020 and July 2021, while smaller metropolitan areas grew 0.6 percent faster than before the pandemic and nonmetropolitan areas grew 0.25 percent faster, reversing a decade of shrinkage.2
Outmigration rates from a city rose with the share of its jobs that could be done remotely, as measured by a teleworkability score as well as the initial level of rents and house prices.3
Before the pandemic, there was a higher price and rent premium for properties closer to the central business district (CBD) of a metropolitan area. However, over the course of 2020, this pattern was attenuated: rents and house prices increased substantially more in suburban than in urban areas. For rents, the premium for proximity to the CBD disappeared. The urban land gradient for rents, the difference between suburban and center-city rents, is plotted in Figure 1. It changed from negative — lower prices farther from the center — to zero. The gradient also increased for house prices, but not by as much as for rents.
To identify the determinants of these changes in the rent and price gradients, we used the cross-section of metropolitan statistical areas and ZIP codes. We find that the ability to work from home was the key driver of this change, more so than the restrictions COVID policies placed on the use of urban amenities.
What do the relative changes in urban-minus-suburban house prices and rents over the course of 2020 imply for the future evolution of rents? We use a present-value model inspired by previous work by John Y. Campbell and Robert J. Shiller to infer the market’s expectations about future rent growth.4 This inference depends on how persistent housing market participants believe pandemic-induced changes will be. We estimate this perceived persistence parameter using survey data from Pulsenomics. Informed by these data, the model predicts a substantial rebound in urban relative to suburban rents.
A related paper in this research agenda explores the impact of remote work on office valuations. Commercial real estate is a significant asset class that features prominently in the portfolios of pension funds and other large institutions. Commercial mortgages are important assets on the balance sheets of banks, especially medium-sized ones. Office buildings represent the largest share of these exposures. Gupta, Mittal, and I investigate what impact remote work has had and is likely to have on office valuations.5
Office valuations are not easily extracted from market prices. While a limited number of office buildings are owned by publicly listed real estate investment trusts (REITs), the vast majority are privately held. Moreover, REITs specialize in the highest-quality segment of the market. Given minimal trade in average-quality private office assets since the onset of COVID-19, the valuation question does not have an easy answer.
We first analyze the cash flow shock to leasing revenues between the end of 2019 and May 2022. Using data from CompStak, we find an average 17 percent reduction in rent revenues from active leases across 105 office markets in the US, as well as much larger reductions in the number of newly signed leases, from 250 million square feet per year to about 60 million. The rent on newly signed leases also fell substantially in 2020 before partially rebounding in 2021. With fewer leases being signed than are coming to an end, contractual occupancy rates in the office market have fallen to record lows. For example, the contractual office occupancy rate in San Francisco fell from 94.6 percent in the fourth quarter of 2019 to 77 percent in the third quarter of 2022.
These numbers understate the size of the shock for two reasons. First, physical occupancy is far lower than contractual occupancy. Only about 50 percent of employees go to the office on a typical day.6 Second, because of the long-term nature of office leases, about two-thirds of office users have not had to make active space decisions yet. A large percentage of prepandemic leases will come up for renewal in the next few years, at a time of high vacancy and low market rents.
We estimate the connection between remote work practices and office demand. Using the fraction of job postings that are for remote positions as well as corporate announcements about remote work policies — in person, hybrid, or fully remote, as well as the number of days employees are required to be on site — we find much larger reductions in office space demand among tenants that do more work remotely. This is illustrated in Figure 2.
We then build an asset-pricing model to value office buildings, recognizing that buildings are portfolios of overlapping long-term leases. The model also prices the risk facing office building investors, part of which is from traditional business cycle fluctuations in tenant office demand, market rents, and new office supply, and part of which is due to new factors such as the risk of persistent changes in work from home (WFH) practices.
We use the 2020 stock return of office REITs to infer, through the lens of the model, the persistence of remote work. This inference accounts for the fact that REITs hold the highest-quality assets, whose cash flows, we show, are more resilient to the pandemic shock — a “flight-to-quality” effect. We find an annual persistence parameter of 82 percent for the WFH regime. We calibrate the model to New York City (NYC) and solve for office valuation as a function of the state variables.
We use the model to simulate the evolution of office values as the economy transitions from a no-WFH expansion state in 2019 to a WFH recession state in 2020 to a WFH expansion state in 2021. We assume that the economy evolves stochastically after 2021. There are some future paths in which in-person work returns as the dominant form of work, and others in which remote work persists for years.
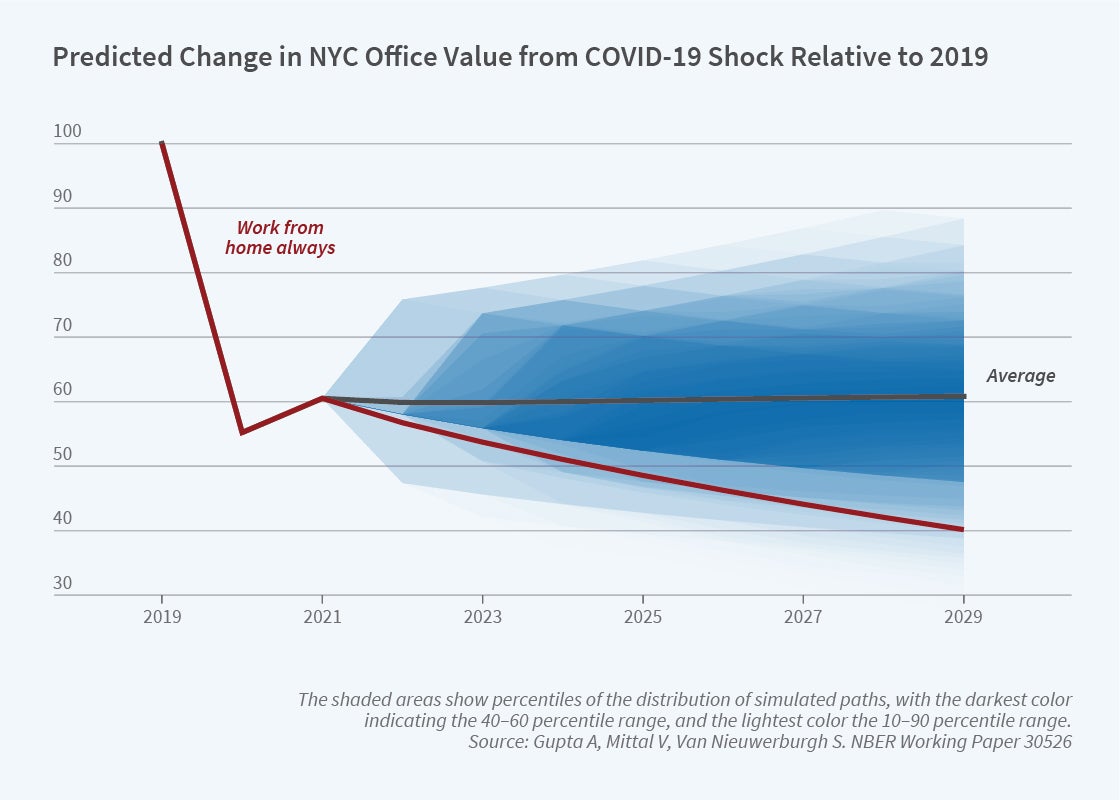
These simulations, shown in Figure 3, predict that the value of the entire NYC office stock should have fallen in value by 45 percent in 2020. They also predict that 10 years after the COVID shock, office values will remain, on average, about 39 percent below the valuation in 2019. On the path that assumes that the economy stays in the WFH state for at least 10 years, office values are nearly 60 percent lower in 2029 than in 2019. Our model also quantifies the uncertainty around the baseline estimates. The shaded areas show the range of possible scenarios, with darker colors representing more likely ones.
There is variation across cities in our estimated COVID-19 impact on the price of office buildings. NYC is not an outlier; nationally, we estimate value destruction of $414 billion.
A loss of this magnitude would have severe consequences for real estate equity investors and could even affect debt values. This raises the specter of financial fragility for those banks with concentrated exposure to office loans. Declining commercial property values would also imply negative effects on local public finances since cities derive a substantial portion of tax revenue from property taxes on office buildings and urban retail real estate. Urban retailers have been at least as severely impacted by remote work as urban office building owners. To offset a revenue shortfall, cities would need to raise taxes or cut spending on local public goods. The latter strategy would reduce the quality of life in the city. Both possibilities risk outmigration, especially with remote work making it easier for residents to move. An “urban doom loop” of fiscal shortfalls, lower quality of life, and outmigration might ensue. This possibility might be judged to justify policy intervention.
The COVID era and the rise of WFH have raised difficult questions for real estate and urban economists. Questions about how remote work affects individual productivity, innovation, organizational culture, the climate, and other aspects of life are being actively explored across many fields of economics. I summarize this literature and discuss potential policy responses in a recent review article.7
The connection between real estate values and location policy also features in decisions about infrastructure spending in dense urban areas. Gupta, Kontokosta, and I focus on the expansion of the Second Avenue subway — the Q train — in New York City.8 This project cost $4.5 billion to build. Was it worth it?
We use the change in house prices to extract a market-based measure of value creation. We find 8 percent price increases in the neighborhood newly served by the subway line, creating $6 billion in new property value. Figure 4 shows the change in house prices relative to the pre-2004 period. This estimate comes from various difference-in-difference estimation designs that are robust to exactly how the treatment and control areas are defined, and the timing of the before and after periods.
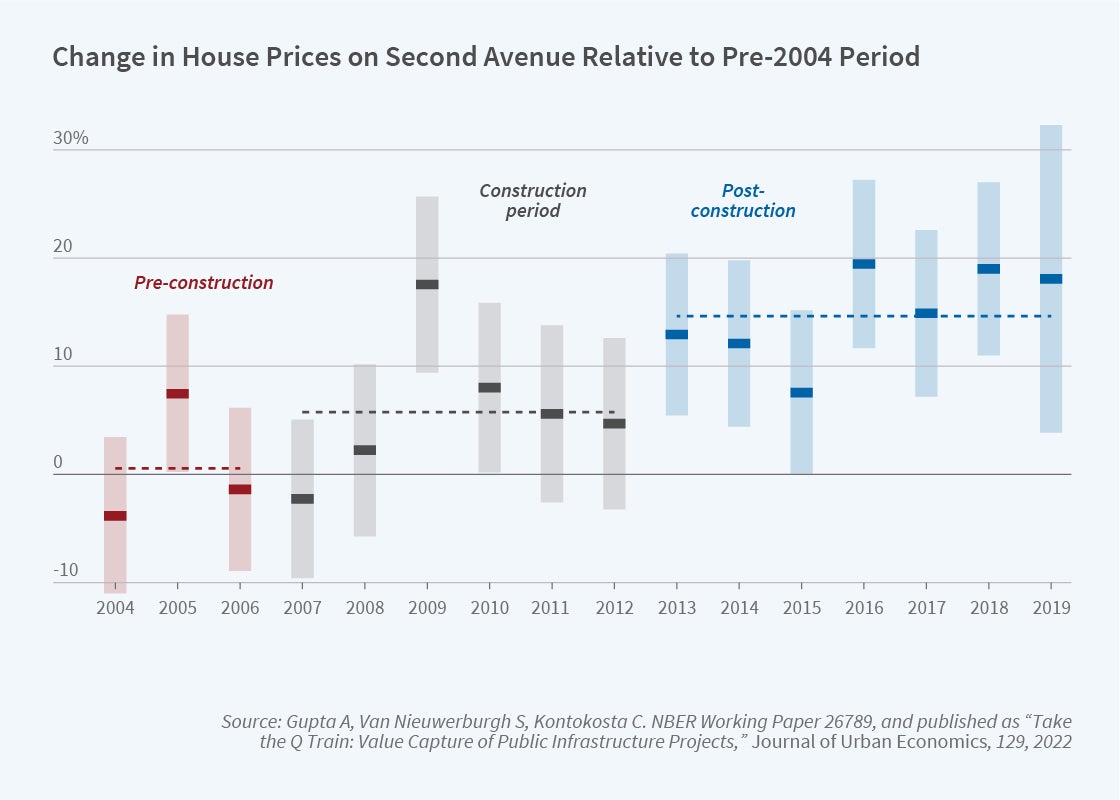
Using cellphone ping data to measure subway commuting times, we also show that they shorten, which is one plausible mechanism of value creation.
We estimate that while the overall real estate value created by the subway expansion exceeded the cost of construction, only about 30 percent of the benefit flows back to the government in the form of a higher present discounted value of property tax revenues. The remainder accrues to the private sector. But the fact that the investment created so much value suggests that there must be fiscal tools which might extract more of this value to finance large urban infrastructure projects.
Endnotes
“Flattening the Curve: Pandemic-Induced Revaluation of Urban Real Estate,” Gupta A, Mittal V, Peeters J, Van Nieuwerburgh S. NBER Working Paper 28675, April 2021, and Journal of Financial Economics 146(2), November 2022, pp. 594-636.
“New Census data shows a huge spike in movement out of big metro areas during the pandemic,” Frey W. Brookings Institution, The Avenue blog post, April 14, 2022.
“How Many Jobs Can Be Done at Home?” Dingel J, Neiman B. Journal of Public Economics 189, September 2020, Article 104235.
“The Dividend-Price Ratio and Expectations of Future Dividends and Discount Factors,” Campbell J, Shiller R. Review of Financial Studies 1(3), July 1988, pp. 195–228.
“Work from Home and the Office Real Estate Apocalypse,” Gupta A, Mittal V, Van Nieuwerburgh S. NBER Working Paper 30526, September 2022.
“Why Working from Home Will Stick,” Barrero J, Bloom N, Davis S. NBER Working Paper 28731, April 2021.
“The Remote Work Revolution: Impact on Real Estate Values and the Urban Environment,” Van Nieuwerburgh S. NBER Working Paper 30662, November 2022.
“Take the Q Train: Value Capture of Public Infrastructure Projects,” Gupta A, Van Nieuwerburgh S, Kontokosta C. NBER Working Paper 26789, August 2020, and Journal of Urban Economics 129, May 2022, Article 103422.


