Inflation Dynamics during COVID-19
For over a decade, my research has explored the use of high-frequency microdata to measure inflation and other economic statistics in real time in an effort to make academic macroeconomic research more timely and useful for policymakers. The COVID-19 pandemic has provided a unique opportunity to test this methodology, particularly around the topic of inflation. After the crisis started, the United States experienced a relatively small decline in inflation in 2020, followed by a sudden surge in prices in early 2021. Understanding these inflation dynamics has been the focus of my recent papers. In particular, I studied the impact of COVID-related consumer price index (CPI) measurement distortions and supply disruptions, both of which can be quantified with new sources of high-frequency microdata.
Measurement Distortions with CPI Basket Weights
Early in the pandemic, W. Erwin Diewert and Kevin J. Fox warned that the standard fixed-basket-of-goods approach used by CPIs, which relies on category weights updated infrequently with lagged expenditure data, could introduce significant measurement bias.1 In the US, CPI weights were last updated in December 2019, shortly before the pandemic dramatically changed consumer spending patterns. To quantify the extent of this basket bias, I relied on the work of Raj Chetty, John N. Friedman, Nathaniel Hendren, Michael Stepner, and the Opportunity Insights Team, who publish real-time consumer spending patterns based on credit and debit card transactions.2 Using their high-frequency data, I updated the official CPI basket weights on a monthly basis, and combined them with CPIs for various categories of goods to compute an alternative index that can approximate the inflation rate of a COVID-adjusted consumption basket.3
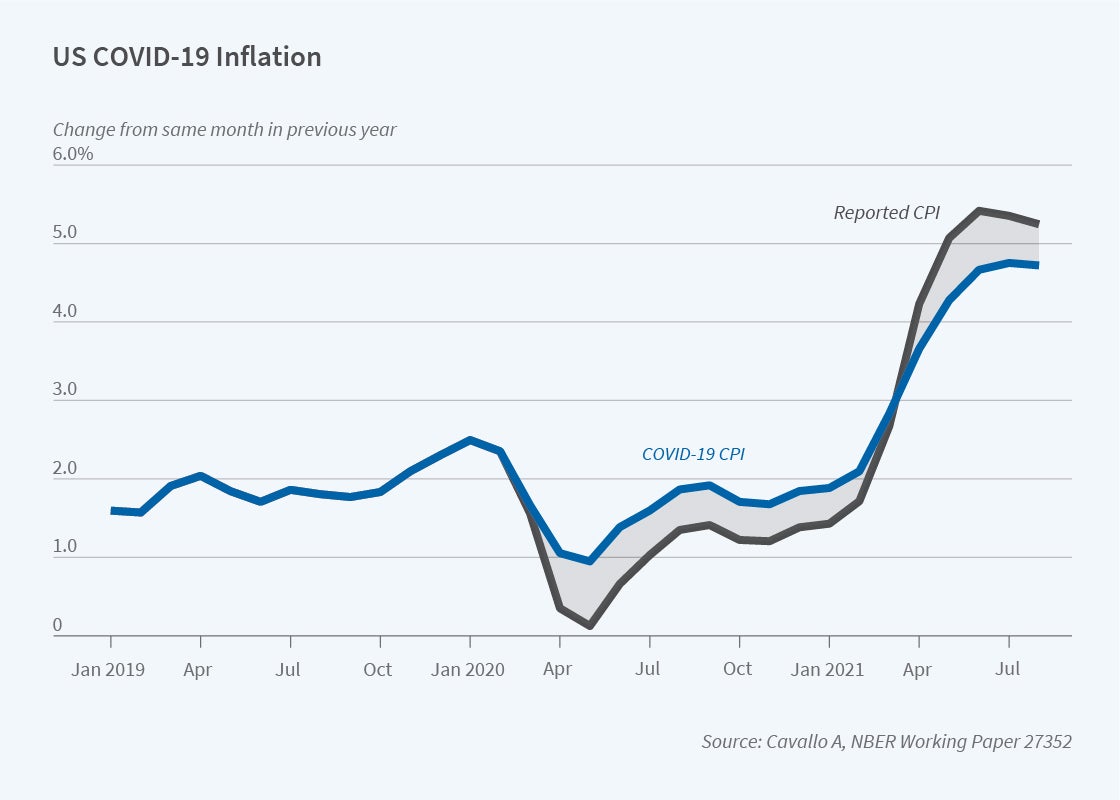
With this “COVID CPI,” I found that the annual CPI inflation rate in the US was significantly underestimated in 2020, as shown in Figure 1. This was because there was too much weight given to Transportation, a category initially experiencing deflation, and too little weight on Food at Home, where prices were rising. The distortion extended to the core CPI because non-energy transportation categories were impacted, as well as to the PCE (Personal Consumption Expenditures) Price Index, which has a chaining methodology that only partially adjusted to the sudden changes in consumer expenditure patterns.
The CPI basket distortion is temporary, but it is still affecting the annual inflation rate in mid-2021. In fact, US annual inflation is now being overestimated by about 0.7 percentage points. There are two reasons for this. First, the CPI was still placing too much weight on Transportation during the first half of 2021, a time when CPI categories such as Used Cars and Trucks experienced particularly strong increases in prices. Second, the base effects in the annual inflation calculation are larger than they would have been if the CPI basket had been adjusted. The base effects occur because the annual rate compares prices today to those 12 months ago. The fact that the CPI was underestimated in the second quarter of 2020 means that the annual inflation rate is higher in mid-2021.
Supply Disruptions and Product Shortages
Temporary measurement distortions only partially explain why the inflation rate is higher today. An even more important driver of recent inflation is the persistence of COVID-related supply disruptions, which can be seen in the increase in product shortages. Indeed, the rise in product stockouts has been a defining characteristic of the pandemic, and although frequently mentioned in media and policy reports, so far there has been little empirical analysis of its impact on inflation.4
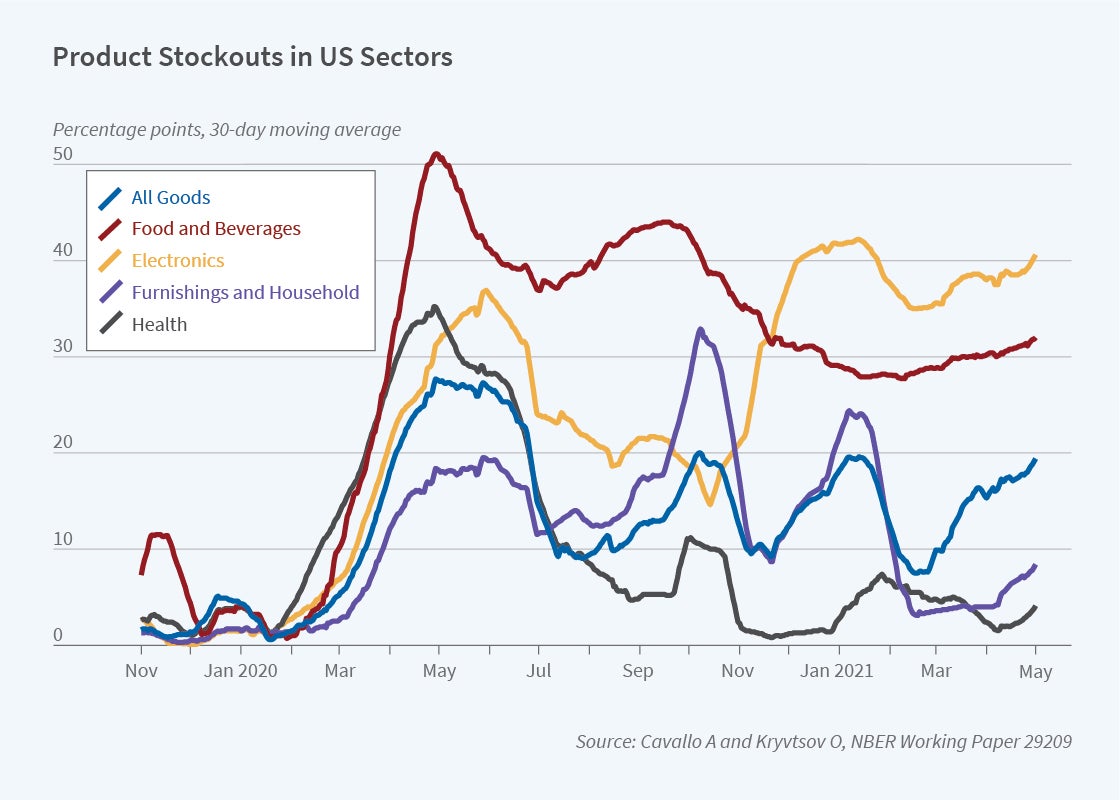
I provide direct evidence in joint work with Oleksiy Kryvtsov using microdata collected online to construct a high-frequency measure of product shortages in a wide range of consumer products.5 We focus not just on out-of-stock signals that are visible to consumers, but also on the higher incidence of discontinued goods, which are harder to detect. Our stockout measures, shown in Figure 2, prove that shortages were widespread early on in the pandemic, affecting far more than just toilet paper and disinfecting wipes. Over time, the composition of shortages evolved from many “temporary” stockouts to mostly discontinued goods, or permanent stockouts, concentrated in fewer sectors. By early May 2021, US stockouts showed signs of improvement in some categories, but remained near record levels for Food and Beverages and Electronics.
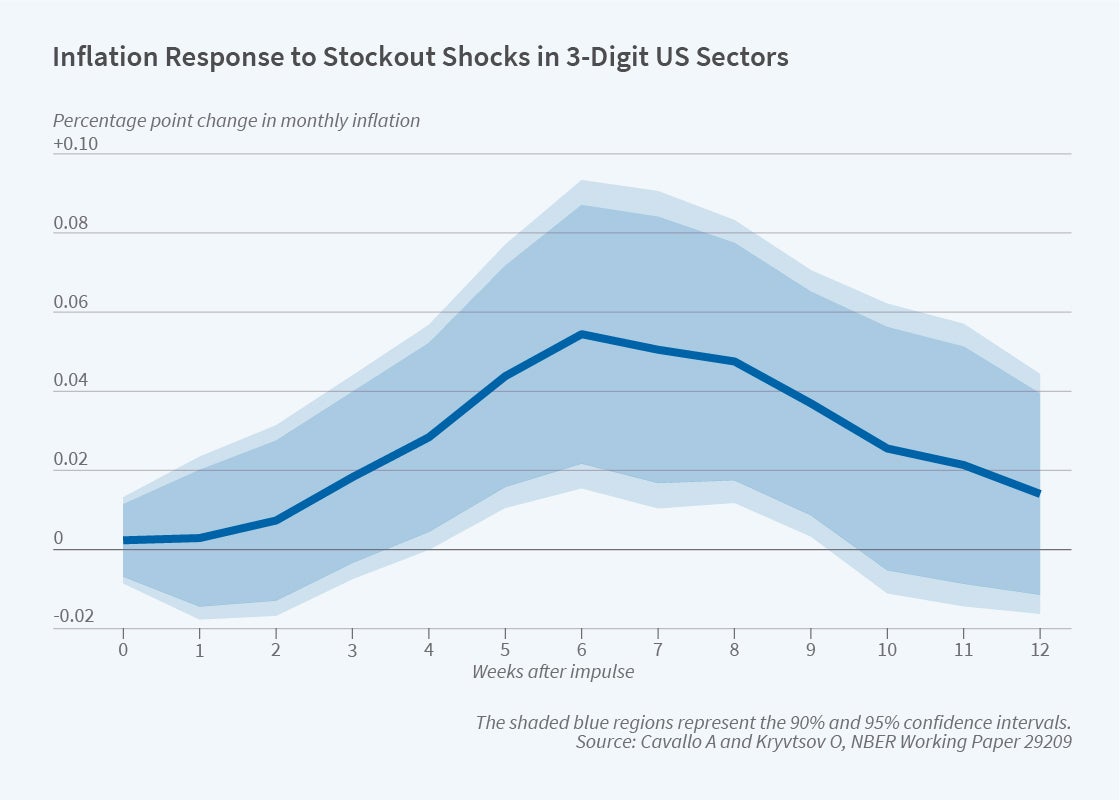
Combining these stockout measures with micro price data, we find that their impact on inflation is significant, gradual, and transitory. This can be seen in Figure 3, which shows the estimated response of monthly inflation to a stockout shock. Our estimates imply, for example, that an increase in the stockout rate from 10 percent to 20 percent would bring about a 0.10 percentage point increase in the monthly inflation rate within two months. The impact rises gradually after two weeks, peaks around six weeks, and dissipates after three months. We find a similar response when we focus only on temporary stockout shocks, which were more significant at the beginning of the pandemic, suggesting that shortages have been putting upward pressure on prices all along, even though the effects were harder to detect with aggregate statistics when demand was falling. Furthermore, in previous work6 I showed that online and offline prices are similar for large US retailers, which suggests that the inflation effects likely extend to brick-and-mortar store prices as well.
These results are also qualitatively similar when the shock is measured using a model-based estimation of the underlying replacement cost. To show this, we develop a model of a monopolistic firm with inventories and use it to derive an empirical specification for estimating the costs behind the observed dynamics of stockouts and prices at a sector level. We then construct empirical responses of inflation to the estimated cost shocks, and find that accounting for the endogeneity of stockouts makes the inflationary effects stronger immediately after the shocks, but also more transitory.
This estimated cost pass-through into retail prices is relatively quick when compared to that of other recent shocks, such as the rise in tariffs during the US-China trade war. For example, Gita Gopinath, Brent Neiman, Jenny Tang, and I showed in 2019 that the tariffs on Chinese goods had limited short-run effects on consumer prices.7 We found evidence of other margins of adjustment, such as front-running of inventories and trade diversion, which were not possible in the pandemic, but also some evidence that retailers delayed the pass-through because they expected the tariffs to be temporary. We speculated that if the shock had remained for much longer, pressure on these retailers would likely have risen and the pass-through into consumer prices would have increased. Consistent with this hypothesis, in the more recent COVID stockouts paper we found that the impact on inflation is higher in sectors where the stockouts have been particularly persistent, such as Food and Electronics. This result also applies at the country level, with the US, Canada, and Germany having both more persistent stockouts and also the largest impacts on annual inflation rates.
Another explanation for the quick retail pass-through is that the COVID crisis moved a large share of transactions online. In a 2018 paper prepared for the Federal Reserve Bank of Kansas City’s Economic Policy Symposium in Jackson Hole, I showed that large traditional retailers competing with online firms tend to adjust their prices more frequently and have more uniform prices across locations.8 This makes their prices react faster to national-level cost shocks. I argued that retail prices are becoming less insulated and that as online transactions increase any other shock that may enter the pricing algorithms used by large retailers is more likely to have a larger impact on retail prices than in the past. This is precisely the type of shock caused by COVID supply disruptions.
Looking Ahead
Overall, my recent research suggests that temporary factors, such as measurement distortions and supply disruptions, are an important driver of inflation at this stage of the pandemic. However, high-frequency online inflation indices, based on a methodology I started developing in my PhD thesis over a decade ago,9 continue to show that inflationary pressures are abnormally high in the US, with monthly rates above 10-year averages for the past 11 months.10
Whether inflation remains high will depend on how COVID-related supply and demand shocks evolve moving forward. But this is certain: the pandemic has highlighted the importance of high-frequency data for economic measurement during times of crisis. It has dramatically accelerated the use of online data collection at the Bureau of Labor Statistics and other statistical agencies, and could potentially lead to other changes in practice, such as an increase in the frequency of expenditure surveys and the updating of CPI weights.11 These changes would provide a more detailed and less distorted picture of inflation during times of crisis. More importantly, the development and growing availability of new microdata will continue to improve our understanding of the mechanisms affecting inflation dynamics in the future.
Alberto Cavallo is a cofounder of, and has an ownership stake in, PriceStats LLC, a private company that uses online data to compute inflation indices. He is also an unpaid member of the Technical Advisory Committee of the US Bureau of Labor Statistics, where he provides advice on various issues, including the use of online data in the construction of consumer price indexes and other statistics.
Endnotes
“Measuring Real Consumption and CPI Bias under Lockdown Conditions,” Diewert WE, Fox K. NBER Working Paper 27144, May 2020.
“The Economic Impacts of COVID-19: Evidence from a New Public Database Built Using Private Sector Data,” Chetty R, Friedman J, Hendren N, Stepner M, Opportunity Insights Team. NBER Working Paper 27431, June 2020.
“Inflation with COVID Consumption Baskets,” Cavallo A. NBER Working Paper 27352, June 2020.
“Pandemic Prices: Assessing Inflation in the Months and Years Ahead,” Bernstein J, Tedeschi E. Council of Economic Advisers, April 12, 2021.
“What Can Stockouts Tell Us about Inflation? Evidence from Online Micro Data,” Cavallo A, Kryvtsov O. NBER Working Paper 29209, September 2021.
“Are Online and Offline Prices Similar? Evidence from Large Multi-Channel Retailers,” Cavallo A. NBER Working Paper 22142, April 2016, and American Economic Review 107(1), January 2017, pp. 283–303.
“Tariff Pass-Through at the Border and at the Store: Evidence from US Trade Policy,” Cavallo A, Gopinath G, Neiman B, Tang J. NBER Working Paper 26396, October 2019, and American Economic Review: Insights 3(1), March 2021, pp. 19–34.
“More Amazon Effects: Online Competition and Pricing Behaviors,” Cavallo A. NBER Working Paper 25138, October 2018, and presented at Changing Market Structures and Implications for Monetary Policy, Jackson Hole Economic Policy Symposium, Jackson Hole, Wyoming, August 23–25, 2018.
“Online and Official Price Indexes: Measuring Argentina’s Inflation,” Cavallo A. Journal of Monetary Economics 60(2), March 2013, pp. 152–165.
“COVID Inflation: Evidence from Real-Time Data,” Cavallo A. Princeton University Bendheim Center for Finance, Markus Academy Series, June 17, 2021.
“Effects of COVID-19 Pandemic and Response on the Consumer Price Index,” US Bureau of Labor Statistics, accessed September 1, 2021.


