The Shrinking Universe of Public Firms: Facts, Causes, and Consequences
There are fewer firms listed on U.S. exchanges than 40 years ago. In 1976, the United States had 4,943 firms listed on exchanges. By 2016, it had only 3,627 firms. From 1976 to 2016, the U.S. population increased from 219 million to 324 million, so the U.S. went from 23 listed firms per million inhabitants to 11. These changes are dramatic and they raise a number of important questions: How did we get here? Why did the universe of public firms shrink so much? Will it keep shrinking? How have the listed firms changed as a result of this evolution? And perhaps most importantly, what is the overall economic impact of such dramatic change in the composition of listed firms? The research I report on in this summary addresses some of these questions.
How Did We Get Here?
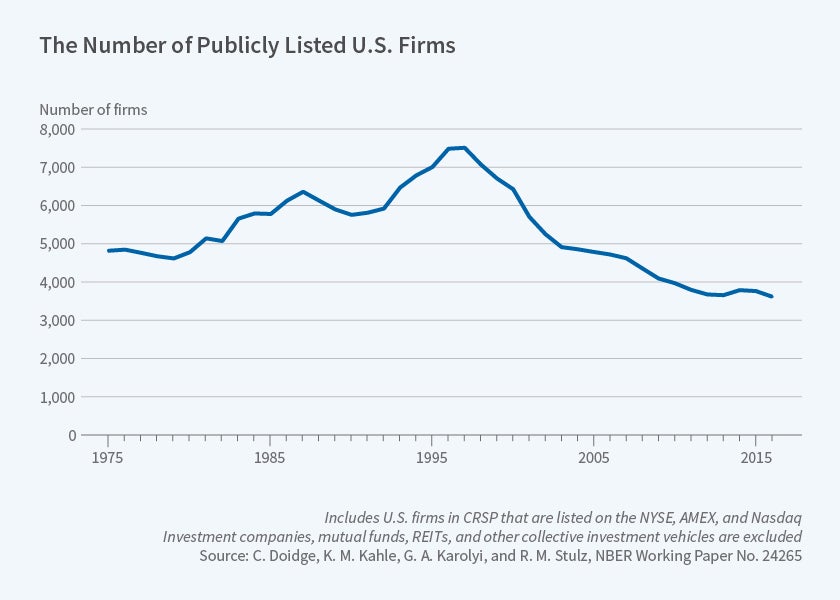
The decrease in the number of listed firms is a recent phenomenon. Figure 1 shows the evolution of the number of listed firms since 1975.1 The number of listed firms follows an inverted U-shape: It increased by 54 percent from 1975 to the listing peak in 1997 and decreased strongly since then. During the period from 1975 to the listing peak, the number of listings decreased in only eight years with no more than three years of consecutive declines. In contrast, the number of listings dropped every year since 1997, except for 2013.
When listings drop, more firms delist than new firms acquire a listing.2 U.S. firms typically acquire a listing through an IPO. Firms delist because they have to when they no longer meet the exchange's listing requirements (delists for cause), when they want to go dark or private, or because they are acquired. The largest contributor to the drop in listings is the fact that we have had an extremely large number of mergers. Delists for cause constitute the second-most important cause for delists. Finally, though voluntary delists have garnered considerable attention, they are not economically important in explaining the decline in listings. It is often stated that Sarbanes-Oxley Act of 2002 plays an important role in the decline in listings because of firms going private or dark. The problem with that view is that the number of firms that voluntarily delist is small and the wave of delists is well advanced by the time Sarbanes-Oxley affects smaller firms.
An obvious question about the evolution in the number of listings is whether it is unique to the U.S.3 Not surprisingly, there are other countries that have lost listings since 1997, but few have experienced a greater percentage decrease in listings. Further, the U.S. is in bad company in terms of the percentage decrease in listings — just ahead of Venezuela. The literature shows that the number of listings per capita is higher for more developed countries and for countries that respect shareholder rights more.4 Estimating a model that explains the number of listings per capita around the world, it turns out that the U.S. has developed a listing gap and that the size of this gap has become large in recent years. In the 1990s, the U.S. had as many listings per capita as expected based on the relation between listings and country characteristics. However, by 2012, the U.S. had more than 5,000 too few listings given the size of its population, its economic development, its financial development, and its respect for shareholder rights.
A country's industry composition changes all the time. Hence, we would expect some industries to lose listings and others to gain listings. A striking feature of the decrease in listings since 1997 is that it affects all industries in the following way: If one computes the ratio of the number of listed firms to the number of private and public firms with more than 20 employees, this ratio decreases for all industries.
In the debates concerning the decrease in listings, much has been made of the decrease in IPOs.5 This decrease in the U.S. occurs during a period when many countries have an increase in IPOs. It has been argued that the U.S. markets have become unfriendly to the smallest firms. Perhaps as a result, the size of listed firms has grown sharply. The firms that were small exchange-listed firms in the 1990s are no longer listed (accounting for inflation). One way to see the disappearance of small firms on exchanges is to look at the fraction of listed firms with assets of less than $100 million in 2015 dollars. In 1975, that was 61.5 percent of listed firms; in 1995, it was 43.9 percent. By 2015, only 22.6 percent of firms had less than $100 million in assets.6It is perhaps not surprising, therefore, that the whole size distribution of listed firms has shifted so that average market capitalization and median market capitalization accounting for inflation increased by a factor of 10 from 1975 to 2015. This evolution is in contrast to the pattern in the distribution of firm size outside the exchanges, as the proportion of non-listed firms that would have been small firms on exchanges has not fallen.7
How Have Firms Changed?
Most importantly, but not only because of technological change, the nature of investment has changed for U.S. firms, as they invest much more in intangible assets. Consequently, intangible assets have become much more important for these firms. The increase in the role of intangible assets has two important effects I focus on. First, it causes small young firms to stay out of the exchanges. Second, the fact that young small firms stay out of the exchanges leads exchange-listed firms to be older and larger. At the peak of listings, the average age of a listed firm was 12 years. Now, the average age is 20 years. Older firms invest less in fixed assets and pay out more.8 As such, the aging of American firms may help explain why investment in fixed assets fell following the peak in listings, and why payouts have been so large. I first discuss evidence on the increasing role of intangible assets and the implications of the increase in intangible assets on firm balance sheets. I then turn to evidence on payouts.
Until 2000, annual average capital expenditures of listed firms were almost never below 8 percent of assets. From 2002 to 2015, average capital expenditures of listed firms were never above 6 percent.9 While capital expenditures have fallen, average expenditures on R&D as a percentage of assets have increased considerably. Before 2001, average expenditures on R&D were always less than capital expenditures. From 2002 to 2015, average R&D as a percentage of assets always exceeded average capital expenditures as a percentage of assets.
A consequence of higher investment in R&D is that intangible assets have grown considerably in importance. There are other forms of intangible investment. Firms can invest in their workforce, in their organization, and in their brand names. Investment in these other forms of intangibles has grown as well. However, investment in intangibles is mostly expensed under generally accepted accounting principles (GAAP), so that it does not create assets on balance sheets. As a result, balance sheets that satisfy GAAP offer an increasingly distorted view of the assets held by corporations. Further, investments in intangibles make accounting earnings less relevant. The fact that GAAP accounting is less instructive about the economic value of firms with more intangibles works especially against young firms. An established firm with high intangibles will have an easier time convincing markets of its economic value. As a result, the growth in the importance of intangibles makes it less likely that young firms will want to join the exchanges and more likely that they will seek private funding or be acquired.
The composition of assets on the reported balance sheets of corporations has also dramatically changed: U.S. firms hold a lot more cash than they used to.10 Average cash to assets has grown from 9.2 percent in 1975 to 21.6 percent in 2015. This pattern is so strong that the average firm had more cash than fixed assets in 2015. The dramatic change in R&D investment also accounts for most of the change in the asset side of the balance sheets of U.S. corporations. To understand why, it is important to note that the holdings of cash are particularly large among high-R&D firms, which tend to have high volatility and poor collateral for borrowing. 11The U.S. has a larger proportion of such firms than other countries, with the cash holdings of U.S. firms that do not have high-R&D investments being similar to the holdings of firms in comparable countries.12
The fact that intangible assets represent poor collateral for debt partly explains why the typical firm has much lower leverage when taking cash into account than it used to. Average net leverage, which is debt minus cash divided by assets, has fallen from 17 percent in 1975 to 2 percent in 2016. Since 2000, every year between 40 and 50 percent of firms have more cash than debt. In contrast, in 1975, 24 percent of firms had negative net leverage.
As mentioned, investment in intangible assets is expensed, so that a firm that invests $1 more in R&D and reduces capital expenditures by $1 experiences a decrease in earnings. Young firms that are in the building phase of their lifecycle are therefore more likely to have poor earnings if they are firms whose main investments are investments in intangibles. The fraction of firms with earnings losses in a given year has increased substantially. In 1975, 13 percent of firms had losses. In contrast, 37 percent of firms had losses in 2016. The most successful established firms have considerable earnings. As a result, earnings have become more concentrated. In 2015, the top 200 firms by earnings had total earnings exceeding the total earnings of all public firms combined. In other words, the total earnings of the 3,281 firms that were not in the top 200 firms by earnings were negative.13The fact that young firms investing in intangibles tend to have GAAP losses even though they are creating economic value provides another reason why many firms may want to stay away from public markets.
Given the earnings accumulated by the most successful firms and the decrease in the number of young firms on exchanges, it is perhaps not surprising that U.S. public firms have on net been returning equity to investors rather than raising new equity from them. Repurchases became more important than dividends in the second half of the 1990s. The magnitude of repurchases since the listing peak has been extremely large as firms have repurchased shares in excess of newly issued shares for an amount of $3.6 trillion in 2015 dollars. On net, since the listing peak, exchanges have not been funneling new capital to corporations but have been a mechanism for corporations to return equity to shareholders.14
The evolution of U.S. firms toward larger and older firms has implications for investors as well. Larger and older firms are less volatile. As a result, the change in firm characteristics has contributed to a decrease in firm volatility. Of course, total firm volatility depends both on firm characteristics and on events affecting the economy as a whole. However, as a result of changing firm characteristics, the part of volatility that can be explained by firm characteristics has decreased substantially since the early 2000s. In fact, one would have to go back to the 1960s to find a period in which firm-specific volatility was as low as in the post-crisis years.15
Making Sense of the Changes
The changes in public firms likely hold the key to understanding why the number of public firms has fallen so much. Participating in public markets is not as beneficial for firms that invest in intangibles as it is for firms that invest in fixed assets, especially when these firms are small and young. If a firm builds a recognizable product and requires capital to expand its production, it is relatively straightforward for it to explain to potential investors how their money will be put to use. As the firm explains its needs, it does not endanger its ownership of its assets. It is rather difficult to steal a firm's plants. If a firm invests in intangibles, it is much more difficult for its management to convince investors that it will make good use of its money. If the firms give too much detail, which they could be forced to do by disclosure laws if public, their competitors can use the information. If they give too little detail, investors will pay little for their shares. It is not surprising, therefore, that for such firms, participation in public markets with their disclosure requirements is likely to be onerous. It is much easier for such firms to provide detailed information to a handful of private equity investors who have specialized knowledge that enables them to assess a firm's investments in intangibles. This evolution of firms and of markets has many implications. Many of these implications have yet to be investigated.
Endnotes
The figure is from C. Doidge, K. M. Kahle, G. A. Karolyi, and R. M. Stulz, "Eclipse of the Public Corporation or Eclipse of the Public Markets?," NBER Working Paper 24265, January 2018, and Journal of Applied Corporate Finance, 30(1), 2018, pp. 8–16.
For a detailed analysis of the evolution in listings, see C. Doidge, G. A. Karolyi, and R. M. Stulz, "The U.S. Listing Gap," NBER Working Paper 21181, May 2015, and published as "The U.S. Listing Gap," Journal of Financial Economics, 123(3), 2017, pp. 464–87.
The econometric model of the listing gap is presented in C. Doidge, G. A. Karolyi, and R. M. Stulz, "The U.S. Listing Gap," NBER Working Paper 21181, May 2015, and published as "The U.S. Listing Gap," Journal of Financial Economics, 123(3), 2017, pp. 464–87.
R. Porta, F. López-de-Silanes, A. Shleifer, and R. Vishny, "Legal Determinants of External Finance," Journal of Finance, 52(3), 2012, pp. 1131–50.
For a detailed analysis of the evolution of IPOs around the world, C. Doidge, G. A. Karolyi, and R. M. Stulz, "The U.S. Left Behind: The Rise of IPO Activity around the World," NBER Working Paper 16916, March 2011, and published as "The U.S. Left Behind? Financial Globalization and the Rise of IPOs Outside the U.S.," Journal of Financial Economics, 110(3), 2013, pp. 546–73.
K. M. Kahle and R. M. Stulz, "Is the U.S. Public Corporation in Trouble?" NBER Working Paper 22857, November 2016, and Journal of Economic Perspectives, 31(3), 2017, pp. 67–88. ↩
The comparison between public and private firms can only be made using the number of employees. See C. Doidge, G.. A. Karolyi, and R. M. Stulz, "The U.S. Listing Gap," NBER Working Paper 21181, May 2015, and published as "The U.S. Listing Gap," Journal of Financial Economics, 123(3), 2017, pp. 464–87. ↩
For dividends, see H. DeAngelo, L. DeAngelo, and R. M. Stulz, "Dividend Policy, Agency Costs, and Earned Equity," NBER Working Paper 10599, July 2004; also published as "Dividend Policy and the Earned/Contributed Capital Mix: A Test of the Life-cycle Theory," Journal of Financial Economics, 81(2), 2006, pp. 227–54; for payouts and investment, see C. Loderer, R. M. Stulz, and U. Waelchli, "Limited Managerial Attention and Corporate Aging," NBER Working Paper 19428, September 2013, and published as "Firm Rigidities and the Decline in Growth Opportunities," Management Science, 63(9), 2016, pp. 3000–20.
K. M. Kahle and R. M. Stulz, "Is the U.S. Public Corporation in Trouble?" NBER Working Paper 22857, November 2016, and Journal of Economic Perspectives, 31(3), 2017, pp. 67–88.
T. W. Bates, K. M. Kahle, and R. M. Stulz, "Why Do U.S. Firms Hold So Much More Cash Than They Used To?" NBER Working Paper 12534, September 2006, and Journal of Finance, 64(5), 2009, pp. 1985–2021.
S. Bartram, G. Brown, and R. M. Stulz, "Why Do Foreign Firms Have Less Idiosyncratic Risk than U.S. Firms?" NBER Working Paper 14931, April 2009, and published as "Why Are U.S. Stocks More Volatile?" Journal of Finance, 67(4), 2012, pp. 1329-70.
L. Pinkowitz, R. M. Stulz, and R. Williamson, "Multinationals and the High Cash Holdings Puzzle," NBER Working Paper 18120, June 2012, and published as "Do U.S. Firms Hold More Cash than Foreign Firms Do?" The Review of Financial Studies, 29(2), 2016, pp. 309–48.
K. M. Kahle and R. M. Stulz, "Is the U.S. Public Corporation in Trouble?" NBER Working Paper 22857, November 2016, and Journal of Economic Perspectives, 31(3), 2017, pp. 67–88.
D. Lee, S. Shin, and R. M. Stulz, "Why Does Capital No Longer Flow More to the Industries with the Best Growth Opportunities?" NBER Working Paper w22924, December 2016.
S. M. Bartram, G. W. Brown, and R. M. Stulz, "Why Has Idiosyncratic Risk Been Historically Low in Recent Years?" NBER Working Paper 24270, January 2018.


