Regional Evidence on Business Cycle Fluctuations and Countercyclical Policy
Studying cross-region variation in economic outcomes within a country is an increasingly common empirical research strategy in labor, public, and urban economics.1 For example, local exposure to trade with China has been shown to reduce local employment rates and wages.2 Cross-state variation has been used to estimate the incidence of local taxes.3 Large local public work programs have been used to document the existence of agglomeration economies in manufacturing.4
Cross-region variation provides macroeconomic researchers with richer information on economic fluctuations than aggregate time series data at the national level. For example, during the Great Recession in the United States, some metropolitan areas—Las Vegas, for example—experienced larger declines in employment than many others. Explaining this variation can shed light on potential causes of the aggregate recession.5
Drawing inferences about the aggregate economy from data on regional variation is complicated by two issues, however. First, the way a regional economy responds to a given economic shock could be substantively different from the way a national economy responds because of both factor mobility and general equilibrium forces.6 Factors such as Federal Reserve policy may respond to aggregate shocks but not to local shocks. Ignoring such general equilibrium factors can yield estimates of local employment elasticities to a given shock that are two to three times larger than the aggregate employment elasticity to the same shock.7 Second, regional comparisons cannot shed any light on shocks that affect the entire economy in the same way. Such shocks are "differenced away" when the different experiences of different regions are compared.
Much of my current research uses a combination of local and aggregate data to learn about the drivers of aggregate business cycles and to explore the regional consequences of aggregate government policies. A combination of local and aggregate data, along with a structural economic model, often is needed to use local variation to address macro questions.
Understanding the Causes of the Great Recession
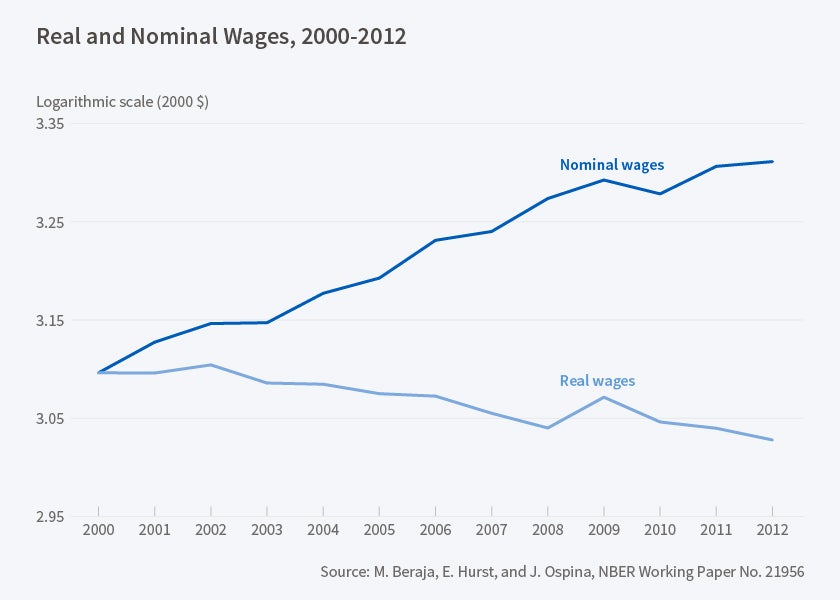
Despite aggregate employment rates falling substantially during the Great Recession, aggregate real wage growth during the 2008-2010 period remained on its pre-recession trend. If employment fell because of a labor demand decline, the employment decline during the recession should have been accompanied by a decline in real wages. Many people who believe that the Great Recession was primarily caused by a lack of demand appeal to wages being "sticky" as the reason a decline in real wages during the Great Recession did not accompany the sharp decline in employment.8 [See Figure 1.]
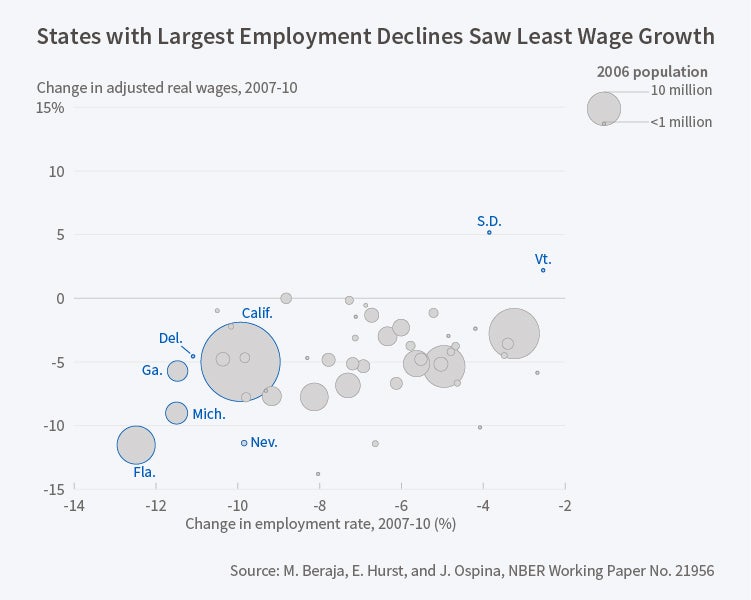
In new work with Martin Beraja and Juan Ospina, I estimate the amount of wage stickiness using cross-state variation.9 Using a variety of data sources, we show that states with the largest relative employment declines had the smallest relative wage increases. We construct state-level measures of real wages by combining state-level nominal wage data from the American Community Survey with state-level price indices constructed from scanner data. From this analysis, we estimate that wages are fairly flexible. While there is some stickiness to wages at the local level, real wages do respond to contemporaneous local labor demand shocks. [See Figure 2.]
To understand the broad causes of the Great Recession, we construct a model of local economies that can aggregate to the national economy. The model allows for the trade of goods across local economies, and for a national monetary authority that sets a common interest rate across local economies. We embed within the model four shocks: a shock to households' intertemporal consumption decisions, a shock to firms' marginal products of labor, a shock to households' current choices between market consumption and leisure, and a monetary policy shock. All but the monetary policy shock have both aggregate and local components.
Using data on both aggregate and local employment rates, prices, and nominal wages, we estimate the shocks that drove both aggregate and local business cycles during the Great Recession period. We estimate the amount of wage stickiness using local data throughout the analysis. Our main finding is that the shock to household intertemporal consumption decisions—something akin to a traditional Keynesian demand shock—explains at best only 40 percent of the employment decline during 2008–10 and essentially none of the persistently low employment rate between 2010 and 2012. The degree of wage stickiness necessary for demand shocks to be the primary cause of aggregate employment decline during the Great Recession is inconsistent with the flexibility of wages that we estimate from cross-state variation. Explaining aggregate wage patterns requires an aggregate labor supply shock. In our analysis, regional data are essential for identifying a key parameter that helps distinguish between various shocks driving aggregate business cycles.
Understanding the Decline in Employment Rates, 2000–15
What factors could have contributed to an aggregate labor supply shock during the Great Recession? A rising degree of skill mismatch could generate empirical patterns like those from a labor supply shock. For example, manufacturing workers may not be able to fill jobs in the computer sector regardless of the wage being offered for the computer sector jobs.
In my work with Kerwin Charles and Matt Notowidigdo, we document the extent to which the secular decline in manufacturing employment during the 2000s contributed to the sharp decline in employment rates experienced in the U.S. economy between 2000 and 2015.10 Employment rates for men and women between the ages of 21 and 54 with less than a four-year college degree fell by roughly 2 percentage points between 2000 and 2007 and then fell by an additional 7 percentage points between 2007 and 2010. In 2015, employment rates for this group were still roughly 7 percentage points below the 2000 level.
The U.S. economy lost roughly 3.5 million manufacturing jobs during the 2000–07 period and another 2 million manufacturing jobs during the 2007–10 period. In 2015, U.S. manufacturing employment was still roughly 5.5 million jobs below the 2000 level. The decline in manufacturing employment in the U.S. during the 2000s was almost three times as large as the decline during the 1980s and 1990s.
A common question for structural explanations of the employment declines since early 2000 is why so much of the decline was concentrated during the 2007–10 period. It is often argued that structural forces result in more gradual changes while cyclical factors can result in more abrupt changes. If manufacturing employment declines are contributing to low employment rates in the U.S. economy, why is it that the employment rate did not fall more during the early 2000s, when the manufacturing declines were larger?
Charles, Notowidigdo, and I document that the housing boom masked the labor market effects of the declining manufacturing sector. As manufacturing declined, lower skilled men and women were displaced, but the early 2000s housing boom actually increased demand for construction workers, mortgage brokers, real estate agents, and local services. This latter effect was due to a wealth or liquidity effect from rising house prices. As housing prices increased, households increased their spending on local goods.11 Male workers with less than a four-year college degree moved sharply into construction during the early 2000s. Simultaneously, female workers with less than a four-year college degree moved sharply into real estate sales, mortgage brokerage, and local services.
Using aggregate data, we document that the decline in manufacturing employment for both men and women with less than a four-year college degree was almost completely offset by an increase in employment in sectors spurred on by the housing boom. In 2007, the housing market collapsed and employment spurred by the housing boom collapsed with it. Manufacturing employment continued to decline throughout the recession. Thus, a sharp downward trend in manufacturing employment coupled with a boom and bust in housing-related employment caused aggregate employment to remain relatively flat during the early 2000s and then to fall sharply at the start of the recession.
While the patterns are present in aggregate data, by exploiting regional variation the "masking hypothesis" can be illustrated clearly. Certain metropolitan areas—like Detroit—experienced large manufacturing declines and no housing boom. Other metropolitan areas—like Las Vegas—experienced little manufacturing decline and a large housing boom. Exploiting cross-region variation, we show that employment rates in manufacturing areas plummeted well before the start of the Great Recession. Additionally, we show that employment rates were well above long-run trends in housing boom areas during the early 2000s. At the national level, these two effects roughly offset. Part of the masking we document occurred because local areas were exposed differentially to manufacturing declines and housing booms. However, we also document that masking occurred at the individual level. If an individual who was displaced from manufacturing in the early 2000s lived in an area experiencing a housing boom, that person was more likely to be re-employed than a displaced manufacturing worker in an area without a housing boom.
By exploiting cross-region variation, we find that the labor market was structurally weaker prior to the Great Recession than had previously been recognized, and that the housing boom temporarily propped up labor market statistics in aggregate data.
The Regional Effects of U.S. Monetary Policy
In addition to my work using regional variation to learn about the drivers of the aggregate macroeconomy, I also have studied how aggregate U.S. macro policies differentially affect various regions of the country. In recent work with Beraja, Andreas Fuster, and Joe Vavra, we show that the Federal Reserve's policy of quantitative easing (QE) beginning in November 2008 dis-proportionately helped regions of the country that were doing relatively well.12 We document that right after QE began, mortgage rates fell sharply. As rates fell, a mini refinancing boom occurred. The increase in refinancing was associated with individuals tapping into their home equity. However, the increase in refinancing was concentrated in locations that had lower unemployment rates. The boom was much larger in Dallas than it was in Las Vegas. The reason is that most homeowners in Las Vegas were underwater as of November 2008 while most homeowners in Dallas were not. Consumption increased much more after QE in Dallas than in Las Vegas. Local refinancing booms were correlated with local spending booms. Collectively, the results show that effects of monetary policy most helped regions that needed help least.
While the Federal Reserve may not be independently interested in the distributional aspects of monetary policy decisions, our paper highlights that the effectiveness of monetary policy in stimulating consumption through home equity borrowing can be time-varying. Monetary policy has a lower stimulus effect through this channel when the economy is experiencing a housing bust and many homeowners are underwater.
U.S. Mortgage Markets and Cross-Region Redistribution
The extent to which households can borrow to self-insure against regional shocks depends crucially on how the interest rate varies with regional economic conditions. Most economic models assume that regions within a monetary union share a common risk-adjusted interest rate. For most households, mortgages are the primary instrument of borrowing. In a recent paper with Ben Keys, Amit Seru, and Vavra, I show that the assumption of constant risk-adjusted mortgage rates is well supported by data for mortgages securitized by Government Sponsored Enterprises (GSEs).13 Using loan-level data, we document that there is no spatial variation at all in mortgage rates and fees across U.S. metropolitan areas for loans securitized by the GSEs despite there being large ex ante predictable differences in default risk across those regions. All of our results control for loan-level observables like FICO score and loan-to-value ratios. For example, GSE-secured loans originated in 2007 in Las Vegas, conditional on borrower and loan observables, faced the same mortgage rate as GSE-secured loans originated in 2007 in Dallas, despite the Las Vegas loans, conditional on observables, having a much higher predicted default probability, given that housing prices were falling to a greater extent there.
The patterns found within a sample of GSE loans differ markedly from the patterns in a sample of otherwise similar mortgages not securitized by the GSEs. These loans were similar in all dimensions aside from size. Loans above a certain threshold are ineligible for securitization by the GSEs. Mortgage rates on these jumbo loans were higher in areas where predicted mortgage default rates were higher. We show evidence that the GSEs are bound by political constraints that prevent them from charging spatially different mortgage rates conditional on borrower and loan characteristics.
If mortgage rates do not respond to local economic shocks that increase ex ante default risk, then households in these regions face lower borrowing costs than they would if default risk were priced into interest rates. This reduction in borrowing costs may in turn offset some of the negative local economic shocks that increased default risk in the first place. Conversely, those in regions with low default risk will face higher borrowing costs than they would if this low default risk was priced into interest rates. Thus, the constant interest rate "policy" followed by the GSEs results in state-contingent regional transfers. We estimate that during the Great Recession about $47 billion was transferred via the mortgage market from regions with smaller employment declines (above the median) to regions with larger employment declines (below the median).
Endnotes
An influential example of this includes O. Blachard and L. Katz, "Regional Evolutions," Brookings Papers on Economic Activity, 23(1), 1992, pp. 1–76.
D. Autor, D. Dorn, and G. Hanson, "The China Syndrome: Local Labor Market Effects of Import Competition in the United States," NBER Working Paper 18054, May 2012, and The American Economic Review, 103(6), 2013, pp. 2121–68.
M. Harding, E. Leibtag, and M. Lovenheim, "The Heterogeneous Geographic and Socioeconomic Incidence of Cigarette Taxes: Evidence from Nielsen Homescan Data," American Economic Journal: Economic Policy, 2012, 4(4), 2012, pp. 169–98.
P. Kline and E. Moretti, "Local Economic Development, Agglomeration Economies and the Big Push: 100 Years of Evidence from the Tennessee Valley Authority," NBER Working Paper 18054, August 2013, and The Quarterly Journal of Economics, 129(1), 2014, pp. 275–331.
A. Mian and A. Sufi, "What Explains the 2007-09 Drop in Employment?" Econometrica, 82(6), 2014, pp. 2197–223. An earlier version of this paper circulated as "What Explains High Unemployment? The Aggregate Demand Channel," NBER Working Paper 17830, February 2012.
E. Nakamura and J. Steinsson, "Fiscal Stimulus in a Monetary Union: Evidence from U.S. Regions," NBER Working Paper 17391, September 2011, and American Economic Review, 104(3), 2014, pp. 753–92; M. Beraja, E. Hurst, and J. Ospina, "The Aggregate Implications of Regional Business Cycles," NBER Working Paper 21956, February 2016.
M. Beraja, E. Hurst, and J. Ospina, "The Aggregate Implications of Regional Business Cycles," NBER Working Paper 21956, February 2016.
See, for example, P. Krugman, "Yellen, Wages, and Intellectual Honesty," blog post from August 25, 2014.
M. Beraja, E. Hurst, and J. Ospina, "The Aggregate Implications of Regional Business Cycles," NBER Working Paper 21956, February 2016.
K. Charles, E. Hurst, and M. Notowidigdo, "The Masking of the Decline in Manufacturing Employment by the Housing Bubble," Journal of Economic Perspectives, 30(2), 2016, pp. 179–200; K. Charles, E. Hurst, and M. Notowidigdo, "Housing Booms, Manufacturing Decline, and Labor Market Outcomes," University of Chicago Working Paper, 2016, https://bit.ly/2LlM1VB. The prior two papers are based on K. Charles, E. Hurst, and M. Notowidigdo, "Manufacturing Decline, Housing Booms and Non-Employment," NBER Working Paper 18949, April 2013.
A. Mian and A. Sufi, "House Price Gains and U.S. Household Spending from 2002 to 2006," NBER Working Paper 20152, May 2014.
M. Beraja, A. Fuster, E. Hurst, and J. Vavra, "Regional Heterogeneity and Monetary Policy," Federal Reserve Bank of New York Staff Reports No. 731, June 2015.
E. Hurst, B. Keys, A. Seru, and J. Vavra, "Regional Redistribution Through the U.S. Mortgage Market," NBER Working Paper 21007, March 2015, and forthcoming in American Economic Review.


