Slower U.S. Growth in the Long- and Medium-Run
The annual growth rate of U.S. per-capita real GDP remained remarkably steady at 2.1 percent between 1890 and 2007. Until recently, it was widely assumed that the Great Recession of 2007-09 and the slow recovery since 2009 represented only a temporary departure from that steady long-run growth path. Growth theory, which tends to take the economy's underlying rate of technological change as exogenous, was consistent with the widespread expectation that in the long run the economy's growth rate would soon return to the longstanding 2 percent annual rate.
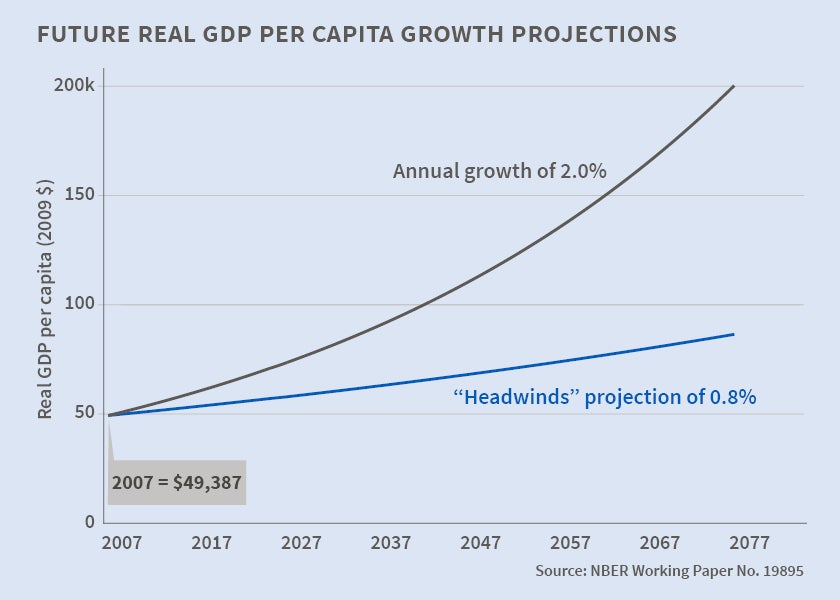
In a series of research papers dating back 15 years, I have questioned the presumption of a constant pace of innovation and technological change. More recently, in several papers I have described a variety of "headwinds" that are in the process of slowing the economy's growth rate independently of the contribution of innovation. Taken together, these headwinds and a slowing pace of innovation lead me to predict that the economy's long-run rate of growth of per-capita real GDP over the next 25 years or so will be 0.9 percent, less than half of the historic pre-2007 rate of 2.1 percent. And that 0.9 percent will not be available to most of the population, as growing inequality will cause a disproportionate share of available output growth to accrue to those whose incomes fall in the top one percent of the income distribution. Growth of per-capita real income for the bottom 99 percent of the income distribution will be 0.5 percent per year or less.
This research summary begins with a look at the factors involving innovation and the headwinds that are in the process of reducing long-run growth. A subsequent section describes a new technique to estimate the growth rate of the economy's underlying potential output, an analysis which concludes that the economy's potential growth rate falls well short of that currently assumed in the projections of the Congressional Budget Office (CBO).
The Pace of Innovation and the "One Big Wave"
Any treatment of U.S. long-run growth must distinguish between productivity and per-capita output. While these two measures of the growth process are sometimes treated as interchangeable, they are not. The growth rate of output per person equals the growth rate of output per hour plus the growth rate of hours per person. While per-person output growth was relatively steady over the entire period between 1890 and 2007, growth of output per hour and of hours per person were not. In particular, labor productivity experienced a half-century of rapid growth between 1920 and 1970, then slowed markedly after 1970. This productivity growth slowdown did not dampen the growth rate of per-person output because the growth of hours per person was bolstered by the entry to women into the labor force.
The basic measure of the pace of innovation in an economy is the growth rate of total factor productivity (TFP), which is calculated by subtracting from labor productivity growth both the contribution of growth in the capital-labor ratio (capital deepening) and the effect of higher educational attainment. Because the capital-deepening and education effects were relatively constant between 1890 and 2007, TFP growth has an even-more-pronounced peak during the half-century 1920-70 than is true for labor productivity. I have called this peaked time path of TFP the "one big wave" and have provided estimates of TFP growth equal to a rate of 2.03 percent per year during 1920-70 as compared with only 0.7 percent for 1890-1920 and 0.74 percent for 1970-2014.1
The primary substantive explanation for the big wave lies in the timing of inventions. TFP growth during the 1920-70 big wave benefited from the diffusion of four great clusters of inventions that in their combined importance overshadow the information and communication technology (ICT) revolution of the last few decades. A complementary hypothesis is that the partial closing of American labor markets to immigration and of American goods markets to imports during the big wave period gave an artificial and temporary boost to real wages which fed back into boosting productivity growth, followed by a reopening of the economy to immigration and imports that contributed to the post-1970 slowdown in growth of TFP and of labor productivity.2
The ICT revolution began with the first mainframe computers in the 1960s and 1970s, but productivity and TFP growth remained slow from 1970 until the mid-1990s. Then the economy enjoyed a temporary revival in productivity and TFP growth that lasted from 1996 to 2004. Any assessment of the likely long-run growth of productivity and TFP over the next 25 years needs to evaluate which is more relevant to the future, the brief 1996-2004 revival period or the other years since 1970 (i.e., 1970-96 and 2004-14) during which productivity and TFP growth have been much slower.
In my recent analyses, I argue that the 1996-2004 revival period is not relevant for future forecasts for two reasons. First, productivity growth during 2004-14 was even slower than during 1970-96, not to mention 1996-2004. Second, several other aspects of economic performance exhibited a similar pattern of temporary revival that died out after the early 2000s. Manufacturing capacity growth rose from 2.5 percent in 1970-95 to over six percent in 1995-2000, followed by a steady decline to negative growth in 2011-12. The share of ICT value-added in total manufacturing value-added exhibited a similar sharp peak in 1998–2000 followed by much lower values after 2000, and the ratio of price to performance of computer equipment also reached its fastest pace of decline during the same narrow time span of 1998-2000.3
The "Headwinds" That Are Slowing the Pace of U.S. Economic Growth
The headwinds that are in the process of slowing U. S. economic growth include demography, education, inequality, and the federal debt.4 Each of these alters the growth of long-run real output per capita in a different way. The demographic headwind, by reducing hours per person, shrinks the growth rate of real per-person output below the rate of productivity growth. The education headwind directly reduces growth in both productivity and in real output per person. The inequality headwind reduces the growth rate of per-person income in the bottom 99 percent of the income distribution below the average for all income-earners. The federal debt headwind causes a decline in disposable income relative to total income as a result of cuts in benefits or increases in taxes needed to stabilize the federal debt-GDP ratio.
The first component of the demographic headwind is the slowing rate of population growth due to declining fertility and immigration. While a decline in the rate of population growth has no direct impact on per-person output growth, it does put downward pressure on aggregate demand due to the declining need for net investment in residential housing as well as shopping centers and other types of nonresidential building. The second and more important demographic component is the ongoing shrinkage in aggregate work hours relative to the size of the population, and this in turn is due to the ongoing decline in the labor-force participation rate (LFPR). Retirement of the baby-boom generation causes hours per person to decline at a rate of about 0.4 percent per year. Since 2009, the LFPR has been declining at about 0.8 percent per year, reflecting declining participation over and above the baby-boom retirement phenomenon. Key groups exhibiting a declining LFPR are adult men in the 25-54 age group and youth of both sexes aged 16 to 24. Any future decline in the LFPR, including the inevitable further contribution of baby-boom retirement to slowing growth in labor hours, reduces the growth rate of output per person relative to output per hour.
The education headwind involves both educational attainment and educational performance. Rising educational attainment between 1910 and 1970, as the high-school completion rate increased from 10 to 80 percent, was an important contributor to productivity growth during the "one big wave" period of 1920-70. The rate of high school completion has changed little in the past four decades. Even though the college completion rate continues to inch up, the U.S. remains the only nation in which the educational attainment of the 25-34 age cohort is little different than the 55-64 cohort. In all other industrialized countries attainment of the young is substantially greater. An additional issue that will subtract from future productivity growth is the poor quality of educational outcomes in high school. The OECD international Programme for International Student Assessment tests of 15-year-olds reveal that American scores in reading, math, and science rank in the bottom half of the nations tested.
The reduced pace of growth-enhancing innovation after 1970, as well as the demographic and education headwinds, result in projected growth of U.S. real output per person over the next 25 years of 0.9 percent per annum as compared to 2.1 percent per annum during 1890-2007. But this average rate of 0.9 percent does not apply to the great majority of American households because of the inexorable rise of inequality that has occurred since the late 1970s. The inequality data of Thomas Piketty and Emmanuel Saez can be used to calculate that for the 1993-2013 interval the growth rate of income for the bottom 99 percent of the income distribution lagged the overall average by 0.5 percentage points per annum. If this were to continue, it would reduce growth of real income per capita for the bottom 99 percent to 0.4 percent per year, 0.5 percentage points slower than the 0.9 percent average for all income earners. The forces leading to greater income inequality are many and differ for the top one percent and bottom 99 percent of the income distribution, and few of these forces are likely to lose relevance over the next few decades.5
The fourth headwind reflects CBO projections that the federal debt-GDP ratio will rise steadily after 2020 as a result of growth in entitlements, mainly Social Security and Medicare. To avoid an unsustainable increase in that ratio, some combination of benefit reductions and tax increases will need to occur. This will reduce disposable income below the amount that otherwise would be available to fuel growth in per-capita real income.
Output Growth in the Medium Run
When the U.S. unemployment rate fell below 6 percent in late 2014, attention began to shift from short-run demand factors that affected the labor market to longer-term considerations such as the economy's potential output-growth rate that would set a limit on the rate at which actual output could grow once the unemployment rate stabilized at a particular value. I proposed a simple method of calculating the growth rate of potential GDP based on estimates of each component of the "output identity," a definition linking output to productivity, hours per employee, the employment rate, the LFPR, and the size of the population. Based on alternative estimates of productivity growth and the change in the LFPR, I calculated a range of three values for the potential output growth rate. The central prediction of 1.6 percent per annum is much lower than the 2.2 percent annual growth rate currently assumed by the CBO, a difference that implies the CBO has overstated 2024 real GDP by $2 trillion. Because slower future output growth implies less growth in tax revenues, I calculate that the CBO has understated the 2024 federal debt-GDP ratio by nine percentage points (78 vs. 87 percent).6 Slower potential GDP growth adds to the bite of the federal debt headwind by requiring a greater future fiscal retrenchment than would otherwise be necessary.
My estimate of 1.6 percent for the current rate of potential real GDP growth is almost exactly equal to realized actual real GDP growth in 2004-14, implying "more of the same" rather than a radically new economic environment. The 1.6 percent potential growth rate is almost exactly half of the realized growth rate of actual real GDP between 1972 and 2004; of this difference, roughly one-third is due to slower productivity growth and the other two-thirds to slower growth in aggregate hours of work.
Endnotes
R. J. Gordon, "Interpreting the 'One Big Wave' in U. S. Long-term Productivity Growth," NBER Working Paper 7752, June 2000, and in Bart van Ark, Simon Kuipers, and Gerard Kuper, eds., Productivity, Technology, and Economic Growth, Boston, MA: Kluwer Publishers, 2000, pp. 19-65.
R. J. Gordon, "Does the New Economy Measure Up to the Great Inventions of the Past?" NBER Working Paper 7833, August 2000, and Journal of Economic Perspectives, 14(4), 2000, pp. 49–74.
R. J. Gordon, "The Demise of U. S. Economic Growth: Restatement, Rebuttal, and Reflections," NBER Working Paper 19895, February 2014.
The headwinds were introduced in R. J. Gordon "Is U.S. Economic Growth over? Faltering Innovation Confronts the Six Headwinds," NBER Working Paper 18315, August 2012.
R. J. Gordon and I. Dew-Becker, "Controversies about the Rise of American Inequality: A Survey," NBER Working Paper 13982, May 2008, and "Selected Issues in the Rise of Income Inequality," Brookings Papers on Economic Activity, 2, 2007, pp. 169-92.
R. J. Gordon, "A New Method of Estimating Potential Real GDP Growth: Implications for the Labor Market and the Debt/GDP Ratio," NBER Working Paper 20423, September 2014.


