Residential Property Markets and Exposure to Rising Sea Level
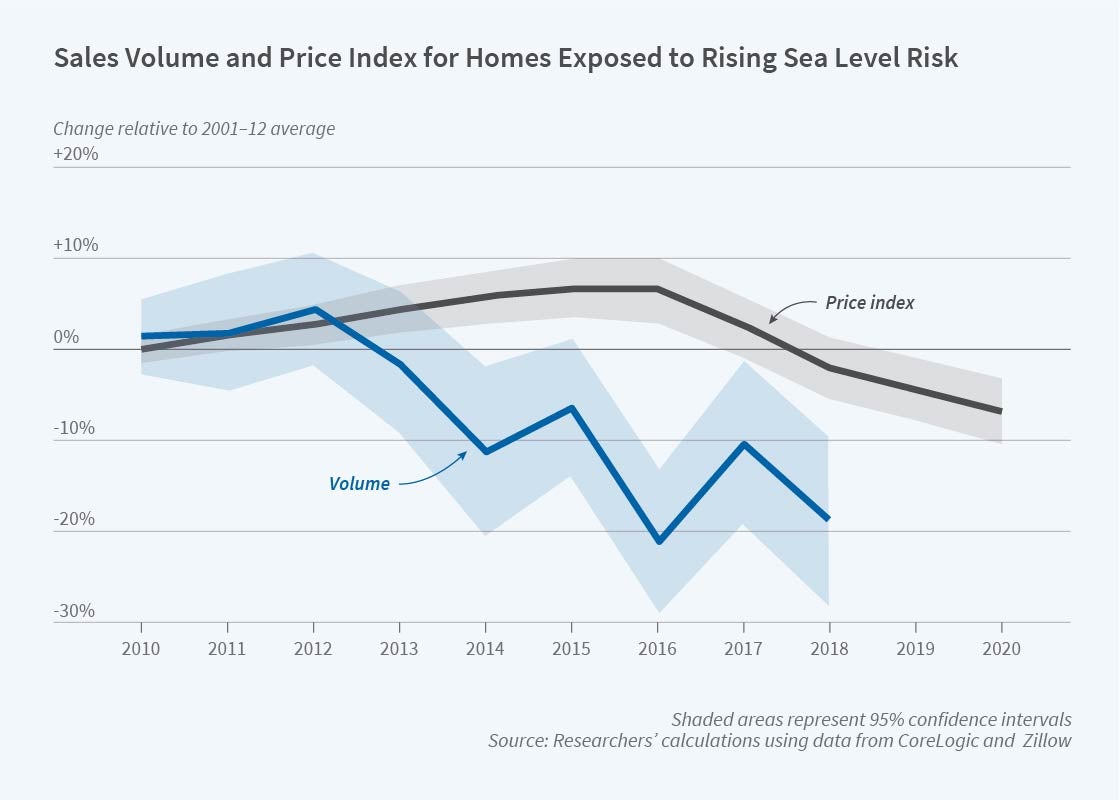
Property sales in Florida census tracts most exposed to prospective sea level increase declined after 2013 relative to sales in less-exposed areas, but prices only started to fall years later.
Forty-two percent of the US population resides in shoreline counties. Whether and how property and mortgage markets incorporate information on the risk of climate-related sea level rise is therefore an issue of broad significance.
In Neglected No More: Housing Markets, Mortgage Lending, and Sea Level Rise (NBER Working Paper 27930), Benjamin J. Keys and Philip Mulder study the relationship between exposure to sea level rise and changes in housing and mortgage markets over the 2001–20 period. They focus on the coastal Florida market, where the Union of Concerned Scientists projects that more than one million properties are at risk of chronic inundation due to sea level rise by 2100. Their analysis emphasizes tract-level variation in flood risk, and includes data from over 1,380,000 home sales and 2,650,000 loan applications, as well as extensive data on flood insurance premiums and take-up rates.
The researchers examine whether the post-2013 volume and price trends diverge more from their 2001–12 trends in markets with more exposure to prospective sea level rise than in observationally similar areas with less exposure. Three different approaches to selecting “control” areas — synthetic control, nearest neighbor, and generalized propensity score-matching — produce similar results. More-exposed markets experienced declines in housing transaction volumes, but comparatively little change in prices, after 2013 relative to observationally similar less-exposed markets. By 2018, the most-exposed census tracts in Florida had transaction volumes 16 to 20 percent below their 2001–12 annual averages relative to trends in a matched sample of markets with low exposure to sea level rise. These estimates indicate that approximately 16,500 fewer home transactions took place from 2013–18 among the 187 census tracts most exposed to sea level rise relative to counterfactual trends.
The researchers do not find a strong relationship between home price changes and risk of sea level rise from 2013–16, but they detect some evidence of price decline in more-exposed tracts after 2016. By 2020, prices in these markets were 5 to 10 percent below trend. They find little evidence that changes in lender standards with respect to sea level rise risk are behind the changes they observe in at-risk housing markets. There are only small relative changes in loan denial, securitization, and refinancing volumes between markets facing different sea level rise risk, and they estimate similar declines in both cash and mortgage home purchase volumes in the most sea level rise-exposed tracts. They also conclude that these responses are not due to pricing practices of the National Flood Insurance Program, which tends to underprice insurance for at-risk coastal properties and therefore encourages housing investment in the tracts most exposed to prospective sea-level rise.
The researchers find that exposed housing markets are experiencing demand-driven declines in transaction volume and home prices over a period coinciding with increasing climate risk salience. They note that transaction volumes began to diverge in 2013, a year in which a confluence of events — including Hurricane Sandy, the release of two critical climate assessment reports, and Pew Research data showing Americans becoming more worried (and polarized) about climate issues — focused public attention on climate risk. Given these changing beliefs around sea level rise, they say, their findings are best characterized by housing market bubble dynamics, where prospective sellers of homes with sea level rise risk remain optimistic about their home’s value even as prospective buyers grow more pessimistic. Thus, sellers set prices higher than most prospective buyers are willing to pay, causing transaction volumes to decline before prices. Supporting the role of beliefs in driving these demand dynamics, the researchers find that the at-risk tracts with the biggest declines are in counties where more residents report being worried about climate change.
— Lauri Scherer


