Mixed Immigrant-Native Founding Teams Excel
Roughly one-quarter of new employer businesses in the United States are started by immigrants. Immigrant inventors have been responsible for approximately 23 percent of US patents produced since 1976 despite making up only 16 percent of the total US-based inventor population. Yet immigrant entrepreneurs usually do not build companies in isolation—many cofound startups alongside US-born entrepreneurs. In Native-Immigrant Entrepreneurial Synergies (NBER Working Paper 33804), Zhao Jin, Amir Kermani, and Timothy McQuade examine whether startups cofounded by immigrant and native entrepreneurs outperform those with founders from exclusively one group.
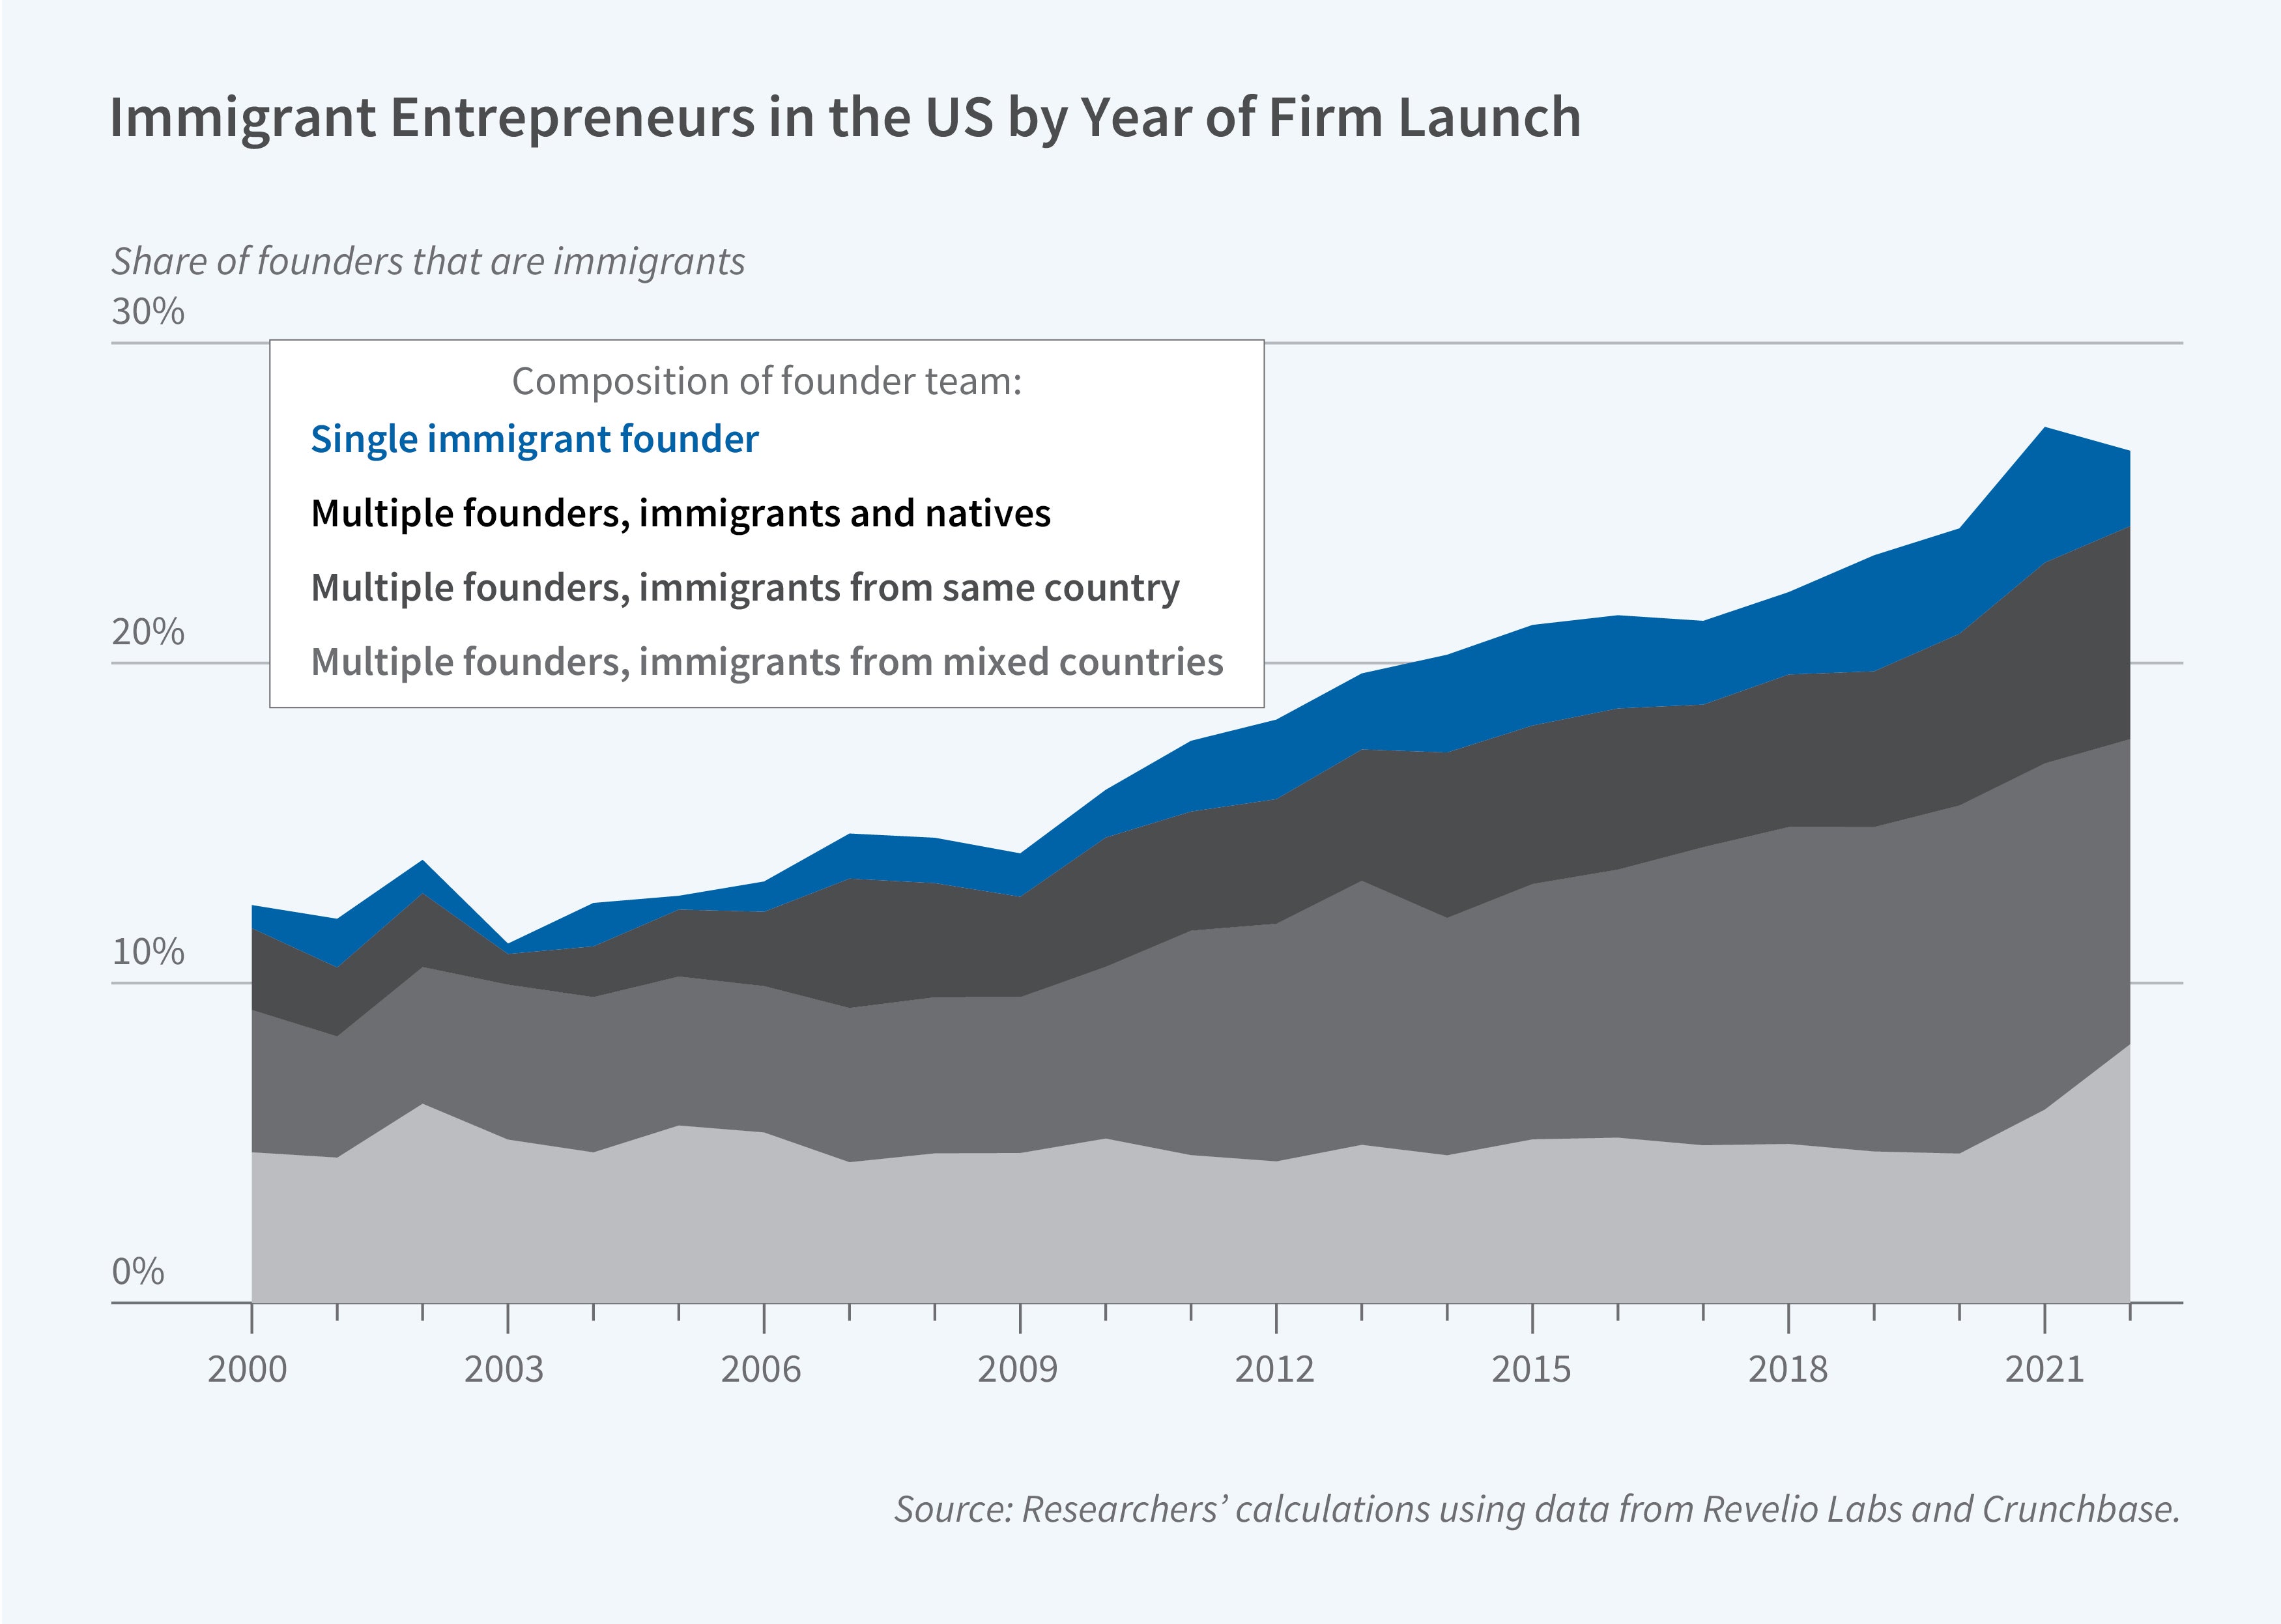
Mixed immigrant-native founding teams produce larger, better-funded, and more-successful startups than single-origin teams.
The researchers link data from Crunchbase—a comprehensive database of startup activity including funding history, acquisitions, and IPO status—to data from Revelio Labs, a workforce intelligence platform that draws on LinkedIn profiles of more than 850 million individuals across 200 countries. They identify founders' immigration status, employment histories, and educational backgrounds for 90,834 US-based startups founded between 2000 and 2022. Immigrant status is defined by the first country appearing on an individual's LinkedIn profile, either in education or employment.
The share of immigrant entrepreneurs in the United States has risen steadily from 12 percent in 2000 to 27 percent in 2022. Among the top countries of origin, India leads with 4,654 startups, followed by the United Kingdom and Canada. The artificial intelligence, blockchain and cryptocurrency, and data and analytics industries attract a large share of immigrant entrepreneurs. The shares of startups in each of these industries with at least one immigrant founder are 36, 30, and 28 percent, respectively.
Startups with both immigrant and native cofounders consistently outperform those founded by members of either group alone. Three years after inception, native-immigrant startups are 20 percent larger by employment, and immigrant-only startups are 15 percent larger, than native-only startups. Native-immigrant startups are also significantly more likely to receive external funding and to raise substantially more capital during the observation period.
Native-immigrant startups hire 27.1 percent more immigrant employees than native-only startups, and the workers they hire from both native and immigrant labor pools exhibit higher promotion rates. Native-immigrant startups are also 7.7 percent more likely to be funded by non-US investors than startups without an immigrant cofounder, and they disproportionately attract capital from higher-quality domestic and foreign venture capital funds relative to both native-only and immigrant-only startups. Native-immigrant startups have 117 percent more total granted patents than immigrant-only startups and 28 percent more than native-only startups.


