The Dynamics of Cities
Cities, like portfolios, reflect a balance between concentration and diversification. Some places build their fortunes on a narrow set of industries and reap large gains when those sectors expand. Others spread activity more broadly and grow more steadily. At first glance, the trade-off seems familiar: Higher returns come with higher risk. But unlike financial portfolios, cities cannot be easily rebalanced. Their economic structure is embedded in physical capital, skills, and local networks, which adjust only slowly over time. This creates a distinct dynamic: Places that grow rapidly around a single industry often struggle long after that industry has faded. The puzzle is not why they decline, since shrinking demand for their core activity is explanation enough, but why they fail to adapt.
The answer lies in how growth happens. The same forces that generate rapid expansion can narrow the local economic structure in ways that are difficult to reverse. Transport infrastructure plays a central role in this story, not because it determines city trajectories on its own, but because it shapes how economic activity is organized across space. By enabling larger markets, it supports rapid growth and specialization while also contributing to economic structures that are difficult to adjust over time.
This pattern reflects two related tensions in how cities grow. Proximity between firms and workers raises productivity through better matching, knowledge spillovers, and shared access to inputs and markets, but density also generates costs through congestion, high land prices, and, at early stages of development, poor sanitation and disease. Cities expand if the benefits of agglomeration outweigh these costs. Over longer horizons, a second tension emerges: The economic structure that develops in this process can support growth in the short run but may limit adaptability as technologies and markets change. These tensions become particularly visible during industrialization, when cities expand rapidly and reorganize around new forms of production.1
Transport and the Making of Industrial Cities
Before the nineteenth century, cities operated under tight spatial constraints. Production and residence had to remain close, and both the scale of cities and the organization of economic activity were limited by transport costs. Most workers lived near their workplace. Pre-industrial cities were “walking cities,” where a roughly 30-minute walk defined the effective radius of daily activity. Market integration was similarly limited, with transport at scale largely confined to waterways.
The transport revolution fundamentally changed these constraints. The introduction of canals and, more importantly, the expansion of railways in the nineteenth century reduced the cost of moving goods across regions and sharply lowered commuting times within cities. This allowed firms to serve larger markets and made it profitable to concentrate production in a smaller number of locations. Industrial production shifted toward large-scale factories, typically located in central areas with access to transport networks. Economic activity became increasingly specialized across regions, reflecting differences in access to markets and inputs.
This structural change created a new organizational challenge: how to accommodate a growing workforce in cities where production was increasingly concentrated. Urban transport provided a solution. As commuting over longer distances became feasible, workers were no longer required to live close to their workplaces. Central locations increasingly specialized as places of production, while populations spread outward into less dense areas. In London, for example, the expansion of railways enabled workers to live farther from the center and travel to jobs in the city, moving households away from the most congested and polluted areas.2
This reorganization was not marginal and is clearly visible in Figure 1, which shows the night and day population in the City of London around the turn of the nineteenth century. While the residential (night) population of the central city declined sharply, workplace (day) employment increased, reflecting a shift toward a commuting-based urban structure. Lower commuting costs allowed locations to specialize: High-productivity areas became centers of employment, while areas with better living conditions became residential.
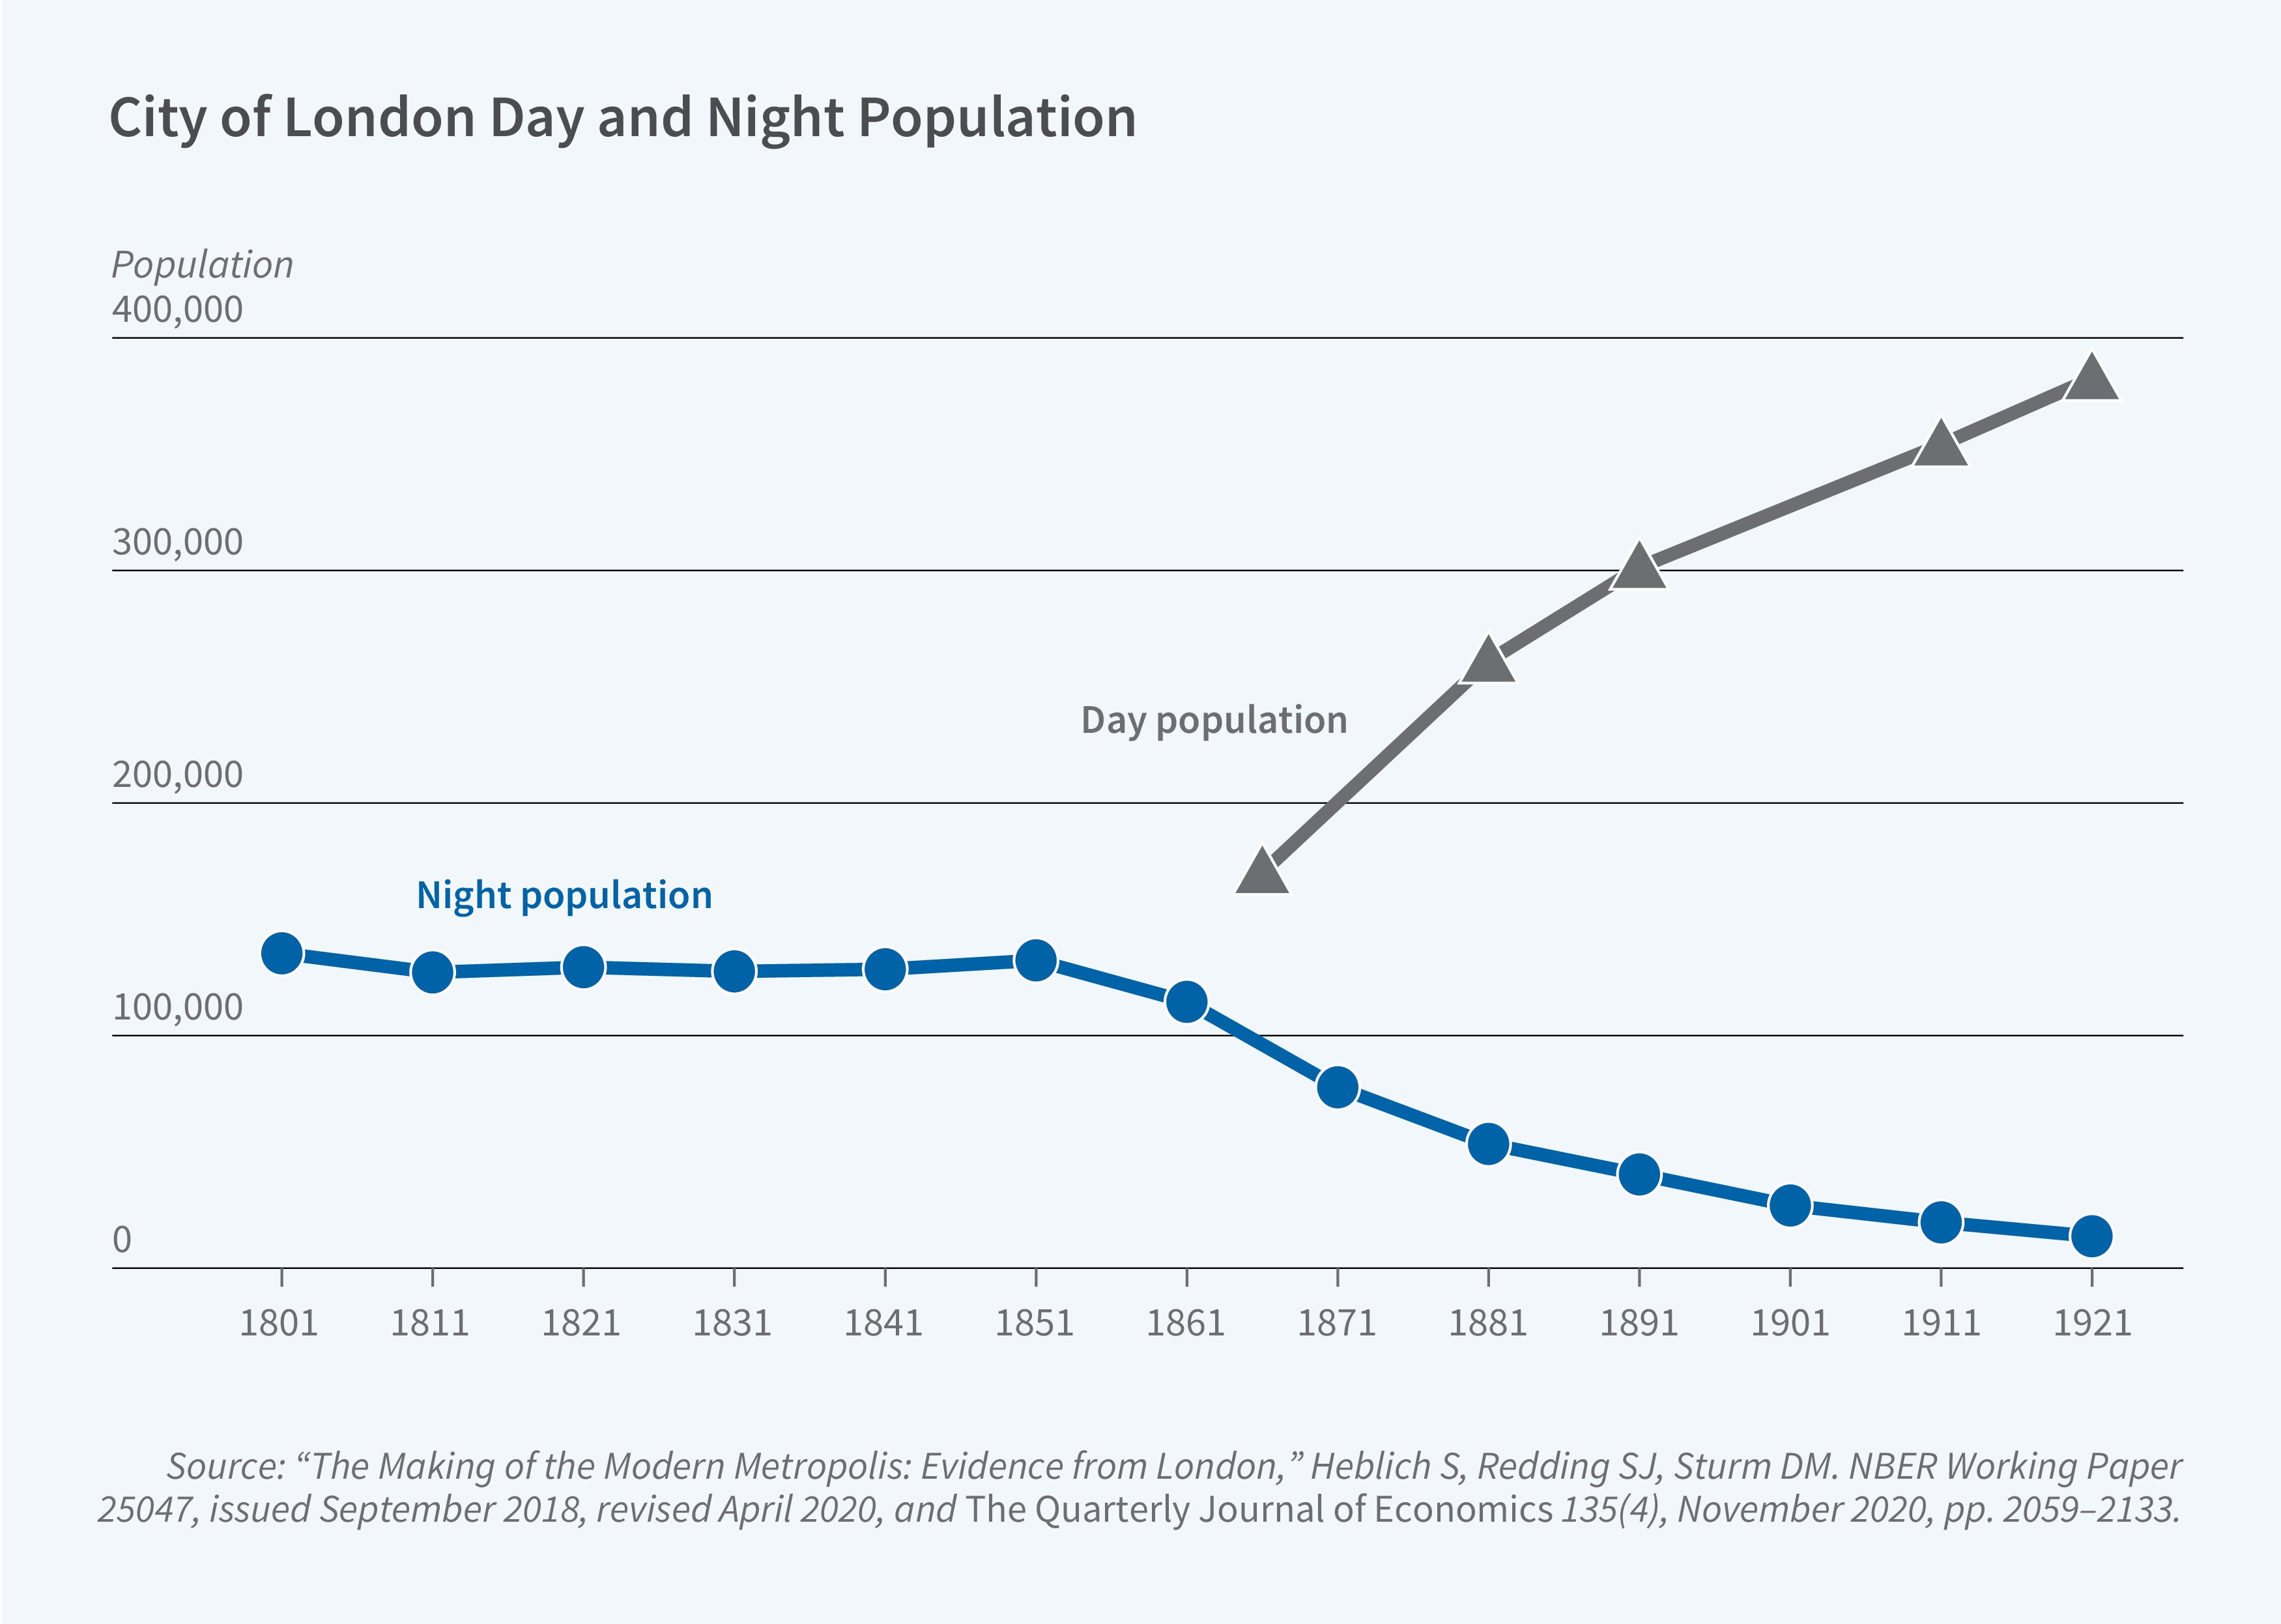
Transport therefore did not simply support urban growth. It changed the internal structure of cities. By decoupling production from residence, it allowed cities to expand spatially while maintaining high levels of economic concentration. This increased the scale at which agglomeration forces could operate, since firms could cluster in highly productive locations without being constrained by the need for workers to live nearby. The persistence of these patterns differs across scales: While connections between cities can be partially substituted over time, the layout of transport within cities is much harder to change once density has increased. This durability reflects the fact that urban structures are embedded in physical capital, skills, and local networks, which are costly to reorganize.
Specialization and Its Consequences
Once commuting constraints were relaxed, agglomeration forces operated at a much larger scale. Cities could sustain dense concentrations of employment while drawing workers from a wider hinterland. This led to cumulative growth, with larger cities becoming more productive and attracting more activity. But it also generated increasing specialization as production concentrated in particular locations and cities became dominated by a narrow set of industries. As a result, cities that were initially similar began to diverge, depending on the industries in which they specialized.
The neighboring cities of Bradford and Leeds in the United Kingdom illustrate this divergence clearly. Similar in size and structure around 1800, they followed markedly different paths. Bradford specialized in worsted wool and initially prospered, becoming known as “Worstedopolis,” while Leeds developed a more diversified industrial base. Bradford’s specialization supported rapid expansion, but in the long run Leeds emerged as the more productive and adaptable city. Specialization within cities can improve efficiency by allowing places to exploit comparative advantage, but excessive concentration within cities may limit adaptability.
This contrast highlights a central feature of urban dynamics. Specialization can generate strong short-run gains by allowing cities to exploit comparative advantage and deepen sector-specific knowledge. But it also narrows the local economic structure, reducing the scope for new combinations across activities when technologies or markets shift. Diversified cities, while potentially less efficient in the short run, often prove more adaptable over longer horizons, a pattern consistent with early evidence linking urban diversity to subsequent growth.3,4,5
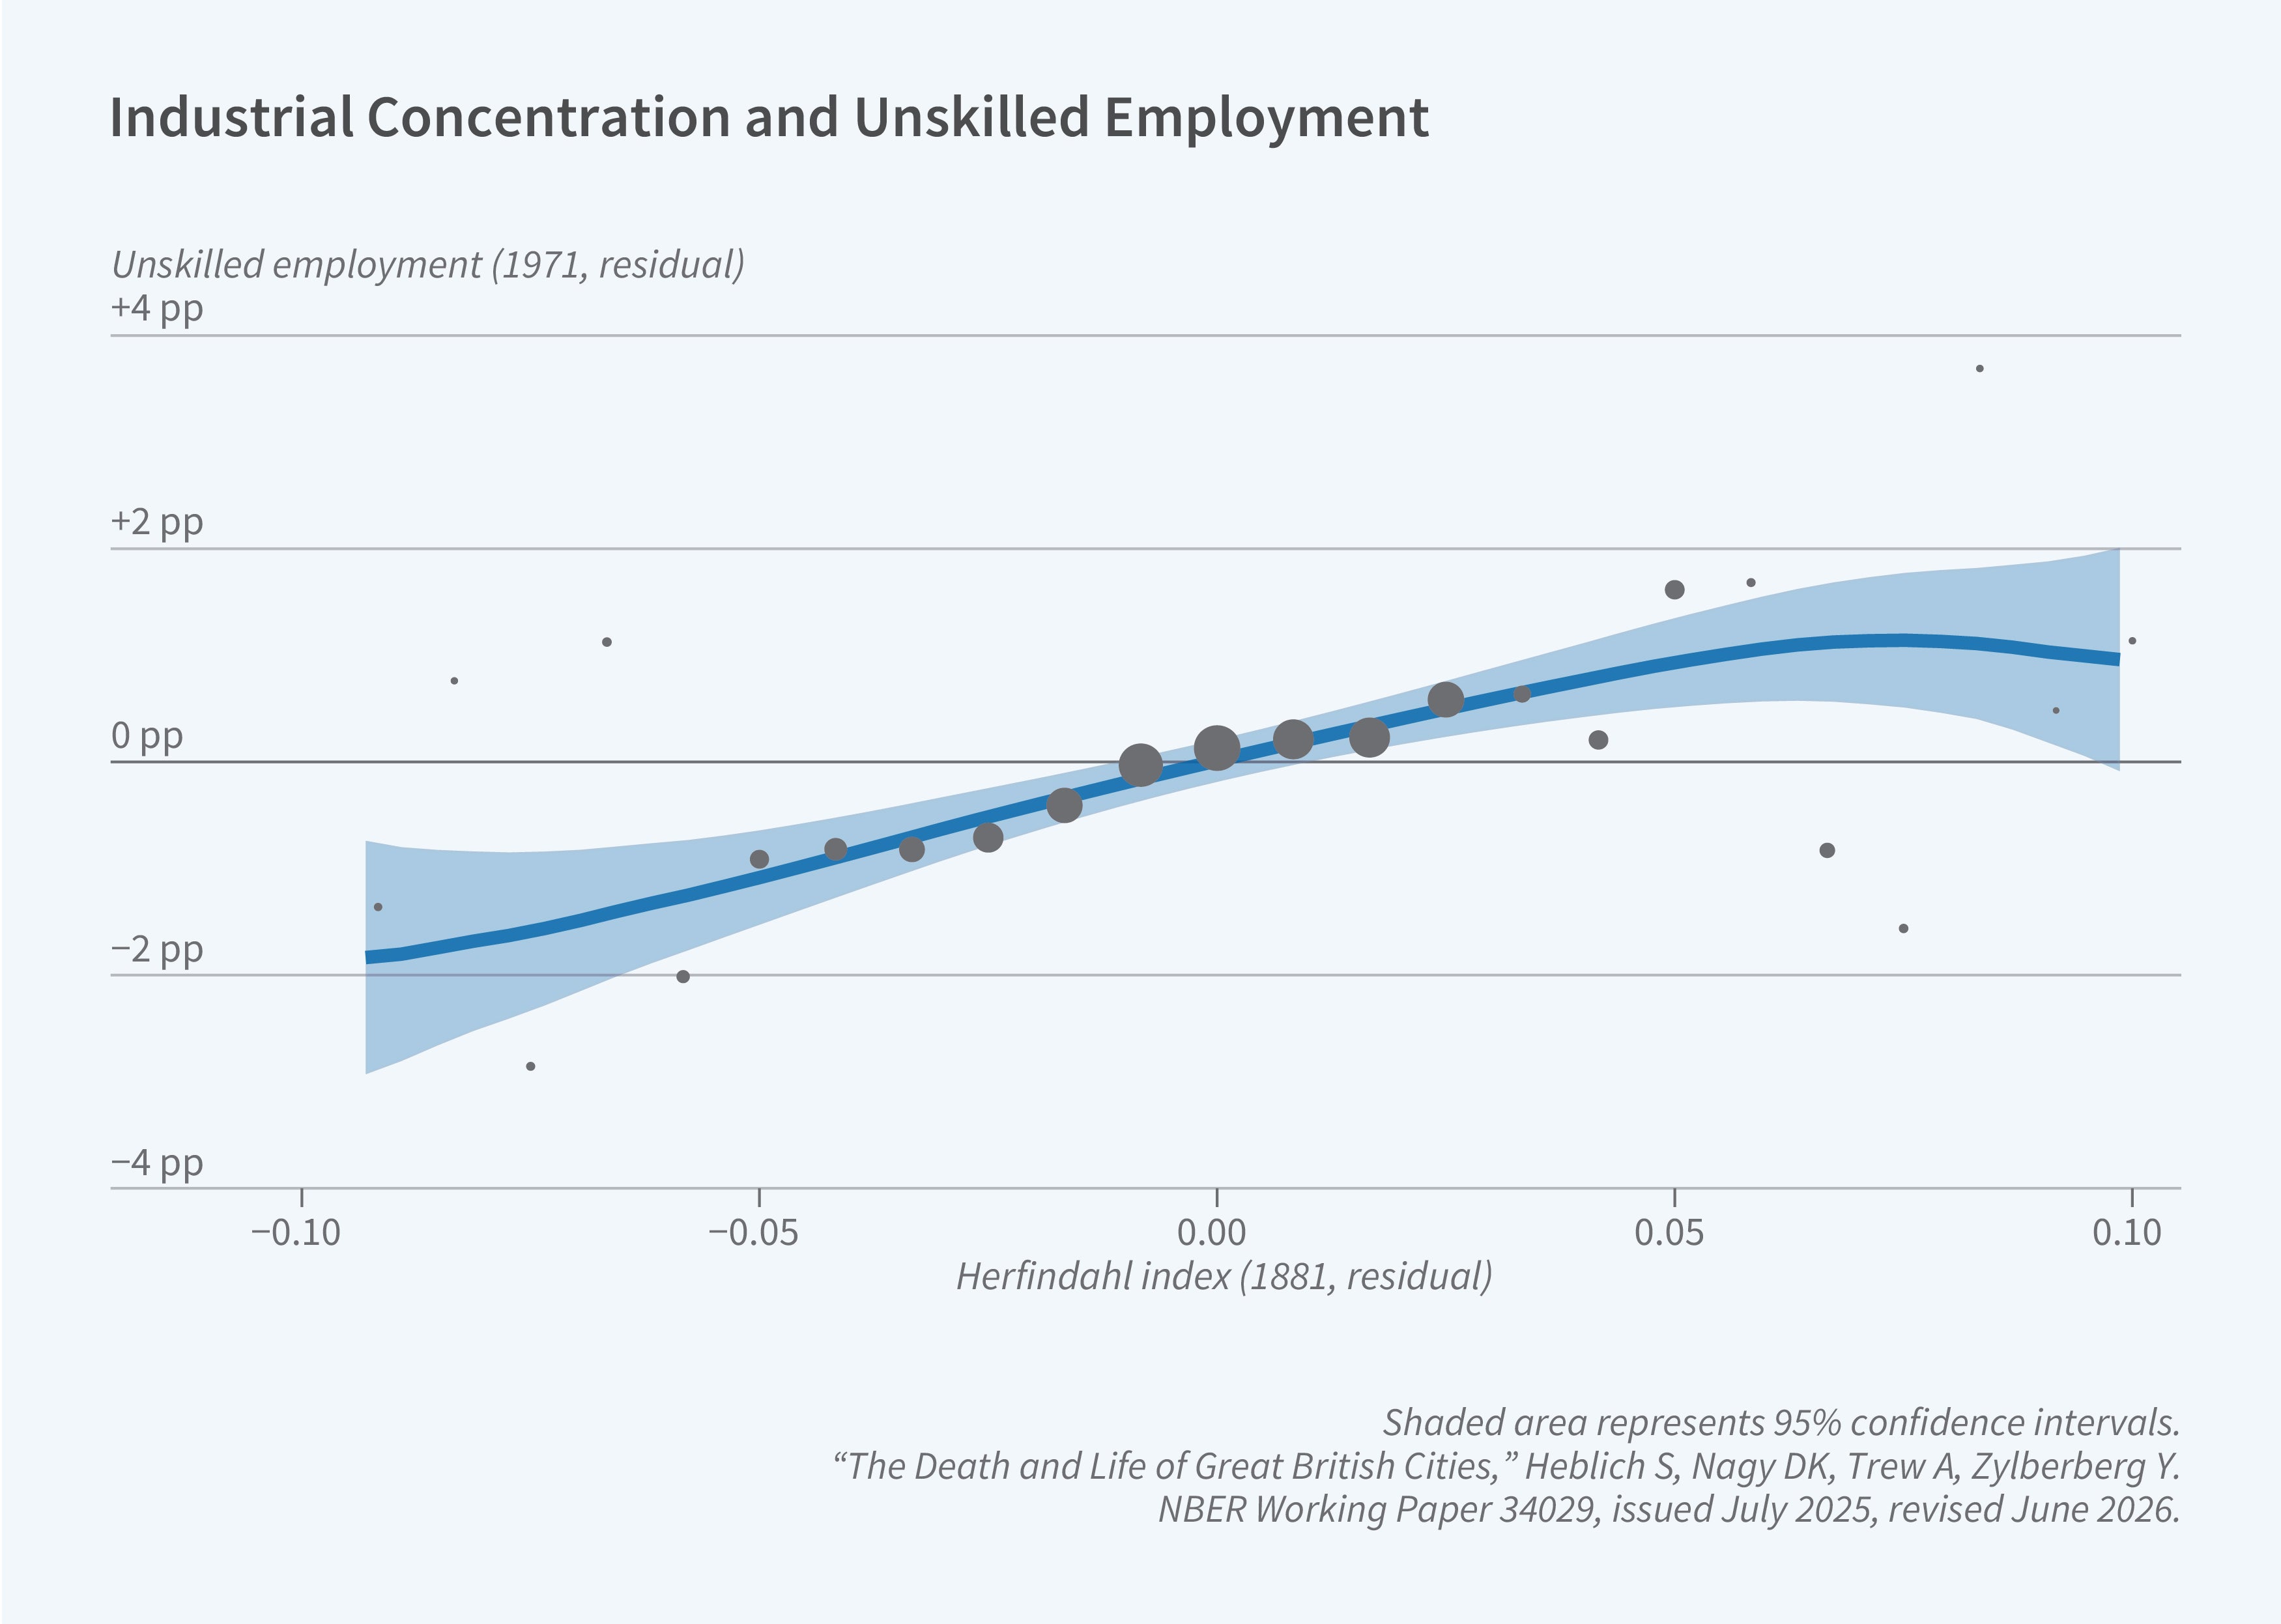
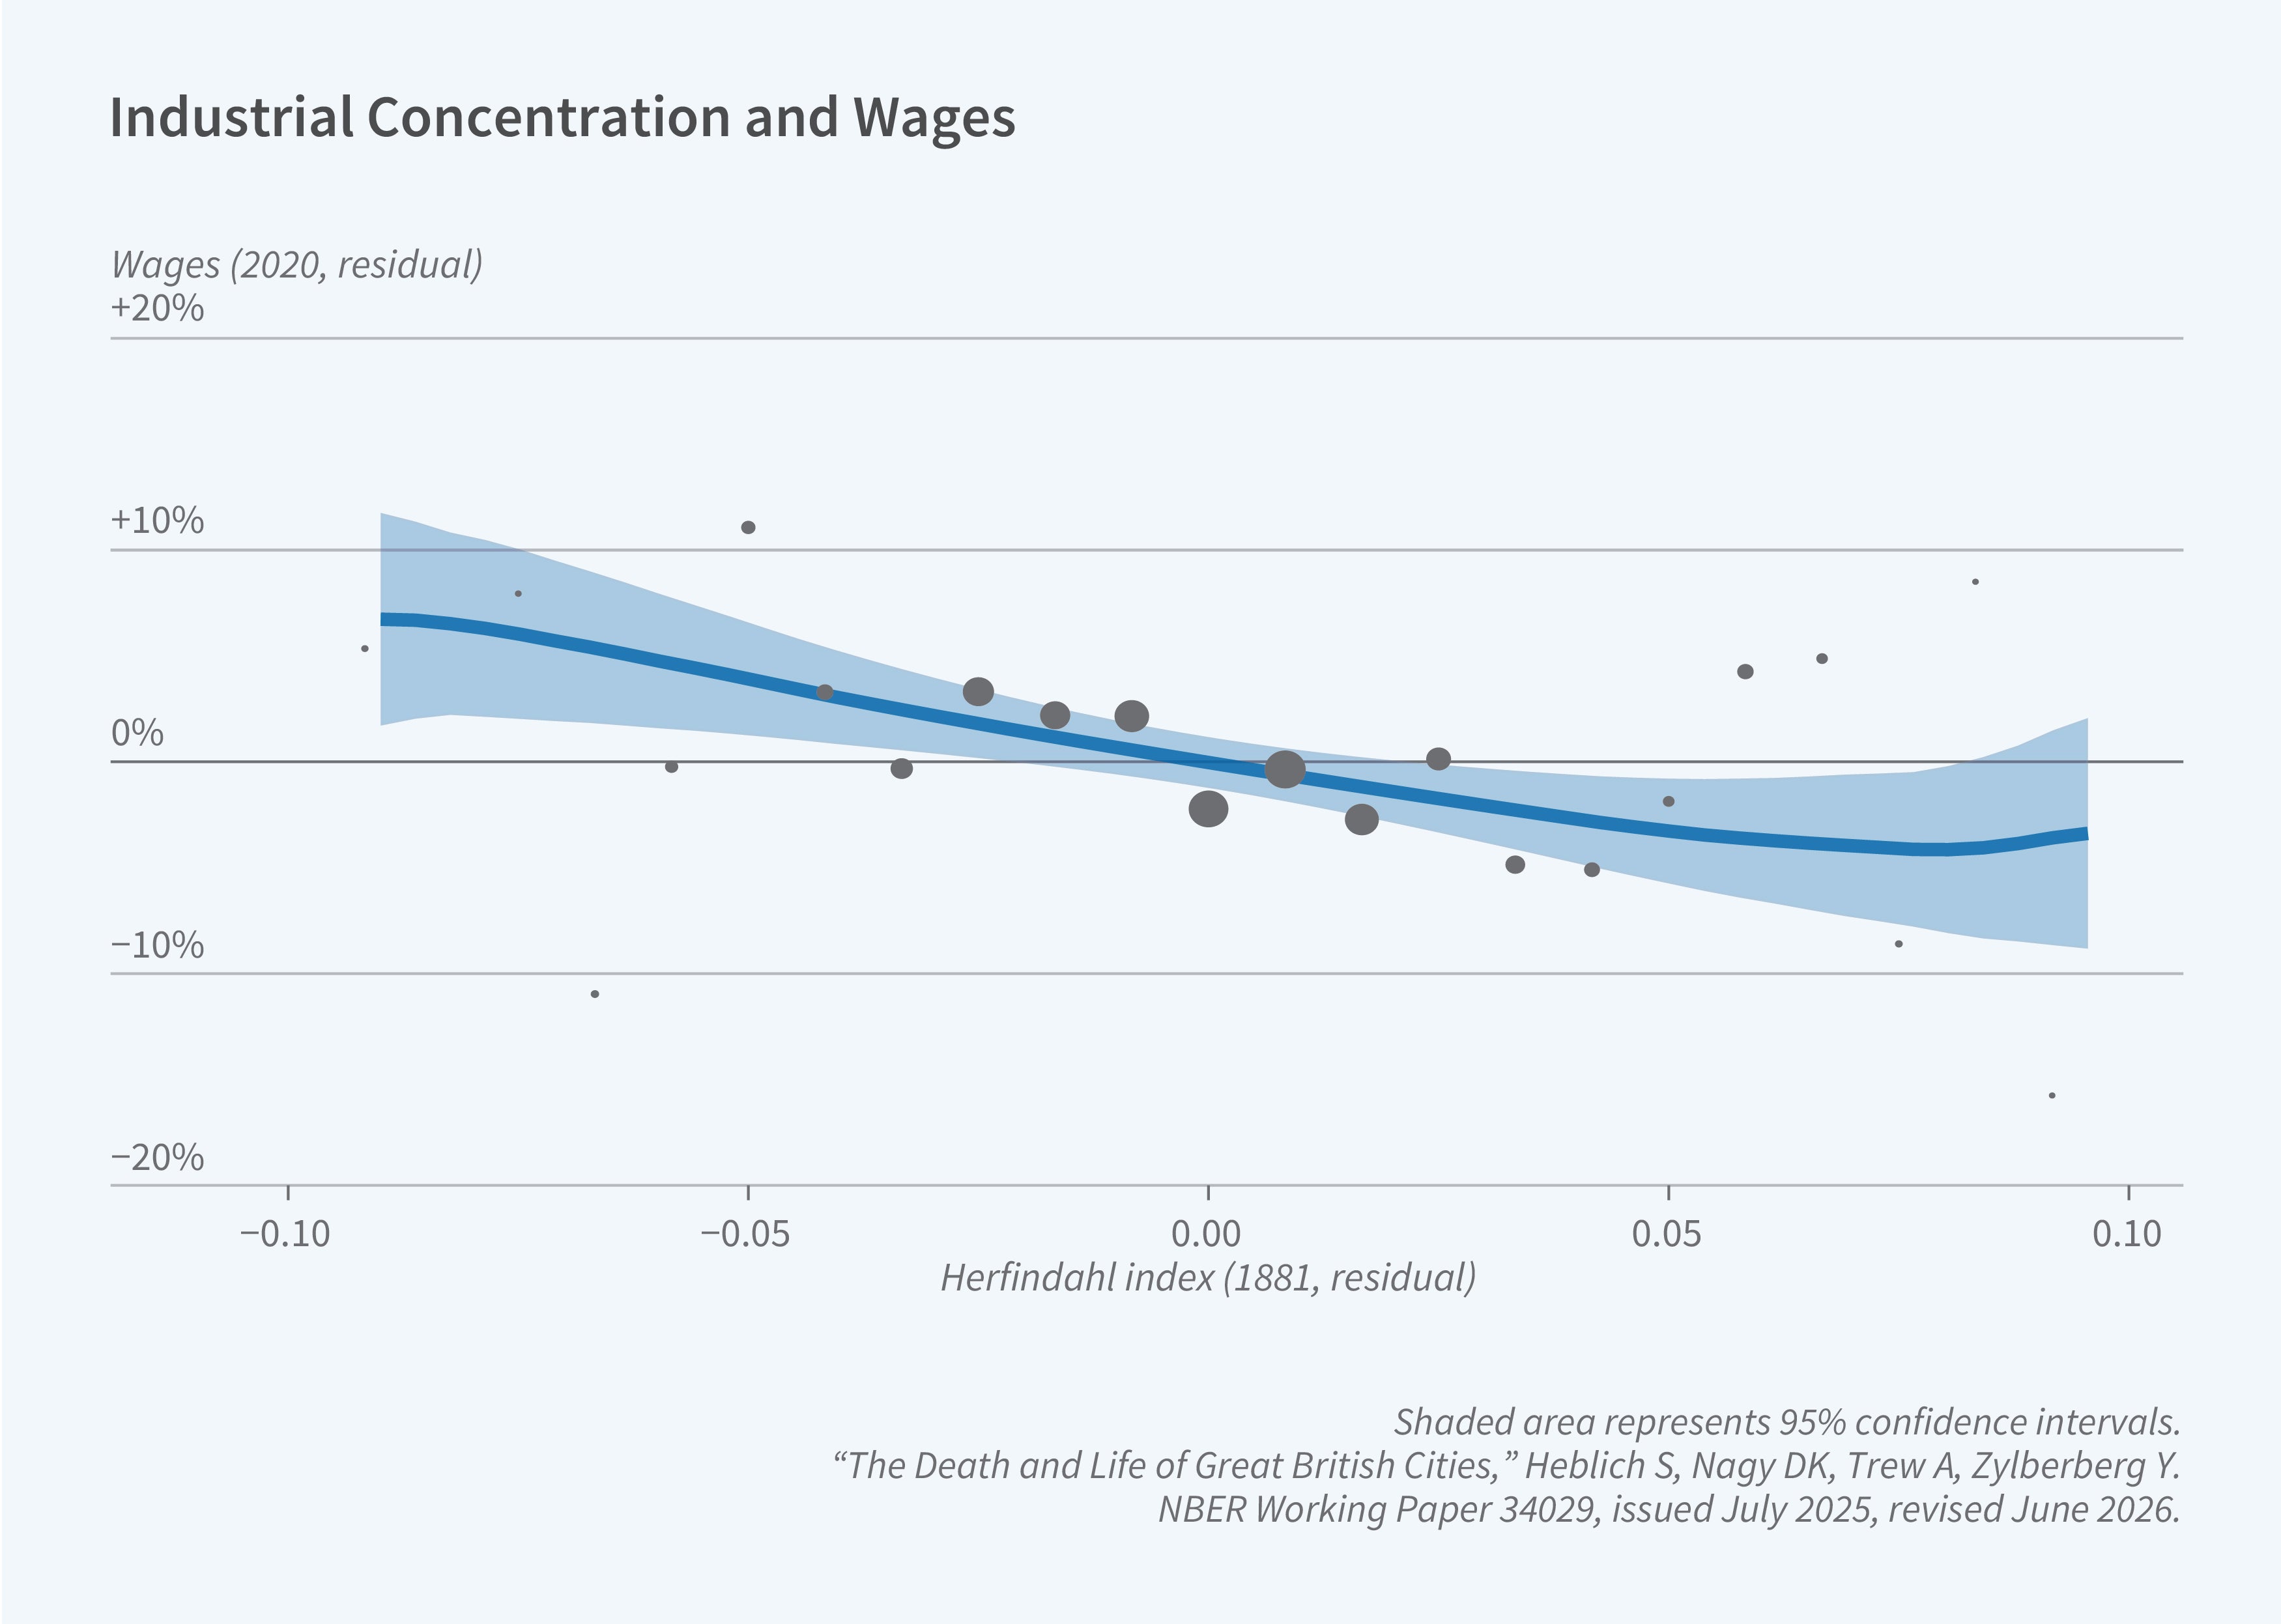
This pattern is visible more broadly across English cities. Figures 2 and 3 link initial industrial concentration to subsequent outcomes.6 Figure 2 shows that cities that were more specialized in the late nineteenth century were less attractive to skilled workers by 1971, even before the substantial decline in Britain’s manufacturing employment. Figure 3 shows the longer-run effect using recent wage data. The estimated gradients imply that cities with lower initial specialization, with a Herfindahl index around 0.05, had about 1.5 percentage points fewer unskilled workers in 1971 and about 4 percent higher wages than more specialized cities with an index of 0.15.
This pattern is not unique to England. Cross-country evidence shows that cities more specialized in manufacturing at their peak experienced larger subsequent declines in employment, with substantial heterogeneity in recovery across places.7 Evidence from large industrial investments provides further insight into the underlying mechanism. China offers a particularly useful example, having undergone similar dynamics in a compressed time frame. In the 1950s, large-scale industrial plants were established as part of a coordinated industrialization program. During the subsequent decades, these locations experienced rapid growth, and by the early 1980s they exhibited substantially higher productivity than comparable regions, reflecting the concentration of activity around large, technologically advanced plants.8
Following the transition to a market economy, however, these advantages eroded. This reversal is visible in the evolution of industrial activity, with treated locations experiencing an initial rise followed by a relative decline over time. The pattern reflects the same mechanism. By 2010, the initially favored locations had fallen behind. While the flagship plants themselves remained productive, surrounding firms exhibited low productivity, limited innovation, and high markups. Production became increasingly concentrated along the supply chains of dominant industries, with little scope for new activities to emerge. The local economic structure narrowed, reducing spillovers across sectors and weakening entrepreneurial activity. This evidence highlights how specialization shapes long-run outcomes.
The Asymmetry: Rapid Rise and Slow Decline
If transport infrastructure shapes specialization and long-run city trajectories, a natural question is what happens when infrastructure is removed. Does disinvestment simply unwind the earlier transformation, or does it have distinct and lasting effects? The evidence suggests the latter. A rare opportunity to observe this comes from large-scale rail disinvestment in the United Kingdom.9 In the 1950s and 1960s, the so-called Beeching cuts led to the closure of around one-third of the railway network and more than half of all stations. Many of the affected lines served places that were already in relative decline, so the cuts largely followed broader structural change. In that sense, they can be interpreted as a negative shock to market access, similar to settings studied in the economic geography literature.10,11 If infrastructure effects were fully reversible, removing these connections should mainly have reflected that ongoing adjustment.
Instead, areas that lost rail access experienced long-lasting declines in population, employment, and the share of skilled workers, even after accounting for broader structural change and the reallocation of activity across space. These were not short-run adjustments. The losses persisted for decades, indicating that reduced access was associated with weaker local performance relative to comparable places, rather than simply reflecting ongoing trends.
This persistence reflects the role of agglomeration economies in shaping adjustment in a setting without strong local interactions; decline in access would simply lead firms and workers to relocate, and activity would reallocate quickly across space. But when productivity depends on proximity to other firms and workers, this adjustment is slower. Firms remain tied to local supply chains, workers to location-specific skills and networks, and housing to existing patterns of use. As a result, economic activity does not immediately move to more productive locations. Instead, it declines in place. Micro-level evidence shows that durable housing, local amenities, and social networks make places slow to adjust.12,13 In this sense, transport infrastructure can support rapid growth by improving access, but the spatial structures it creates adjust only slowly when that access is reduced.
Persistence and the Limits of Policy
These dynamics have direct implications for how to think about urban policy. Place-based interventions such as infrastructure investment, industrial policy, or regional development programs can generate large and durable effects, but these effects are not easily redirected once they have taken hold. Cities that became highly specialized through infrastructure-driven growth often experienced strong initial gains but faced challenges as technologies and markets changed. Bradford is one example; the formerly dominant industrial cities of the American Midwest are another. In each case, the forces that generated early success—agglomeration, specialization, and deep sector-specific investment—also made subsequent adaptation more difficult. Diversification was constrained not by a lack of effort, but by the inherited structure of local economies built around dominant activities. These effects arise because agglomeration economies create externalities that individual firms and workers do not internalize, generating complementarities across firms and workers that make adjustment inherently slow.
This points to an intertemporal tension in urban development. Policies that reinforce comparative advantage and promote specialization can generate substantial short-run gains, but they may reduce adaptability by narrowing the range of activities within a city. More diversified structures, while potentially less efficient in the short run, tend to support stronger long-run performance by facilitating innovation and adjustment.
From a policy perspective, the asymmetry between rapid rise and slow decline cuts both ways. Slow decline can soften the immediate impact of negative shocks, but it also means that misallocation can persist for long periods. Agglomeration economies both support growth and slow adjustment: Places do not quickly reset when conditions change but remain tied to past structures, delaying adjustment and prolonging divergence across regions.
If infrastructure investment shapes economic geography in ways that persist long after the investment itself has become obsolete, then the stock of past decisions weighs heavily on the present. Today’s spatial distribution of economic activity reflects not only current fundamentals but also the accumulated legacy of earlier choices about transport and industrial organization.
Endnotes
“The Death and Life of Great British Cities,” Heblich S, Nagy DK, Trew A, Zylberberg Y. NBER Working Paper 34029, issued July 2025, revised June 2026.
“The Making of the Modern Metropolis: Evidence from London,” Heblich S, Redding SJ, Sturm DM. NBER Working Paper 25047, issued September 2018, revised April 2020, and The Quarterly Journal of Economics 135(4), November 2020, pp. 2059–2133.
“Growth in Cities,” Glaeser EL, Kallal HD, Scheinkman JA, Shleifer A. NBER Working Paper 3787, July 1991, and Journal of Political Economy 100(6), December 1992, pp. 1126–1152.
“Industrial Development in Cities,” Henderson JV, Kuncoro A, Turner M. NBER Working Paper 4178, October 1992, and Journal of Political Economy 103(5), October 1995, pp. 1067–1090.
“Nursery Cities: Urban Diversity, Process Innovation, and the Life Cycle of Products,” Duranton G, Puga D. American Economic Review 91(5), December 2001, pp. 1454–1477.
“The Death and Life of Great British Cities,” Heblich S, Nagy DK, Trew A, Zylberberg Y. NBER Working Paper 34029, issued July 2025, revised June 2026.
“The World’s Rust Belts: The Heterogeneous Effects of Deindustrialization on 1,993 Cities in Six Countries,” Gagliardi L, Moretti E, Serafinelli M. NBER Working Paper 31948, December 2023.
“Industrial Clusters in the Long Run: Evidence from Million-Rouble Plants in China,” Heblich S, Seror M, Xu H, Zylberberg Y. NBER Working Paper 30744, December 2022, and forthcoming in The Review of Economic Studies.
“The Spatial Impacts of a Massive Rail Disinvestment Program: The Beeching Axe,” Gibbons S, Heblich S, Pinchbeck EW. NBER Working Paper 32800, August 2024, and Journal of Urban Economics 143, August 2024, Article 103691.
“The Costs of Remoteness: Evidence from German Division and Reunification,” Redding SJ, Sturm DM. American Economic Review 98(5), December 2008, pp. 1766–1797.
“Railroads and American Economic Growth: A ‘Market Access’ Approach,” Donaldson D, Hornbeck R. NBER Working Paper 19213, July 2013, and The Quarterly Journal of Economics 131(2), May 2016, pp. 799–858.
“East-Side Story: Historical Pollution and Persistent Neighborhood Sorting,” Heblich S, Trew A, Zylberberg Y. Journal of Political Economy 129(5), May 2021, pp. 1508–1552.
“Rethinking Detroit,” Owens III R, Rossi-Hansberg E, Sarte P-D. NBER Working Paper 23146, February 2017, and American Economic Journal: Economic Policy 12(2), May 2020, pp. 258–305.