Unemployment in Informal Labor Markets in Developing Countries
Developing countries typically exhibit low rates of rural wage employment. For example, in India, male workers whose primary source of earnings is wage labor report working on only 46 percent of days per year.1 Bangladesh has a similarly low 55 percent rate of employment among landless males, and the rates are even lower in sub-Saharan Africa.2
What do these low employment rates mean? One possibility is that they reflect extremely high involuntary unemployment. Alternatively, the rates could be an outcome of reasonably well functioning labor markets in which workers are simply choosing self-employment, which tends to be high in poor countries. These two possibilities have drastically different implications for understanding how well labor markets work and what role, if any, there is for policy intervention.
Our work has sought to characterize the functioning of labor markets in developing countries and examine microfoundations for why markets might not always be clear. In this summary, we focus on rural labor markets, with evidence primarily drawn from India. These markets are of intrinsic interest: they are the primary source of wage employment for over a billion people worldwide, including the world’s poorest, and their features — informal, decentralized spot markets for labor, where workers and employers match for short-term contracts — are ubiquitous in both rural and urban areas of poor countries. Consequently, many, though not all, lessons from this work likely apply more broadly in developing-country settings.
Staggering Involuntary Unemployment
We begin with the central question of whether low employment rates reflect involuntary or voluntary unemployment. We tackle this question with Yogita Shamdasani by developing a new empirical approach.3 We induce transitory hiring shocks in randomly selected Indian local labor markets — villages — by “removing” on average 24 percent of male workers by giving them factory jobs in sites outside of the village for two to four weeks. This shock substantively reduces the number of workers in the local village economy without changing labor demand within the village. Looking at the local labor market response to our hiring shock enables us to learn how many people wanted a job at the prevailing wage but could not find one before we intervened. Importantly, we learn this simply by observing the employment behavior of the remaining workers and employers.
We find distinctly different patterns of effects in “lean” versus “peak” months, reflecting seasonality in agricultural hiring. In lean months we detect severe rationing: at least one in four workers in the economy wants a wage job but cannot find one. Excluding our external factory jobs, removing a quarter of the labor force has no effect on lean season wages or aggregate employment. This is consistent with rationed workers filling the newly vacated job slots, leaving the total number of people holding a job unchanged. In contrast, in peak months the impact of our hiring shock matches a textbook supply and demand model: wages rise quickly — within a week — and aggregate employment in the village falls, so that each new job created in the external factory jobsites generates only 0.74 days of new work for laborers in the economy overall. Together, these findings present a more nuanced picture of informal labor markets: they have the capacity to be extremely agile and responsive, but also exhibit extremely high levels of labor rationing in lean months.
Our approach contrasts with how economists have typically measured unemployment to date: asking people in surveys whether they were looking for work but could not find it. It is unclear whether such survey self-reports are reliable.4 By basing our measurement on whether workers actually choose to work when job slots in the local economy open up, we obtain revealed preference estimates of rationing.
Our approach also lets us learn about self-employment. We find that many rationed workers are disguised as entrepreneurs: as soon as job slots open up in their village, entrepreneurs readily abandon their agricultural and nonagricultural businesses in order to take a wage job with a local employer. In lean months, at least 24 percent of self-employment stems from workers being rationed out of wage labor. Among farmers with small landholdings, this shift to self-employment is especially high: in lean months, at least 64 percent of work on small farms would not occur if those farmers could find wage jobs instead. Consequently, our results indicate that a substantial fraction of self-employment stems from poor labor market prospects rather than high growth opportunities. This can help us understand why broadly targeted interventions such as credit, wage subsidies, and training for microenterprises tend to generate low average returns.
These patterns indicate why answers to standard involuntary unemployment questions can be unreliable in developing countries, and more broadly in settings with self-employment or informal work like gig jobs. In employment surveys run by governments — in India, the US, and most other settings — workers are only classified as involuntarily unemployed if they are not engaged in any work activity. Since a rationed worker who cannot find wage work can turn to self-employment or a gig economy job to make some extra money, focusing on these standard questions can lead to drastic underestimation of labor rationing in the economy. We show that alternate employment status questions that take this into account can yield more accurate estimates.
But why is there so much labor rationing? If there are more workers who want jobs than there are jobs available, we would expect wages to fall until the supply of workers equals demand. Kaur documents that in rural India, wages are downwardly rigid.5 Specifically, while they rise in response to positive shocks, they do not fall in response to negative shocks, such as droughts. Kaur’s study shows that downward rigidity causes increased unemployment — arguably the first direct evidence of employment effects of wage rigidity in any setting.
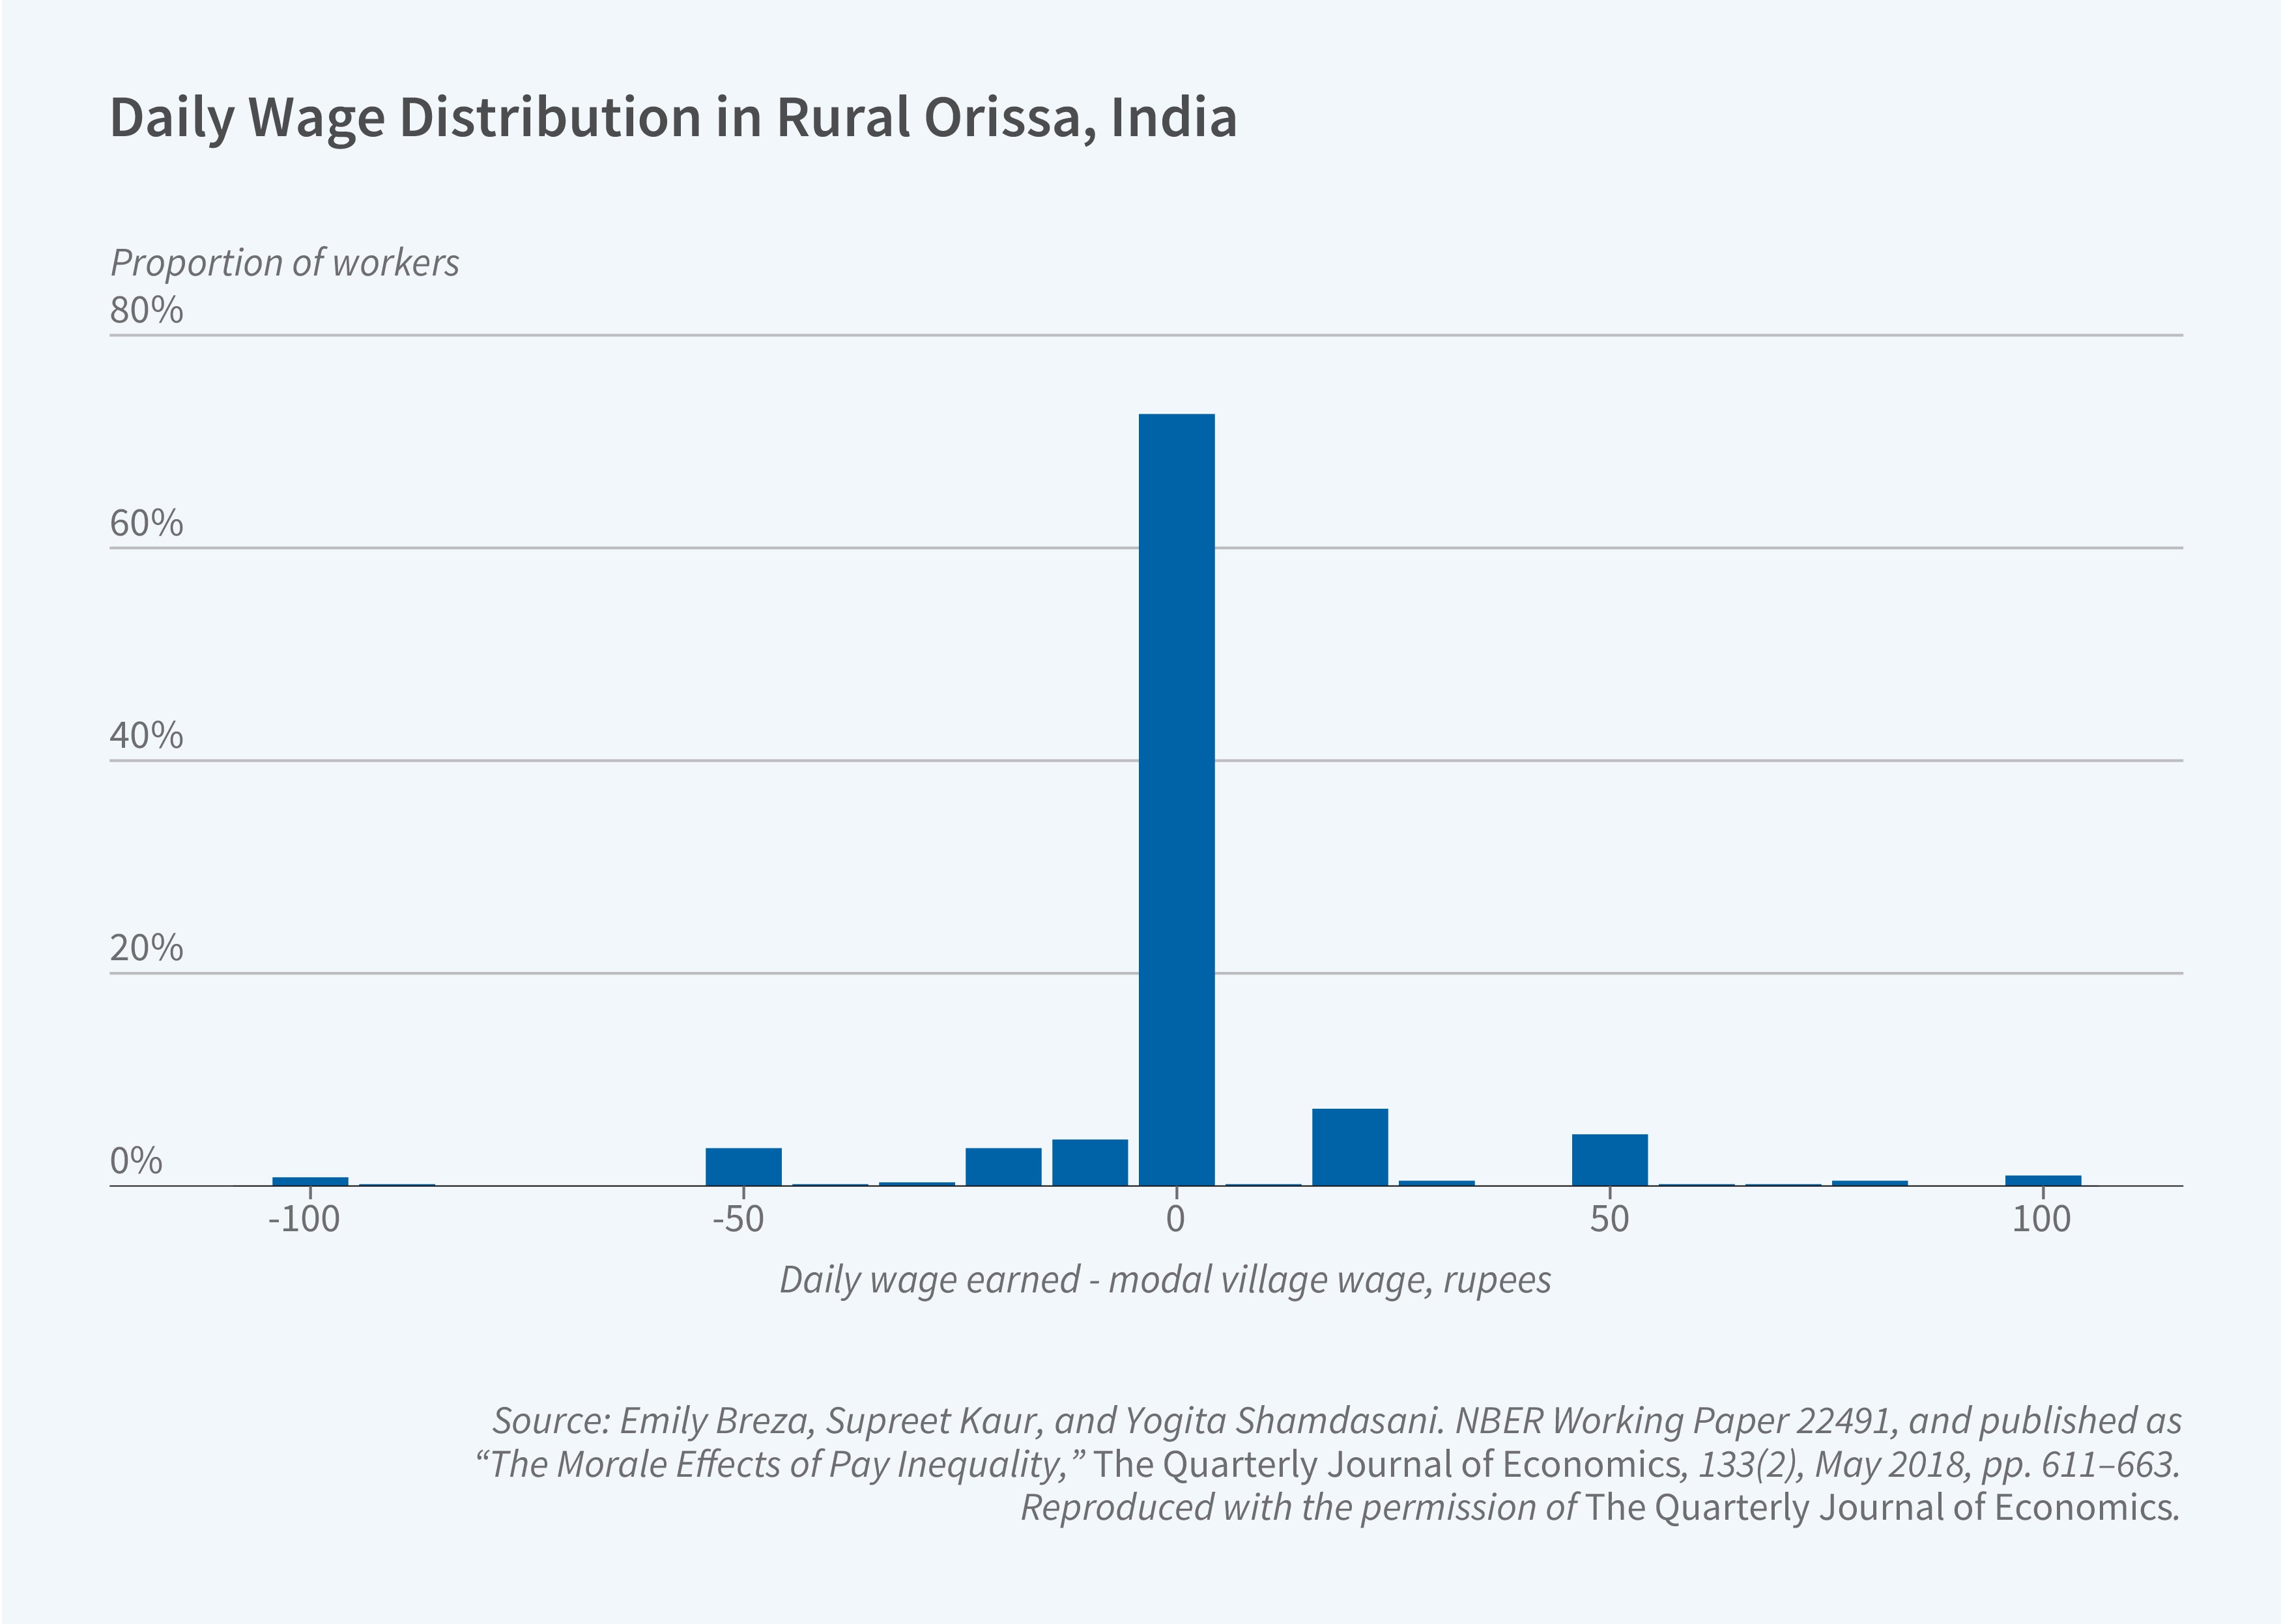
In addition to wage rigidity, wage compression also seems to be exhibited in labor markets in this setting: workers of varying abilities are paid the same wage. As we show in Figure 1, there tends to be a single prevailing wage for a given type of task in the economy, which most workers are paid despite differences in underlying ability. One consequence is that all workers agree on what the prevailing wage is for a task, a feature that plays an important role in labor market dynamics.
Market Power, Unemployment, and Social Forces
Informal labor markets often embody features we might associate with competitiveness and flexibility: there are many decentralized workers and employers, the short duration of contracts means that wages could quickly reflect changes in market conditions, there are no formal unions or institutions, and minimum wage laws are generally ignored. Why, then, do wages seem inflexible — over time, across people, and in response to shocks? Understanding this is key for understanding the high levels of unemployment.
Our research indicates that it is essential to account for one additional feature of these markets: workers are not anonymous to one another.6 They live in close-knit communities and are dependent on each other socially and economically — for example, through job referrals and informal insurance. This creates scope for individuals to use the threat of sanctions to sustain norms that are perceived to be in their collective interest.
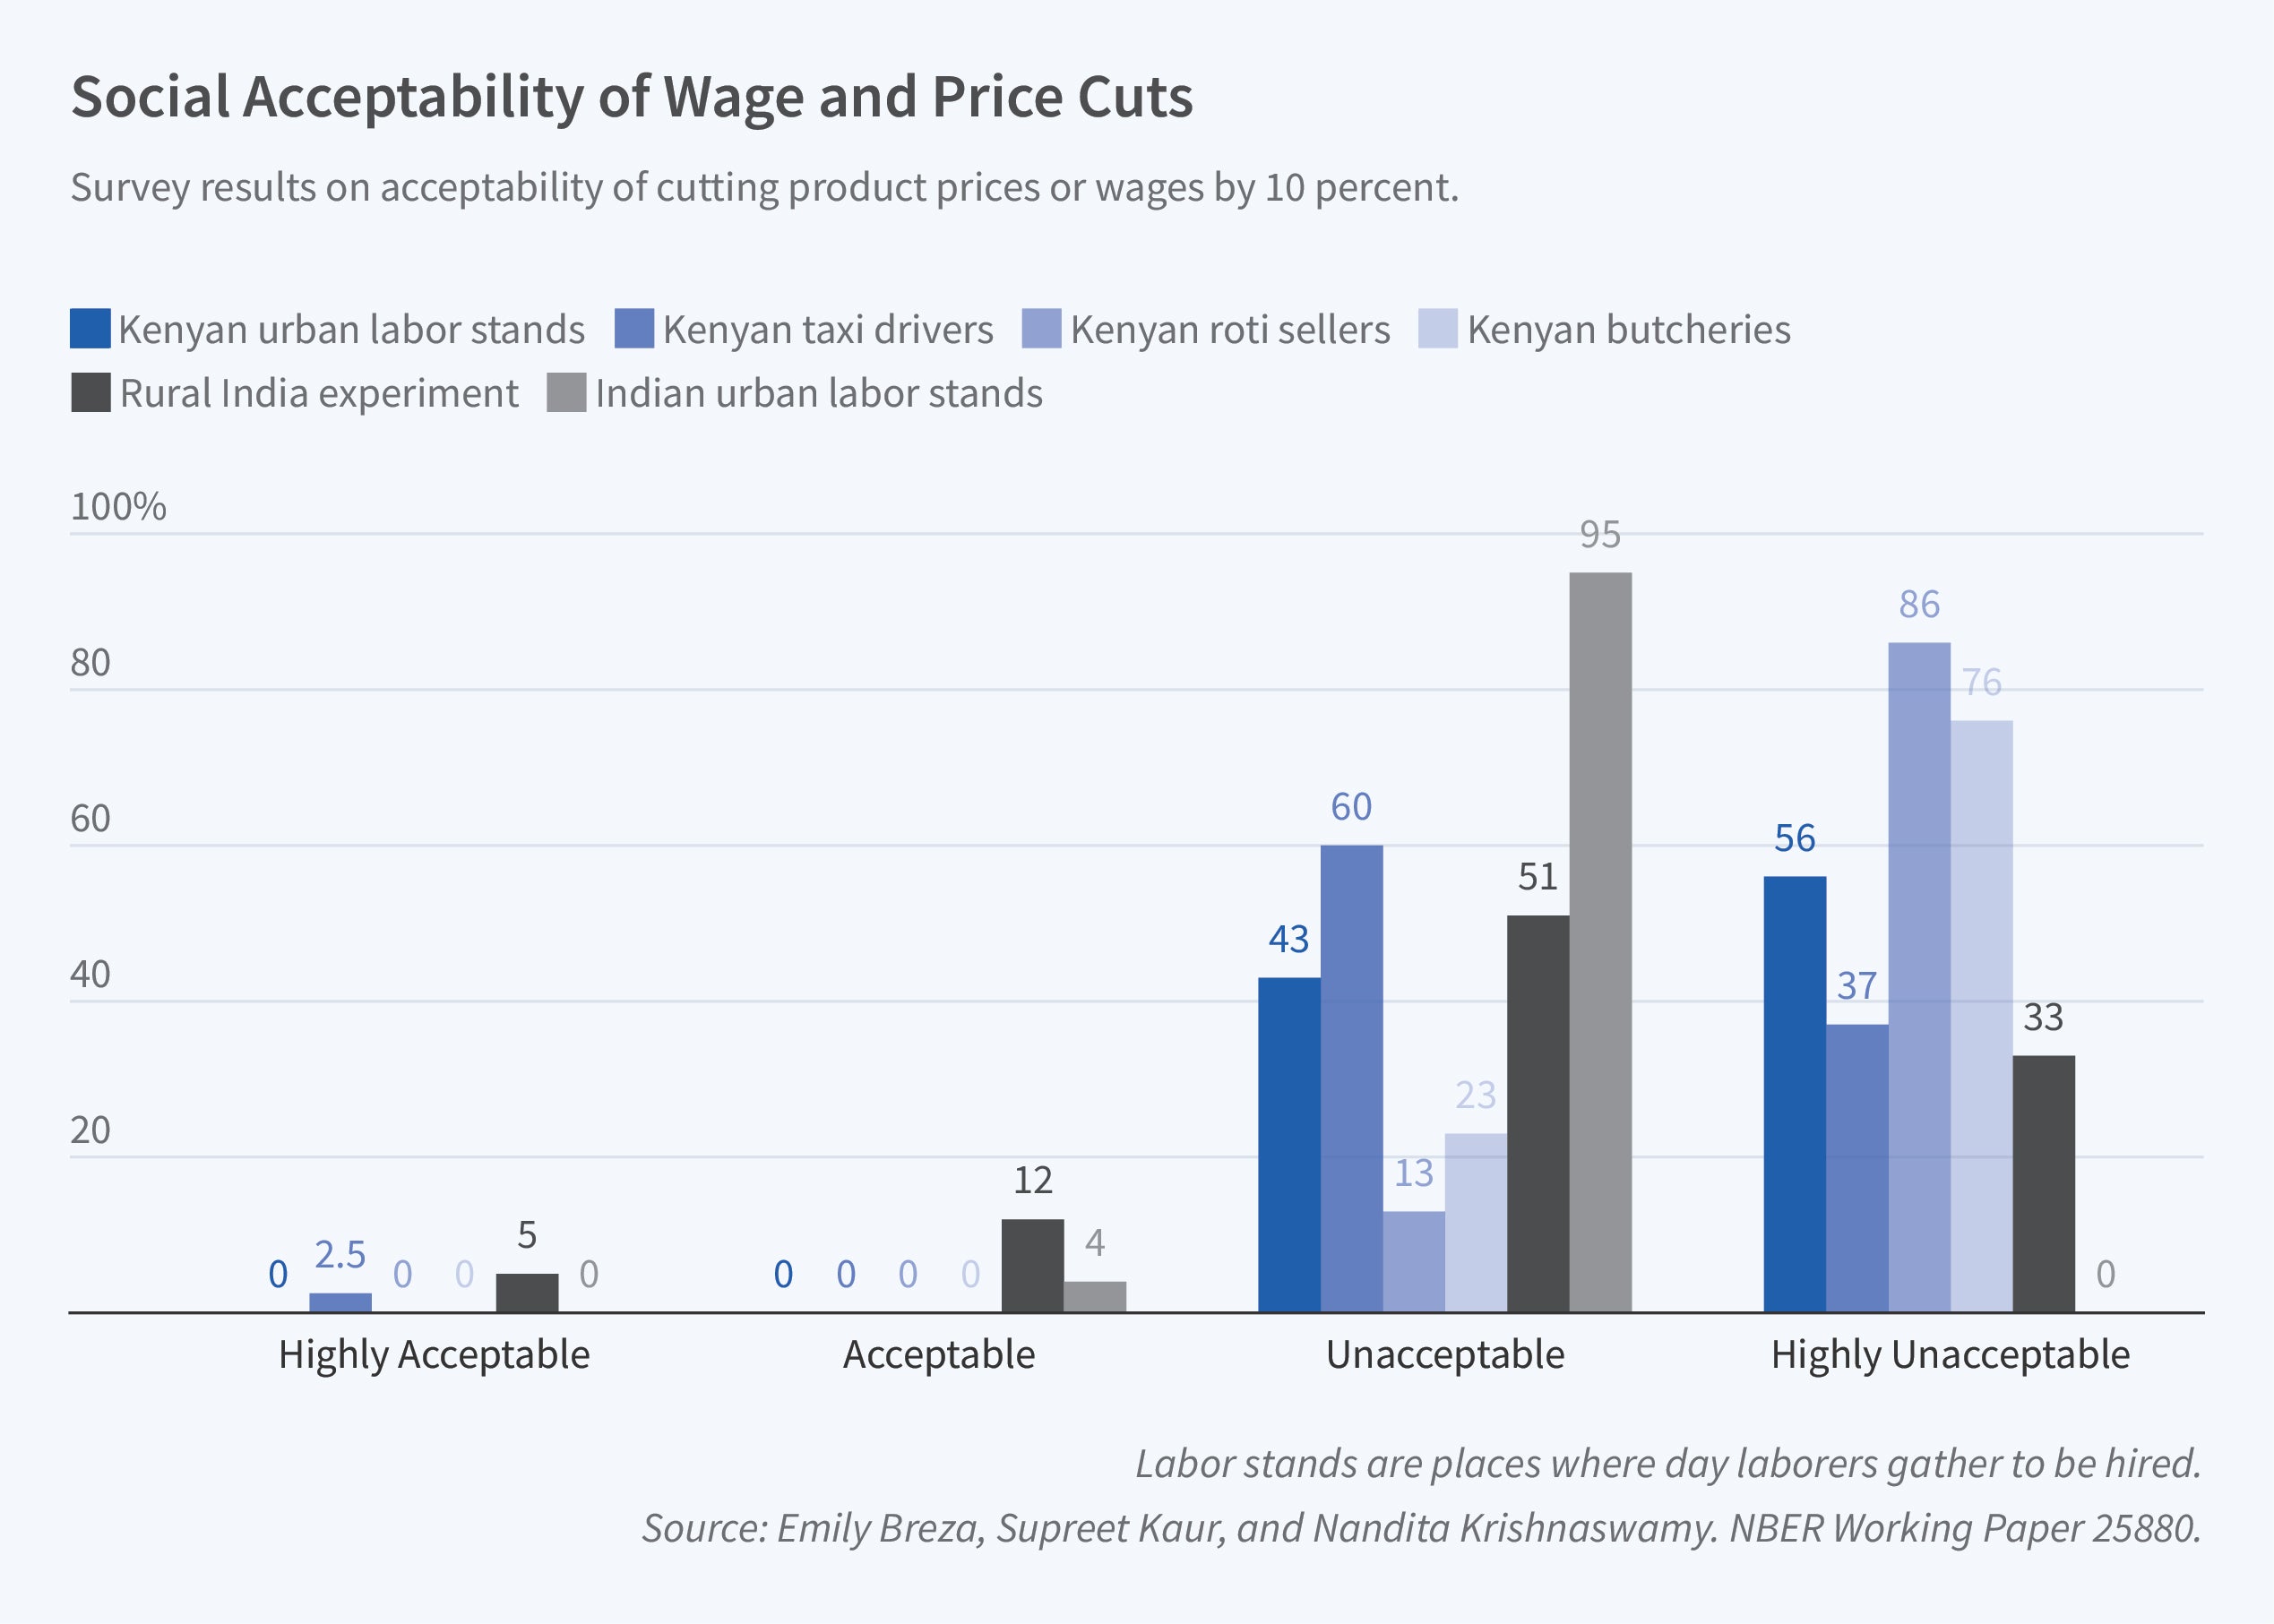
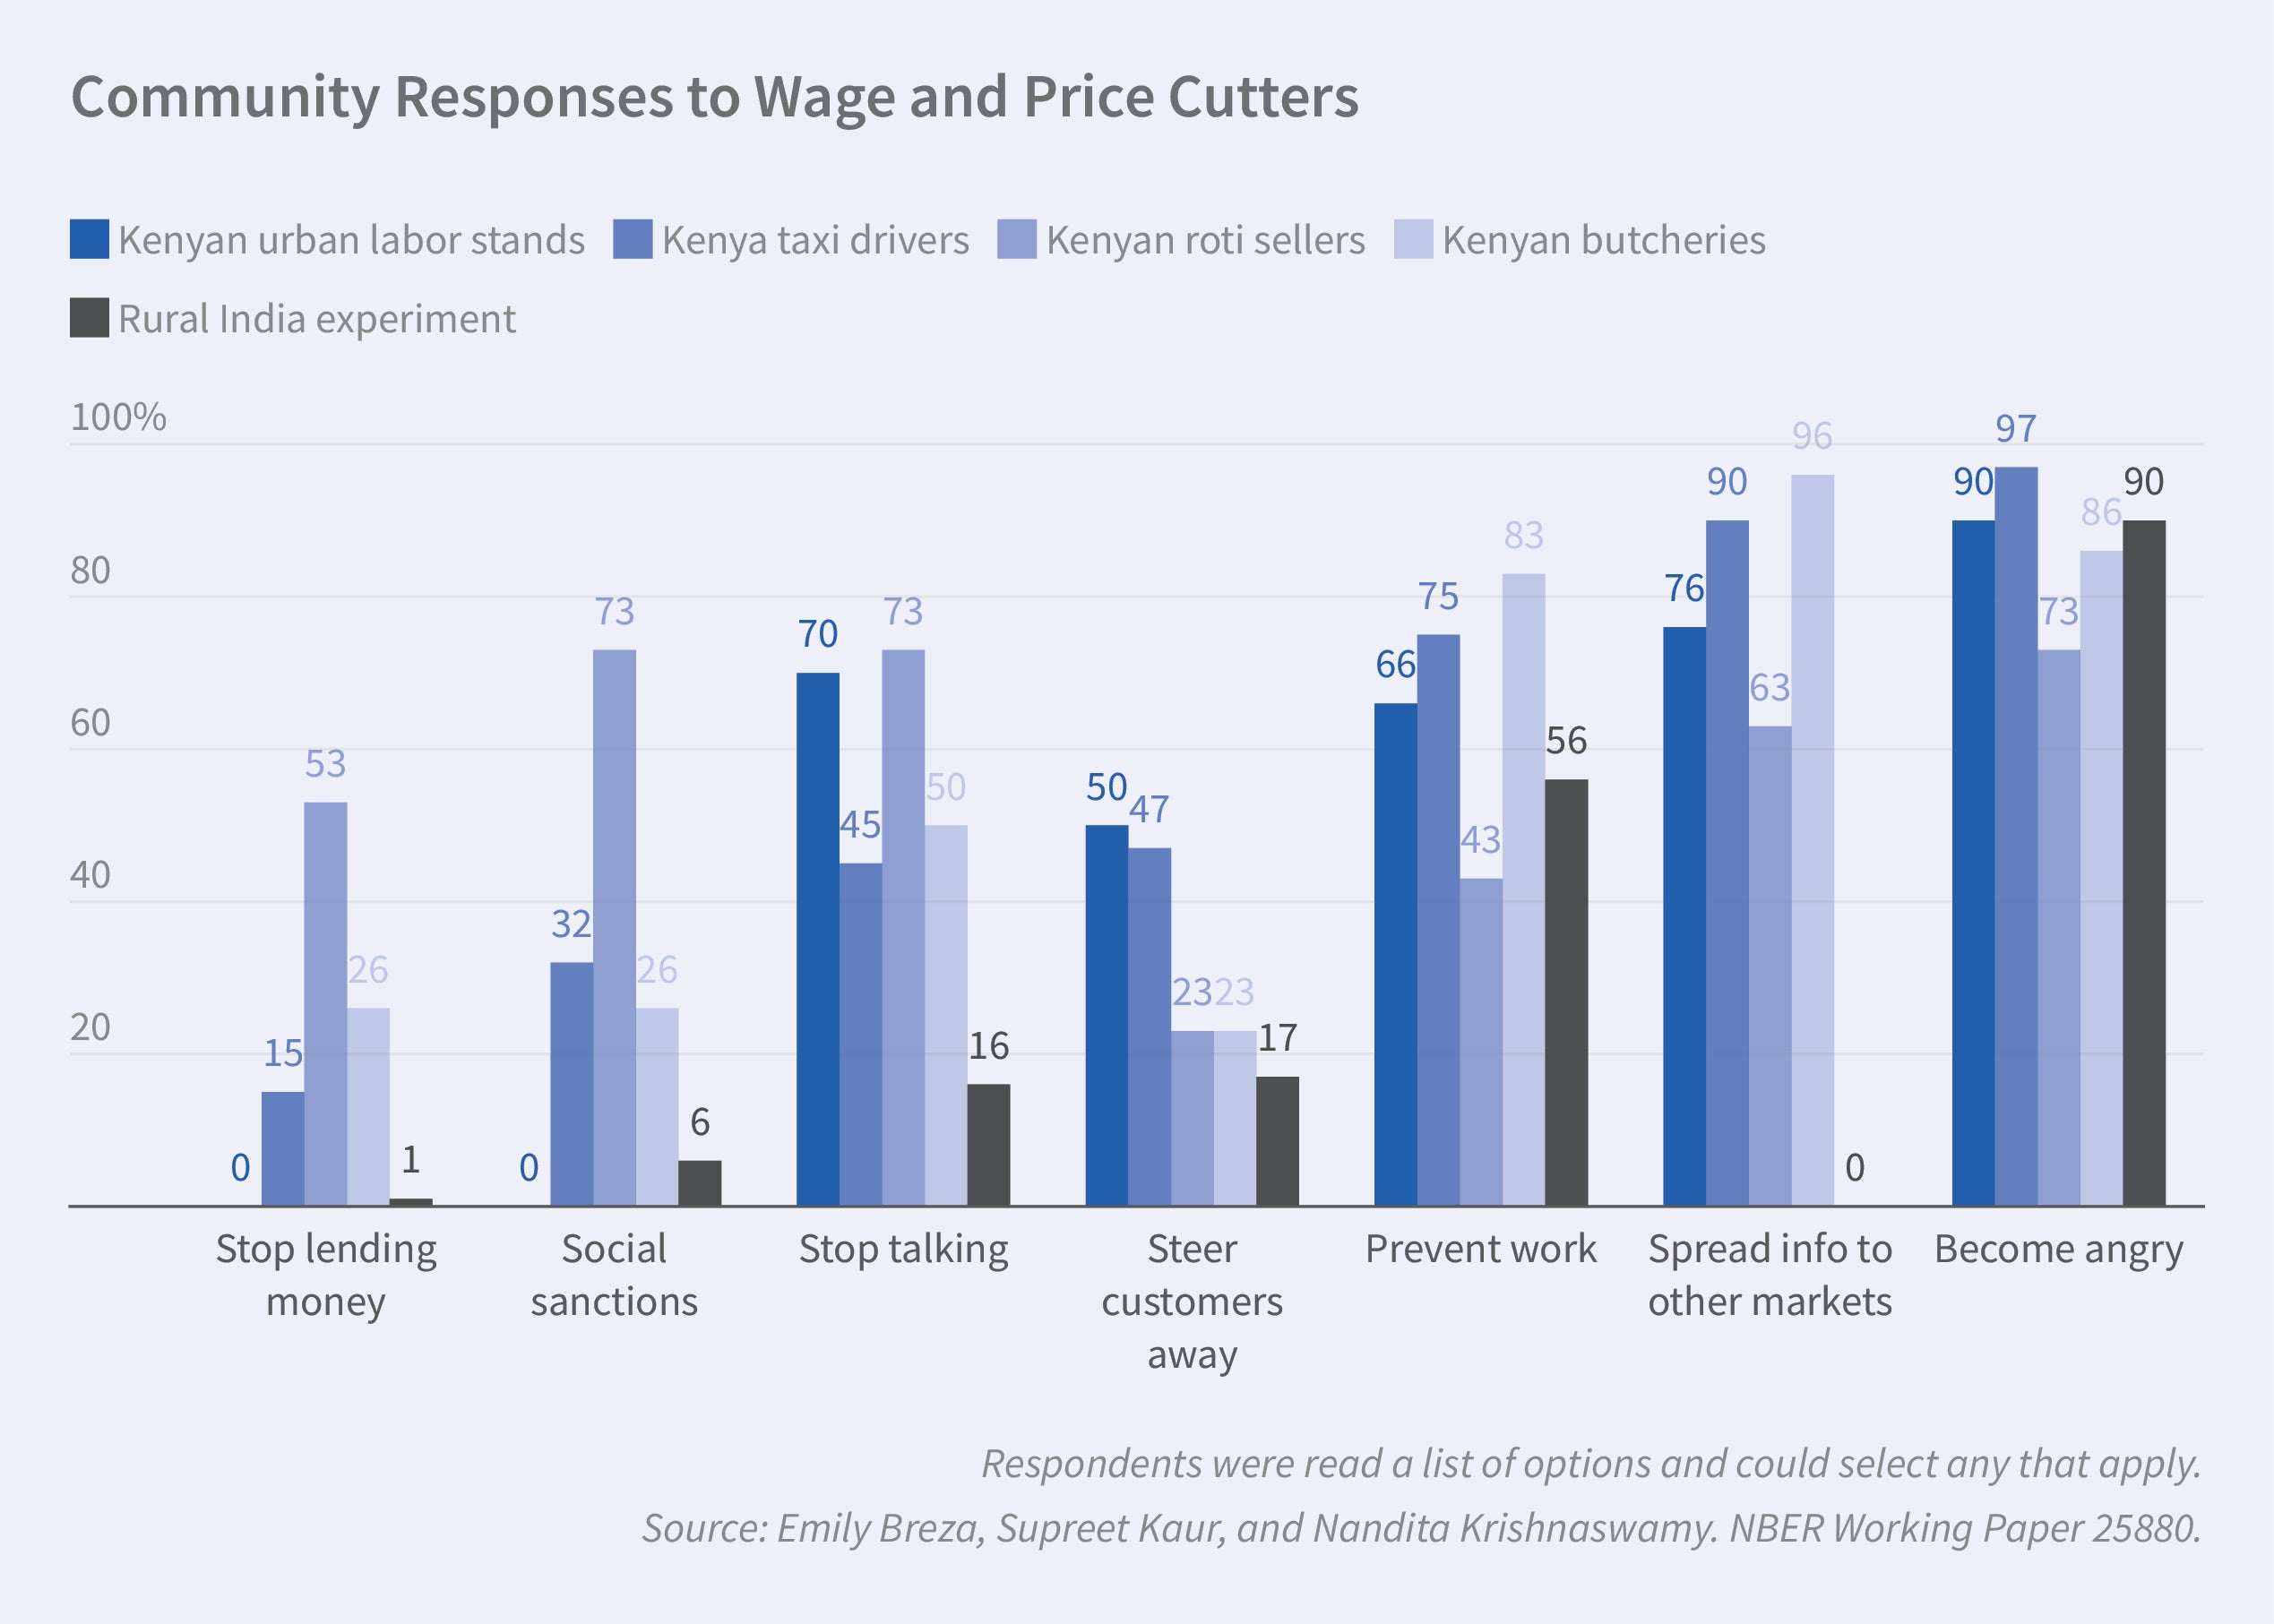
In work with Nandita Krishnaswamy, we document norms against accepting wage or price cuts in a range of markets in India and Kenya.7 In Figure 2, we show evidence from rural agricultural workers, construction workers at urban labor stands, taxi drivers, food vendors, and butchers. In each case, respondents state that undercutting the prevailing price is considered unacceptable [Panel A]. Doing so would result in a range of sanctions, from being socially ostracized to losing one’s source of livelihood [Panel B]. For example, 90 percent of rural workers respond that others would get angry with an individual who accepted a job below the prevailing wage and 59 percent believe others would impede the labor market prospects of that individual by means such as withholding referrals.
We then use a field experiment to examine whether norms against accepting wage cuts can help us understand the presence of wage floors in rural labor markets. Specifically, we hypothesize that during times of unemployment, at least some workers would prefer to work below the prevailing wage rather than remaining jobless, but do not due to the threat of sanctions from other workers.
We partner with local employers who make job offers for lean season agricultural work. Employers follow the typical process for agricultural hiring: traveling to the neighborhood where the majority of workers live and making job offers to workers at their homes. We randomize both the wage level of the offer and the degree of observability.
In the “public” treatment, which is the status quo for our setting, the employer offers the job outside on the street where neighbors, who are typically other workers, can overhear the offer, and could then tell other workers in the community. In the “employer” treatment, the wage offer is observable to the employer but not to others in the community. In the “private” condition, the job is offered inside the worker’s home and consequently is not directly observable to others in the community. After the conclusion of the experiment, participants received a supplement so that no one actually worked below the prevailing wage.
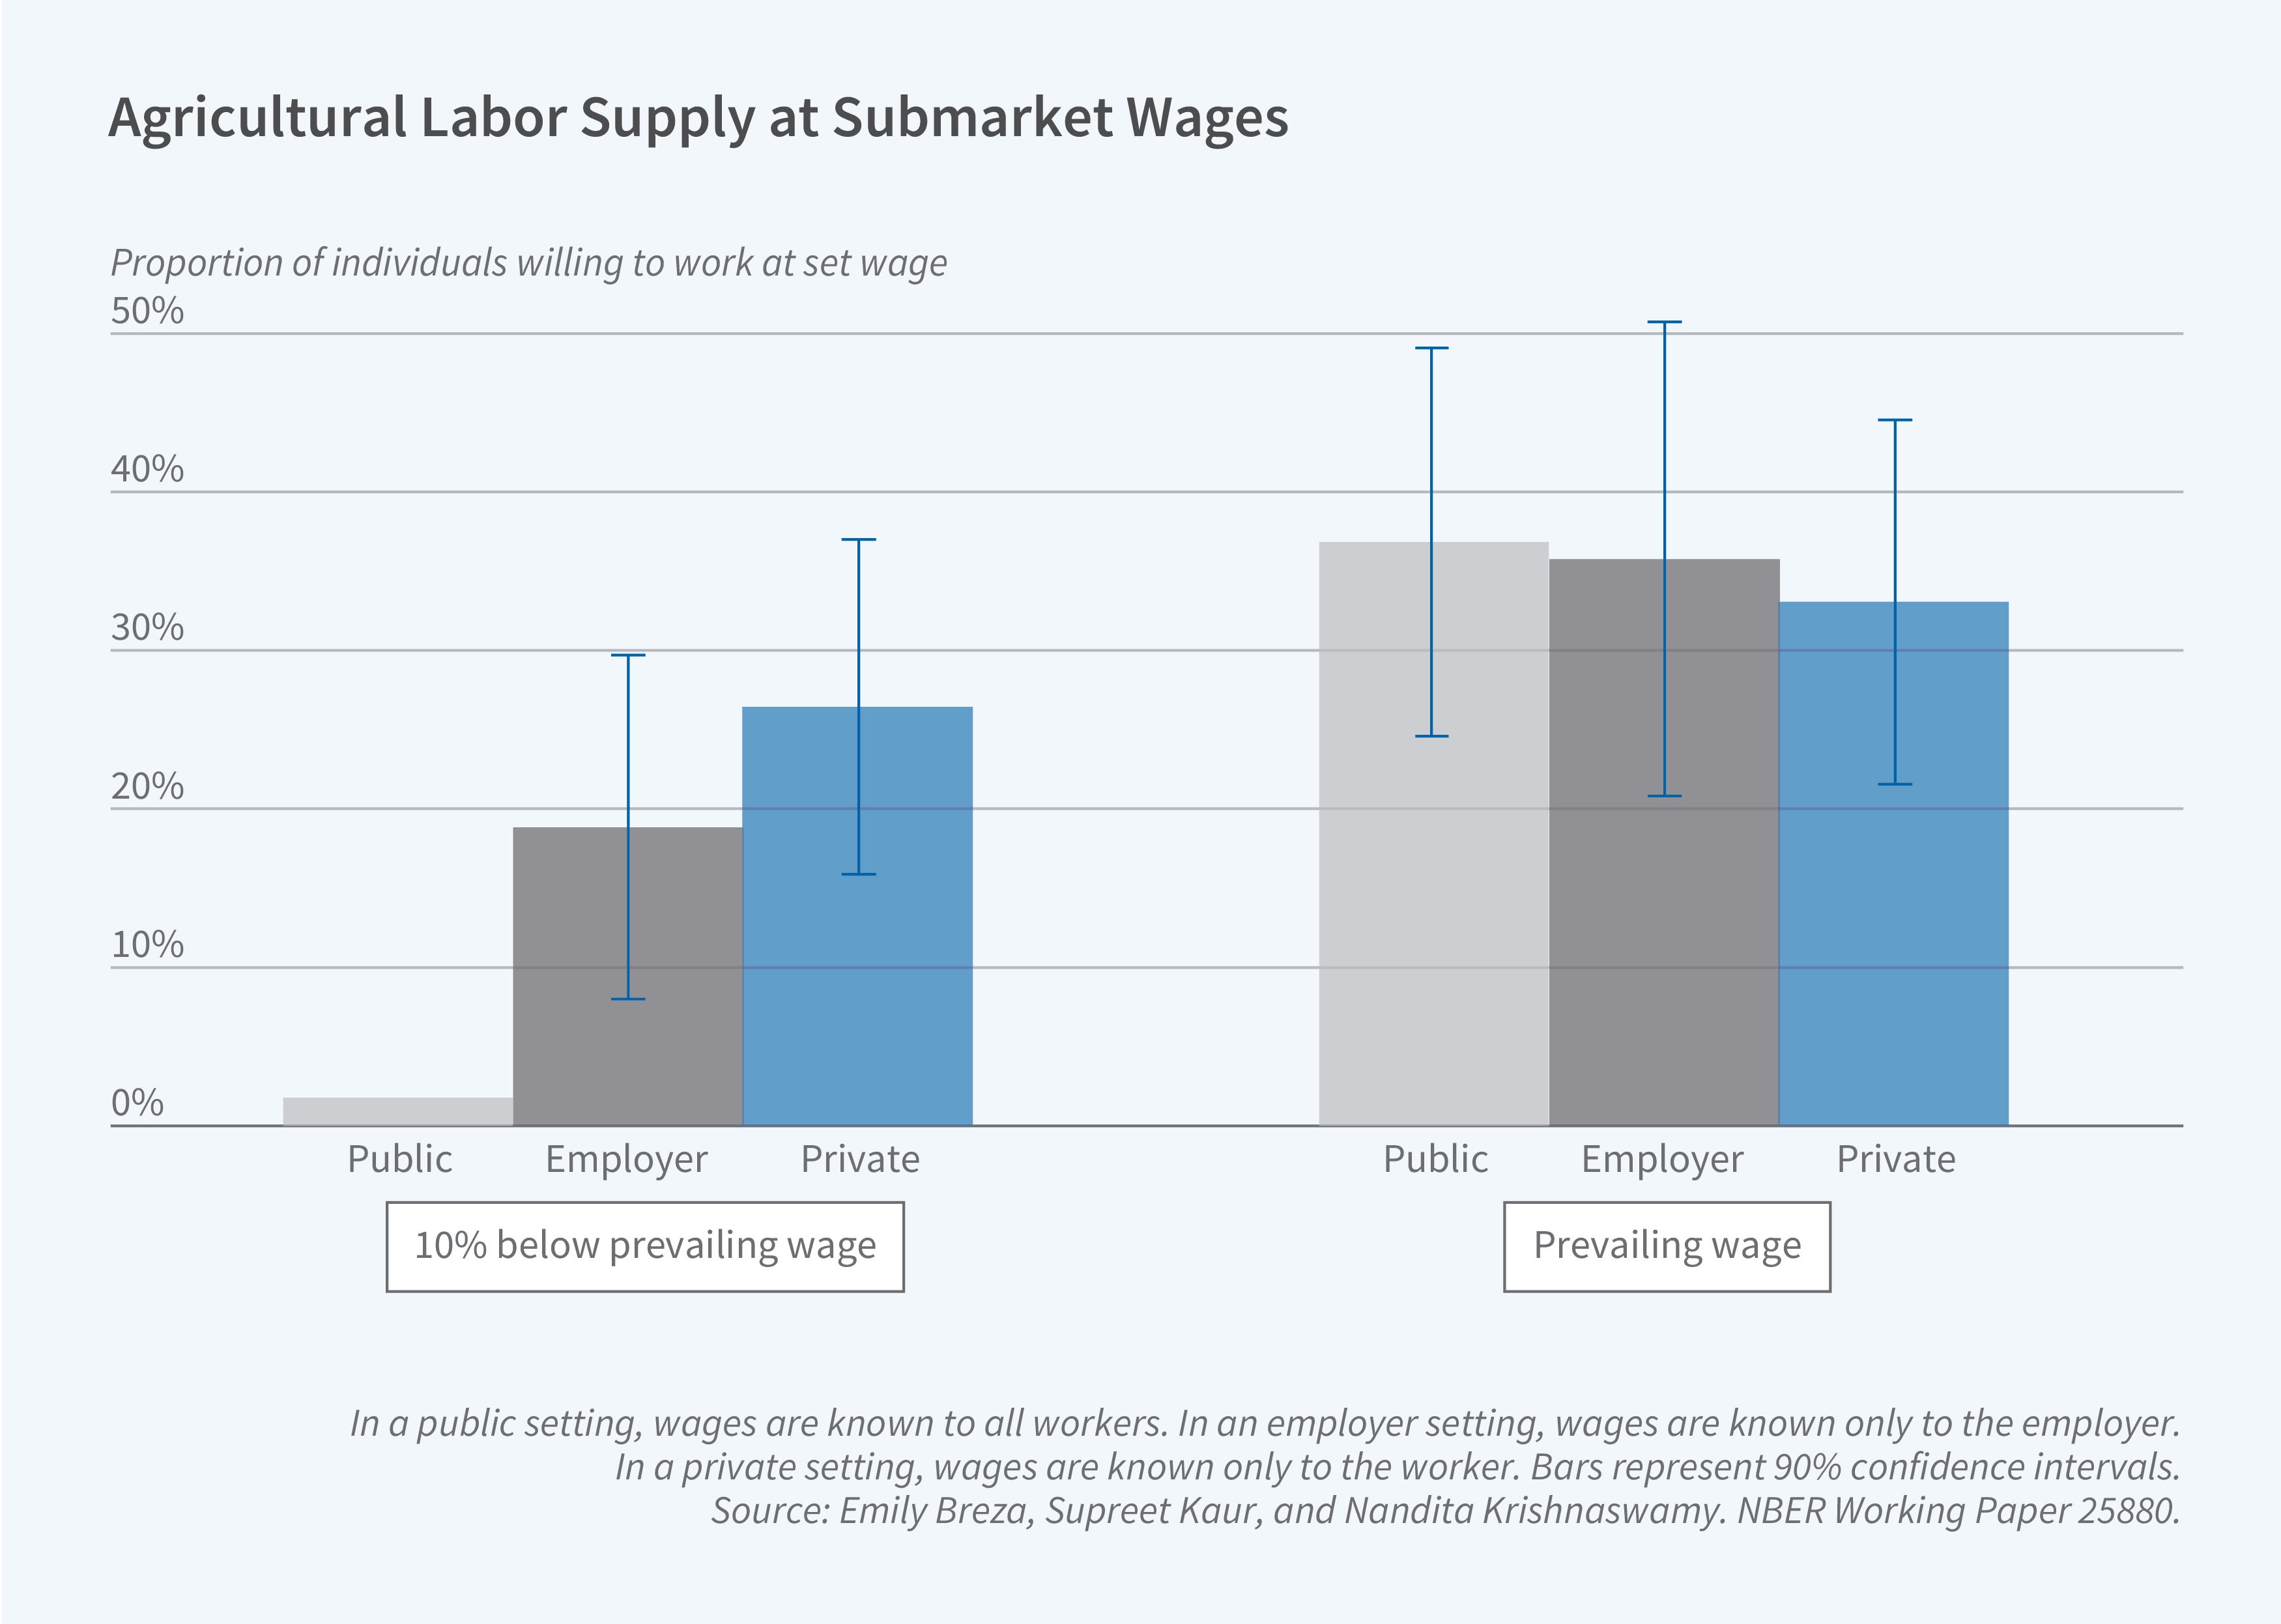
Despite high unemployment, only 1.8 percent of agricultural workers are willing to accept jobs below the prevailing wage under the status quo. However, this number jumps to 26 percent when this choice is not observable to other workers. In contrast, for prevailing-wage job offers, social observability has no detectable impact on job take-up. This is consistent with the idea that social observability only matters when there are norm violations.
These findings are consistent with substantial distortions in the aggregate supply curve. At low wages, social pressure leads to a restriction in labor supply, making it appear that below the prevailing wage, labor supply falls to close to zero. However, absent social considerations, unemployed workers would prefer working below the prevailing wage to remaining jobless. Whether the norm among workers increases or decreases, total employment depends on whether employers have market power. Regardless, a back-of-the-envelope calculation suggests that maintaining a wage floor is beneficial for worker earnings as a whole.
Overall, our findings suggest that market power can arise in many decentralized markets and may be more widespread in developing countries than has been previously thought.
Wage Compression: Social Forces
Social forces also have relevance for explaining wage compression. With Shamdasani, we explore whether and under what circumstances workers care about their pay relative to that of their coworkers.8 If relative pay differences cause workers to withdraw labor supply or effort, employers may prefer offering compressed wage contracts.
We conduct an experiment with workers in seasonal, month-long, low-skilled manufacturing jobs in India. Workers are randomly organized into three-person production units, each of which is randomized to one of four different pay structures. In the pay disparity condition, each unit member is paid a different wage — wHigh, wMed, or wLow — in accordance with his respective productivity rank within the unit determined by baseline productivity levels. In the three compressed pay conditions, all unit members are paid the same wage, which we randomly assign to be wHigh, wMed, or wLow. This allows us to compare, for example, workers with the same average baseline productivity who both earn an absolute wage of wLow, but differ in whether they are paid less than their peers under the pay disparity treatment or the same as their peers under the compressed low wage treatment.
Figure 4 shows the impacts of pay disparity on standardized output holding own wage fixed. Prior to “Day 0” of the experiment, all workers were paid identical training wages. For low-ranked workers earning wLow, output declines by 0.33 standard deviations (22 percent) on average after a worker begins earning less than both his coworkers, and attendance declines by 12 percentage points. Perhaps surprisingly, the high-ranked workers in pay disparity units, who earn more than both their coworkers, also experience a reduction in output and labor supply.
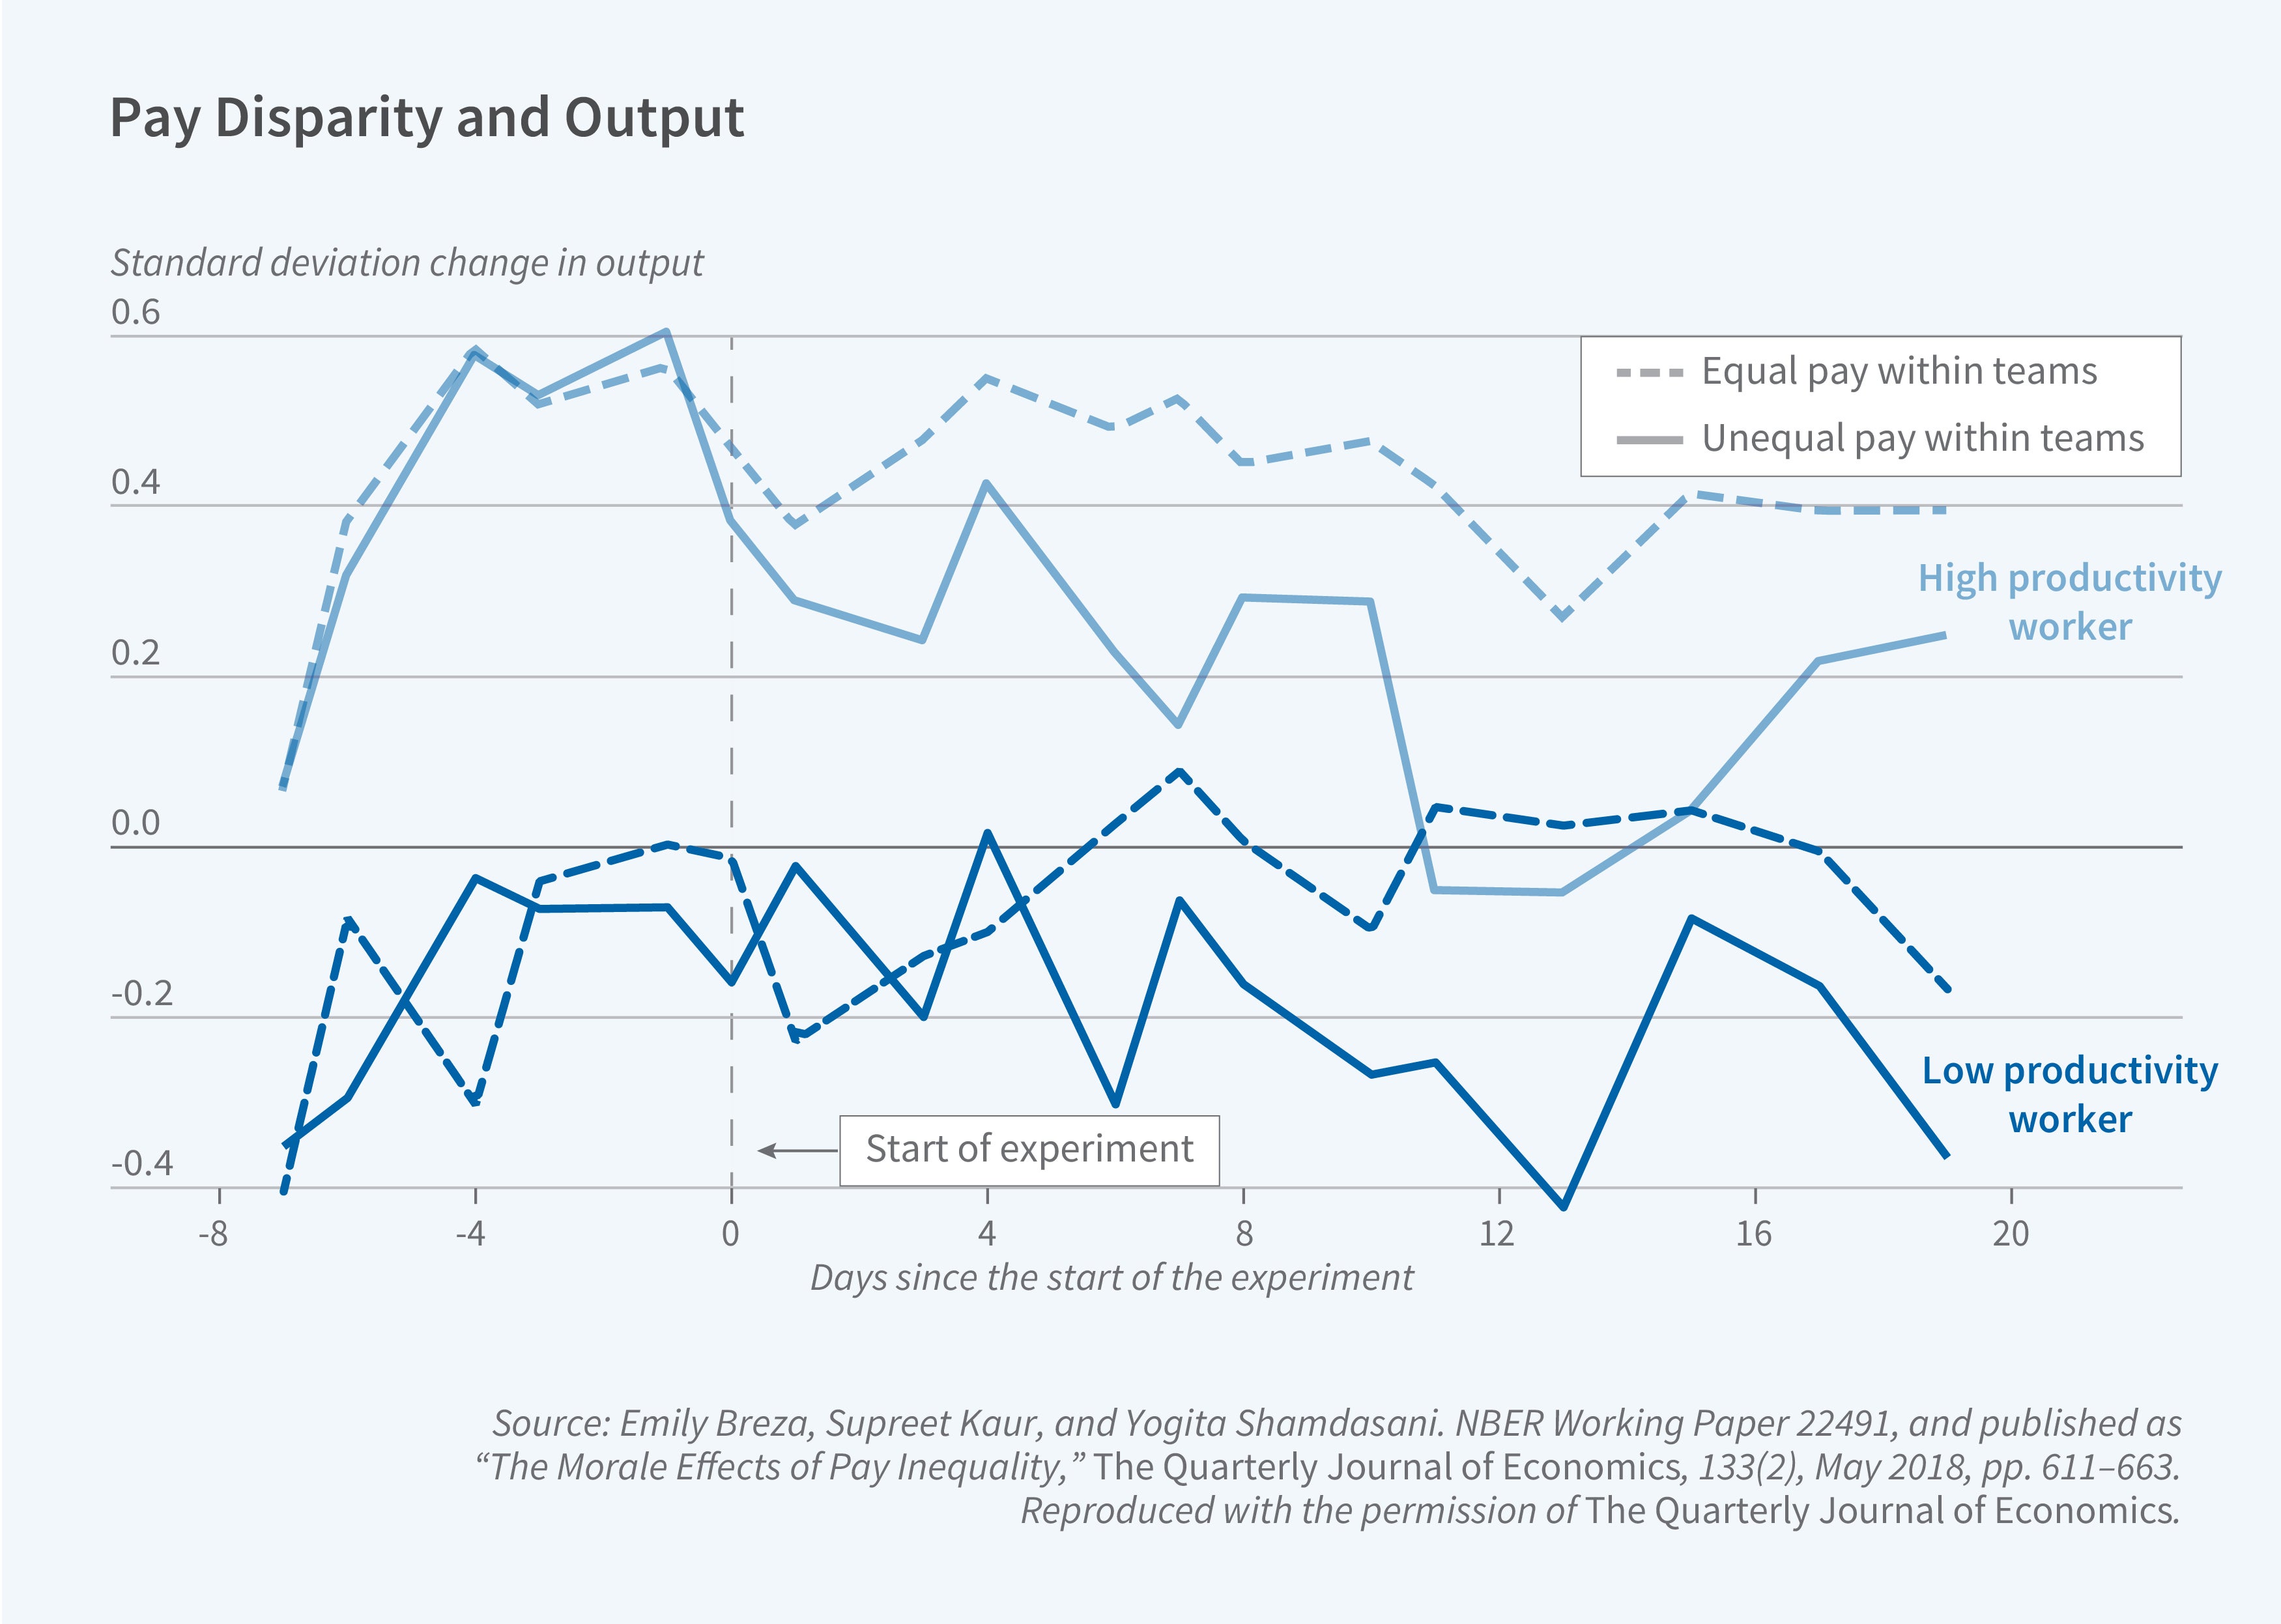
We find that perceived justifications play an important role in mediating the effects. When workers can clearly perceive that their higher-paid peers are more productive than themselves, pay disparity has no discernible negative effects on output or labor supply. That workers tolerate pay inequality only when productivity differences are extremely transparent can help explain why we observe piece rates in practice where output is fully observable but do not often observe other forms of pay dispersion.
Finally, we show that these morale effects likely operate through resentment and hostility in the workplace, reducing social cohesion among unit members. In two incentivized, cooperative games, members of pay disparity units are less able to work together than members of compressed units, even when it’s in their own interest. However, in both cases, when pay disparity is clearly justified, these effects disappear.
Together, this body of work makes progress toward understanding the functioning of rural labor markets in developing countries. It shows that while these markets embody remarkable flexibility and agility, wages are rigid and involuntary unemployment is extremely high, particularly during months when agricultural labor demand is low. This changes the logic of labor market analysis. For example, because wages do not always play an allocative role, analyses that assume wages tell us something about labor productivity will be misleading. In addition, our findings are relevant for poverty alleviation policies. For example, they suggest that workfare programs that offer jobs to unemployed workers — a popular policy tool in developing countries — are least likely to crowd out private sector jobs if implemented in lean seasons, but may do so in shoulder or peak seasons.
Why such high levels of unemployment exist in this setting remains an open question. Researchers have failed to find support for the traditional microfoundations that were discussed in the early development literature, such as nutrition efficiency wages. Our work makes progress on this puzzle by highlighting a microfoundation not previously considered: the centrality of social forces in determining market outcomes. Because markets are made up of people, they are underpinned by social relationships that can drastically alter their functioning.
Endnotes
“India - National Sample Survey 2009–2010,” Ministry of Statistics and Programme Implementation. International Labour Organization, January 21, 2024.
“Effects of Emigration on Rural Labor Markets,” Akram AA, Chowdhury S, Mobarak AM. NBER Working Paper 23929, October 2017. Accelerating Poverty Reduction in Africa, Beegle K, Christiaensen L, editors. Washington, DC: The World Bank, October 2019.
“Labor Rationing,” Breza E, Kaur S, Shamdasani Y. NBER Working Paper 28643, April 2021, and American Economic Review 111(10), October 2021, pp. 3184–3224.
“Measurement Error in Survey Data,” Bound J, Brown C, Mathiowetz N. In Handbook of Econometrics, volume 5, Heckman J, Leamer E, editors, pp. 3705–3843. Amsterdam: Elsevier, 2001. “Involuntary Unemployment,” Taylor JB. In The New Palgrave Dictionary of Economics. London: Palgrave Macmillan, 2008.
“Nominal Wage Rigidity in Village Labor Markets,” Kaur S. NBER Working Paper 20770, November 2017, and American Economic Review 109(10), October 2019, pp. 3585–3616.
“The Morale Effects of Pay Inequality,” Breza E, Kaur S, Shamdasani Y. NBER Working Paper 22491, August 2016, and The Quarterly Journal of Economics 133(2), May 2018, pp. 611–663.
“Social Norms as a Determinant of Aggregate Labor Supply,” Breza E, Kaur S, Krishnaswamy N. NBER Working Paper 25880, February 2024.
“The Morale Effects of Pay Inequality,” Breza E, Kaur S, Shamdasani Y. NBER Working Paper 22491, August 2016, and The Quarterly Journal of Economics 133(2), May 2018, pp. 611–663.


