ESG and Sustainable Investing
Sustainable investing has been growing very rapidly, as investors increasingly express concerns about climate change, biodiversity loss, social inequality, and other societal issues. According to Bloomberg, sustainable investing will reach about $50 trillion in assets under management (AUM) in 2025, accounting for about one-third of global AUM.1
While the growth of this market is nothing short of breathtaking, there are concerns and challenges. Indeed, concerns have been raised that such investments and companies’ environmental, social, and governance (ESG) practices may not have any real impact; rather, they might be a form of “greenwashing” — with businesses portraying themselves as environmentally conscious without any intent to deliver — or “window dressing” of existing activities. These concerns are compounded by the inherent difficulty of measuring companies’ social and environmental impact. This summary describes recent research I have conducted to better understand the effectiveness, limitations, and challenges of various tools of sustainable investing and ESG practices.
Climate Finance: Green Bonds
One branch of my research examines green bonds, whose proceeds are earmarked to be invested in green projects.2 While the first green bonds were issued primarily by governments and supranational entities such as the European Investment Bank, which in 2007 issued the first green bond, corporations are increasingly issuing green bonds as well.
Figure 1 plots the evolution of the market for corporate green bonds from 2013 to 2018. The total issuance amount rose from $5 billion in 2013 to $96 billion in 2018. This trend echoes the rapid growth in sustainable investing observed in recent years.
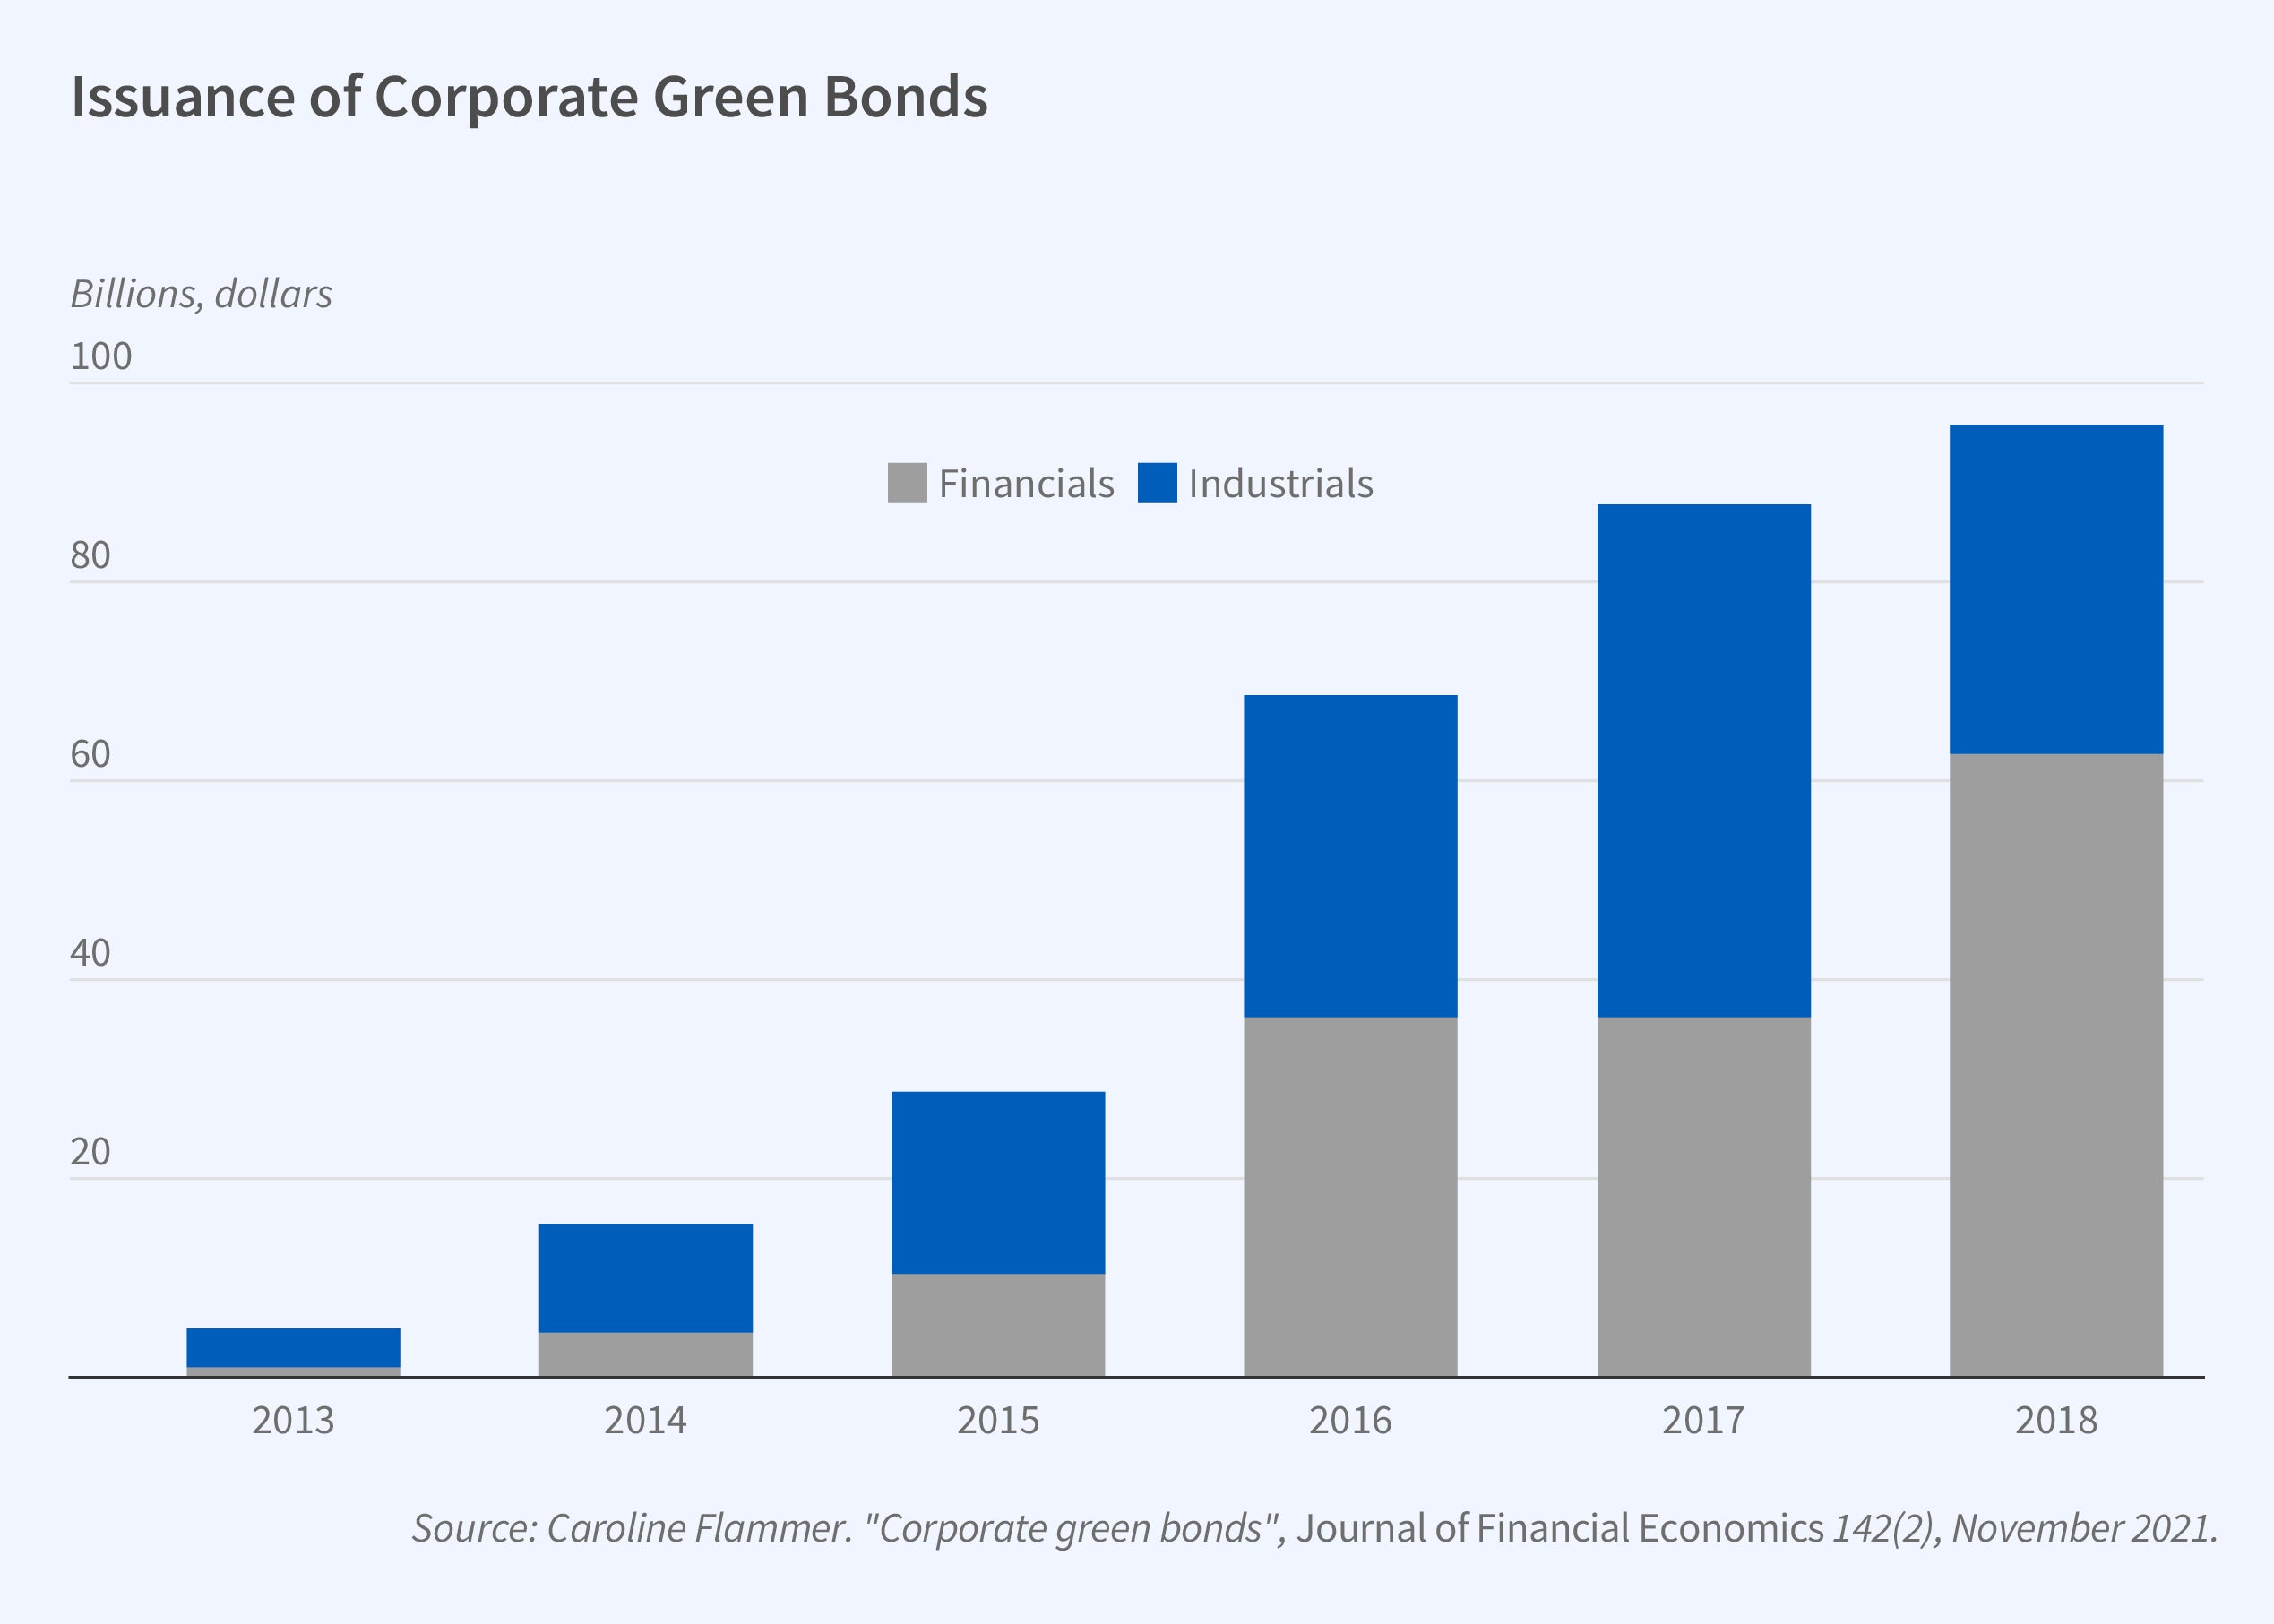
My analysis of corporate green bonds yields four main insights. First, I find that the stock market responds positively to the issuance of green bonds. That is, when companies announce that they are going to issue green bonds, their stock price increases. This suggests that shareholders perceive green bonds to be value enhancing. Second, I find that issuers significantly reduce their emissions in the years following the green bond issuance. This indicates that green bonds serve as a signal of the companies’ commitment toward the environment, as opposed to being mere tools of “greenwashing.” Third, I find that green bond issuers experience an increase in ownership by long-term and green investors, suggesting that green bonds help attract an investor clientele that is mindful of the long term and the natural environment. Fourth, and importantly, I find that these results concentrate among firms that issue green bonds that are certified by independent third parties. This indicates that, in the absence of public governance in the green bond market, private governance in the form of certification helps mitigate greenwashing concerns. Conversely, this also suggests that green bonds that are not certified are more likely to be subject to greenwashing.3
Biodiversity Finance
Climate change is closely intertwined with the loss of biodiversity. Several organizations such as the World Wide Fund for Nature (WWF) and the United Nations (UN) stress the urgency and importance of mitigating the biodiversity crisis; arguing that doing so is crucial for the planet, our health and well-being, and the global economy, as more than half of the world’s GDP is dependent on nature and the services it provides.4
Protection and restoration of biodiversity requires considerable funding. The Nature Conservancy estimates a financing gap of $722 billion to $967 billion per year relative to its projection of the funding needed to effectively address the biodiversity crisis.5 How can this gap be closed? One potential avenue is private capital investments in biodiversity projects that aim to provide both financial returns and biodiversity impact. While this practice is gaining momentum among investors, it is not well understood.
In recent work, Thomas Giroux, Geoffrey M. Heal, and I shed light on this new phenomenon in two ways.6 First, we provide a conceptual framework that lays out how biodiversity — a public good — could be financed by private capital. A key component is the bundling of the public good with a private good whose value increases with the protection of biodiversity. For example, the protection of pollinators such as bees, beetles, and butterflies can enhance farmland’s productivity, so investments that bundle farmland investments and pollinator preservation can protect biodiversity while providing a financial return to investors.
While such bundling serves as a monetization mechanism, the risk-return tradeoff of biodiversity investments may nevertheless not be appealing enough to attract private capital. To subsidize and de-risk biodiversity investments, a potential remedy is blended finance — combining funding from the public sector or philanthropic organizations with private capital to reduce the risk borne by, and improve the risk-return tradeoff for, private investors. In this vein, the blending improves the attractiveness of biodiversity investments and hence serves as a catalyst to private capital.
Second, we provide the first empirical evidence on biodiversity finance using deal-level data from a leading biodiversity finance institution. We find that projects with higher expected financial returns tend to be financed by pure private capital. Their scale is smaller, however, and so is their expected biodiversity impact. For larger-scale projects with a more ambitious biodiversity impact, blended finance is the more prevalent form of financing. While these projects have lower expected returns, their risk is also lower. This suggests that the blending — and the corresponding de-risking of private capital — is an important tool for improving the risk-return tradeoff of these projects, thereby increasing their appeal to private investors.
We also examine a set of projects that did not make it to the portfolio stage, and find that in order to be financed by private capital, biodiversity projects need to meet a certain threshold in terms of both their financial return and biodiversity impact. Accordingly, while private capital investments in biodiversity might be a useful addition to the toolbox, they are likely to only partially close the financing gap. As such, they are unlikely to substitute for effective public policies.
Social Impact Investing
Impact investing aims to finance business ventures that are both economically viable and have a positive social impact. Romain Boulongne, Rodolphe Durand, and I examine whether impact investing is more effective in achieving this dual objective when investments are directed toward ventures located in disadvantaged urban areas such as banlieues in France, favelas in Brazil, and slums in the US compared to similar investments directed toward ventures located outside these areas.7
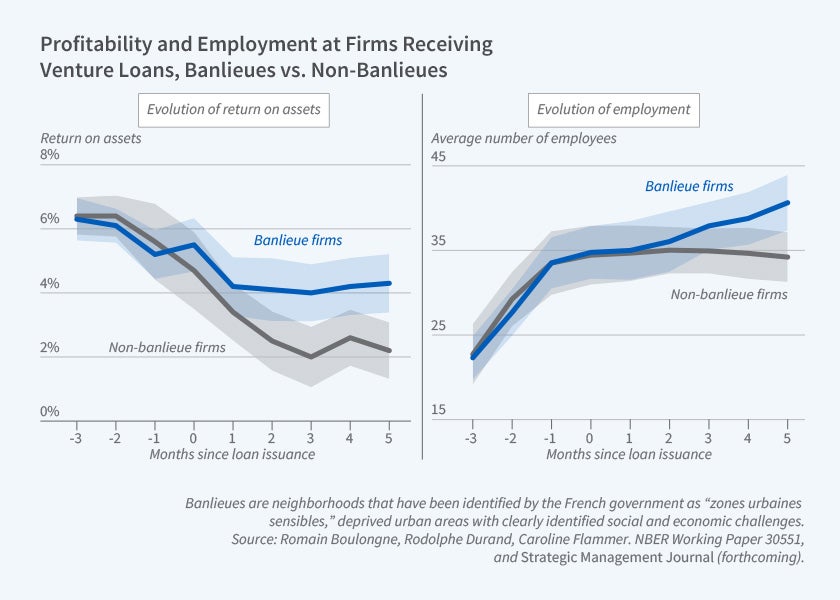
We explore this question in the context of impact loans made to business ventures in and outside French banlieues using data from a French impact investor that we merge with establishment-level data from INSEE (Institut national de la statistique et des études économiques). We find that, following the issuance of the loans, banlieue ventures achieve greater improvements in financial performance and greater social impact in terms of the creation of local employment opportunities, quality jobs, and gender-equitable jobs compared to observationally similar non-banlieue ventures. Figure 2, summarizes these results, plotting the evolution of the firm’s return on assets and employment among banlieue and non-banlieue ventures several years before and after the issuance of the impact loan.
These results indicate that impact investors are able to contract with ventures of greater unrealized potential in banlieues. Why are traditional investors missing out on these opportunities? Our results point toward discrimination against banlieue ventures in the traditional loan market. This is corroborated in a controlled lab experiment in which participants — working professionals who are asked to act as loan officers — are randomly assigned to business ventures that are identical except for their geographic location. Participants are less likely to grant loans to banlieue ventures than to non-banlieue ventures, despite the ventures being identical.
Sustainable Equity Investing
Equity investors have various tools available to influence their portfolio companies’ ESG practices. They can pursue passive sustainable investing strategies, including divestment and thematic screening, as well as more active forms of sustainable investing, including shareholder engagement and activism. Previous studies suggest that active sustainable investing strategies are more effective than passive forms of sustainable investing in shaping the ESG practices of portfolio companies.8 The intuition is straightforward: when they choose to divest, investors lose their seat at the table and the potential to shape their portfolio companies’ business practices. In contrast, investors’ active engagement may serve as a more effective governance mechanism.
In a series of papers, my collaborators and I study the growing importance of shareholder activism pertaining to ESG practices, corporate short-termism, and shareholders’ demand for greater disclosure of their portfolio firms’ climate risks exposure.9 Our findings suggest that shareholder activism can serve as an important private governance tool that improves ESG practices and their disclosure, and ultimately contributes to shareholder value.
Companies’ ESG Practices
Diversity, Equity, and Inclusion
Companies’ ESG practices, which are often referred to as corporate social responsibility (CSR), come in different flavors. One dimension that has received considerable attention but is not well understood is Diversity, Equity, and Inclusion (DEI). Perhaps due to the challenges in measuring DEI, metrics often focus narrowly on demographic diversity — e.g., the number of women and minorities on the board — but do not capture cognitive diversity, nor equity or inclusion.
Alex Edmans, Simon Glossner, and I take a first step toward measuring the DEI of companies more holistically, using employee survey data.10 Our DEI measure has low correlation with gender and ethnic diversity in the boardroom, in senior management, and within the workforce, suggesting that DEI captures additional dimensions missing from traditional measures of demographic diversity. This indicates that companies can hit the target but miss the point, improving diversity statistics without actually improving DEI.
We find that a firm’s DEI score is positively associated with seven out of eight measures of future profitability, such as return on assets, return on sales, profits divided by employees, and sales divided by employees (labor productivity). These results are obtained after controlling for the share of female and minority employees at the firm; these variables are insignificantly related to almost all performance measures. In other words, DEI is correlated with higher profits, but diversity alone is not. We also find that DEI is positively associated with valuation measures, such as Tobin’s q, suggesting that the market at least partially incorporates the value of DEI.
Other ESG Practices
Companies also implement various other CSR policies besides DEI. My research suggests that CSR can benefit companies in several ways, including by increasing their ability to innovate, to retain employees, to increase employee motivation, to improve their resilience in times of crisis, and to compete in the product market and the market for government contracts. All of these benefits help contribute to financial performance.11
Given these potential benefits of CSR, a natural question is: why are companies often hesitant to engage in ambitious CSR programs? In two related studies, I argue that this is partly due to managerial myopia, as the benefits of CSR programs tend to accrue in the long run while they might be costly in the short run.12 I find that, consistent with this argument, the adoption of ESG-linked compensation — so-called “pay for social and environmental performance” — and executive compensation linked to the firm’s long-term performance helps improve both firm value and the firm’s engagement in long-term strategies such as CSR.
Endnotes
ESG assets may hit $53 trillion by 2025, a third of global AUM,” Bloomberg Intelligence, February 23, 2021.
“Green Bonds: Effectiveness and Implications for Public Policy,” Flammer C. NBER Working Paper 25920, June 2019. Published in Environmental and Energy Policy and the Economy 1, 2020, pp. 95–128.
“Green Bonds: Effectiveness and Implications for Public Policy,” Flammer C. NBER Working Paper 25920, June 2019. Published in Environmental and Energy Policy and the Economy 1, 2020, pp. 95–128.
“Living Planet Report 2022,” WWF, 2022. “State of Finance for Nature 2022,” United Nations Environment Programme, 2022.
“Closing the Nature Funding Gap: A Finance Plan for the Planet,” The Nature Conservancy, September 14, 2020.
"Biodiversity Finance,” Flammer C, Giroux T, Heal GM. NBER Working Paper 31022, March 2023.
“Impact Investing in Disadvantaged Urban Areas,” Boulongne R, Durand R, Flammer C. NBER Working Paper 30551, October 2022, and forthcoming in Strategic Management Journal.
For a curated list of academic publications in sustainable investing, see https://www.unpri.org/research/top–academic–resources–on–responsible–investment/4417.article.
“Does Corporate Social Responsibility Lead to Superior Financial Performance? A Regression Discontinuity Approach,” Flammer C. Management Science 61(11), November 2015, pp. 2549–2568. “Does a Long–Term Orientation Create Value? Evidence from a Regression Discontinuity,” Flammer C, Bansal P. Strategic Management Journal 38(9), September 2017, pp. 1827–1847. “Shareholder Activism and Firms’ Voluntary Disclosure of Climate Change Risks,” Flammer C, Toffel MW, Viswanathan KV. Strategic Management Journal, 42(10), October 2021, pp. 1850–1879.
“Diversity, Equity, and Inclusion,” Edmans A, Flammer C, Glossner S. NBER Working Paper 31215, May 2023.
“The Impact of Stakeholder Orientation on Innovation: Evidence from a Natural Experiment,” Flammer C, Kacperczyk AJ. Management Science 62(7), July 2016, pp. 1982–2001. “Corporate Social Responsibility As a Defense against Knowledge Spillovers: Evidence from the Inevitable Disclosure Doctrine,” Flammer C, Kacperczyk AJ. Strategic Management Journal 40(8), August 2019, pp. 1243–1267. “Corporate Social Responsibility As an Employee Governance Tool: Evidence from a Quasi–Experiment,” Flammer C, Luo J. Strategic Management Journal 38(2), February 2017, pp. 163–183. “Strategic Management during the Financial Crisis: How Firms Adjust Their Strategic Investments in Response to Credit Market Disruptions,” Flammer C, Ioannou I. Strategic Management Journal 42(7), July 2021, pp. 1275–1298. “Competing for Government Procurement Contracts: The Role of Corporate Social Responsibility,” Flammer C. Strategic Management Journal 39(5), May 2018, pp. 1299–1324. “Does Corporate Social Responsibility Lead to Superior Financial Performance? A Regression Discontinuity Approach,” Flammer C. Management Science 61(11), November 2015, pp. 2549–2568. “Does Product Market Competition Foster Corporate Social Responsibility? Evidence from Trade Liberalization,” Flammer C. Strategic Management Journal 36(10), October 2015, pp. 1469–1485.
“Does a Long–Term Orientation Create Value? Evidence from a Regression Discontinuity,” Flammer C, Bansal P. Strategic Management Journal 38(9), September 2017, pp. 1827–1847. “Corporate Governance and the Rise of Integrating Corporate Social Responsibility Criteria in Executive Compensation: Effectiveness and Implications for Firm Outcomes,” Flammer C, Hong B, Minor DB. Strategic Management Journal 40(7), July 2019, pp. 1097–1122.


