US Environmental Policies, the Environment, and the Economy
US environmental regulations have expanded dramatically since passage of the Clean Air Act, Clean Water Act, and similar laws a half century ago. Today, these policies face growing debate. While they have improved environmental quality, they also impose important costs. Moreover, their benefits and costs can have uneven impacts across racial and income groups.
Economists have long studied the effectiveness, efficiency, and equity of environmental policy, but three obstacles have impeded this research. One is a dearth of data on individual firms and households that could enable analysis of a broad range of policy impacts. Another is the challenge of quantifying the stringency of regulation for different entities and in different years. A third is the complexity of combining data, econometric methods, and economic theory to infer impacts on hard-to-observe outcomes such as consumer and producer surplus and social welfare.
Our joint and independent recent work on how US regulation of air, water, and climate pollution has affected households and firms combines newly available administrative data with insights from research on trade, industrial organization, and public finance to help address these challenges. This summary reviews some of this work.
Administrative Data
Many government agencies routinely collect data to administer policies, and recent expansions in data access allow analysts to use these data for research. The availability of confidential microdata through the US Census Bureau’s research data centers is particularly valuable. These data provide large sample sizes and spatial detail, which can enable better research designs than in past research. They also support new linkages across databases and new variables within existing data, expanding the range of feasible research.
For example, research often uses industry-level aggregates, since they are publicly available, and many environmental policies apply to an industry rather than to a firm or establishment. Plants and firms within industries, however, differ in ways that may be important to consider when designing policy or determining the overall welfare effects of existing policies. Our work with Eva Lyubich uses the Census Bureau’s plant-level information on energy and other intermediate goods to assess the importance of heterogeneous firm externalities for environmental policy design within industries.1 The analysis measures both plant-level CO2 emissions and emissions from the plant’s unique supply chain. It finds vast heterogeneity in output produced per unit of energy used within even narrowly defined industries. For example, given $1 of energy input, a plant at the 90th percentile of a given industry’s distribution of energy productivity produces 580 percent more output than a plant at the 10th percentile of the same industry. Heterogeneity in output per unit of energy input substantially exceeds heterogeneity in other standard productivity measures.
As another example, researchers and policymakers have long been concerned about who ultimately bears the burden of Pigouvian taxes, taxes which, like a carbon tax, are levied on households or firms to internalize the cost of pollution emissions and other activities that generate externalities. However, little is known about the ability of fossil fuel-intensive firms and industries to pass these costs through to consumers, as public data provide little information on firm prices or marginal costs. The Census Bureau, however, collects data on plant-level production quantities and unit prices for a few homogeneous industries. Our work with Sharat Ganapati uses this price data to study how shocks to energy input prices affect firms’ product prices.2 These estimates of cost pass-through help inform the incidence of a future carbon tax, as they shed light on firms’ ability to pass energy costs along to consumers. We find that the pass-through of energy prices in the short to medium run is incomplete, which implies that the share of the welfare cost that consumers bear relative to producers is smaller than is often assumed.
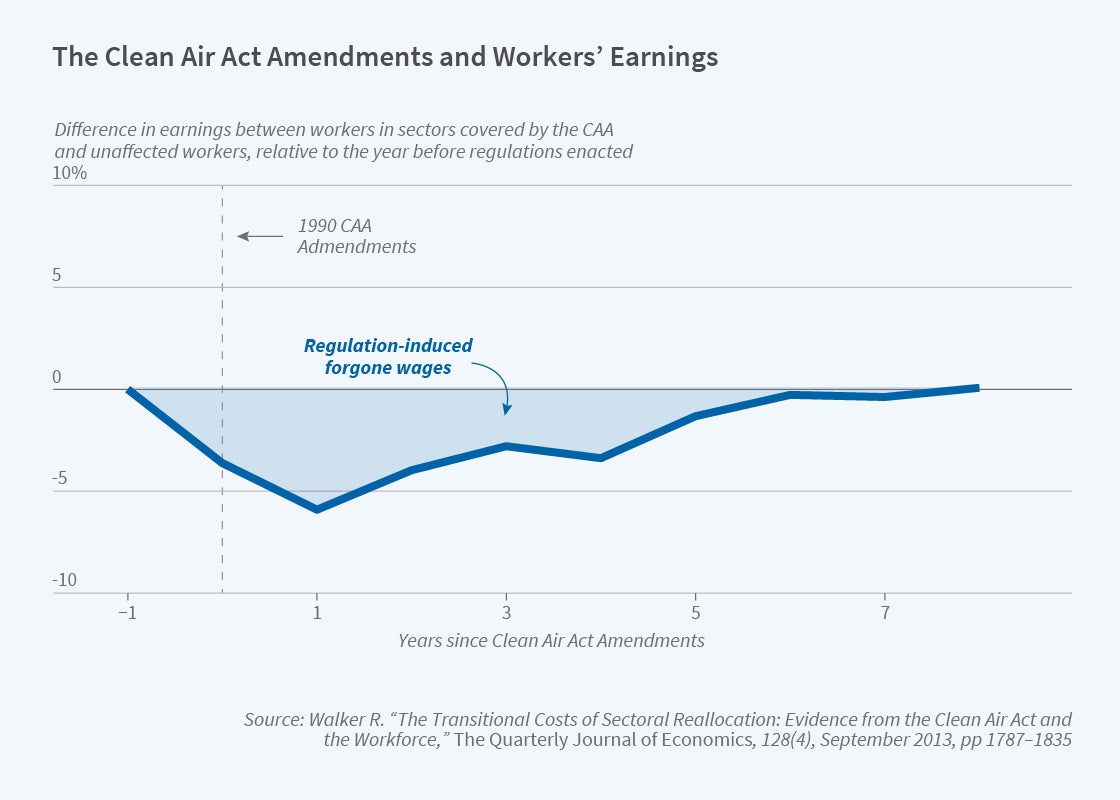
A final example of research enabled by newly available administrative data uses linkages between establishment characteristics and worker earnings histories to shed light on the labor market implications of environmental policy. For example, how do Clean Air Act (CAA) regulations affect the labor force? Walker uses these linked data to follow workers over time, before and after the 1990 Clean Air Act Amendments which regulated polluting industries in polluted counties.3 Focusing on workers rather than industries helps reveal the long-run earnings losses from regulation-induced job transitions and nonemployment, both of which are unobservable in publicly available data on industry wages or employment. Workers in newly regulated establishments experience substantial and persistent earnings penalties, largely due to long-run costs of job loss and lower future wages in subsequent employment [Figure 1].
Data from Open Record Requests and Private Firms
Quantifying regulatory stringency is a challenge in research on energy and environmental policy. Just one environmental policy, for example, can fill hundreds of pages of legal text. Newly collected data on subsidies and regulated pollutants have enabled analysis of policies that previously had received limited research attention.
David Keiser and Shapiro study $650 billion in total expenditures due to grants the federal government gave cities through the Clean Water Act to improve municipal treatment of water pollution.4 Their analysis links detailed data on 35,000 individual Clean Water Act grants, obtained from Freedom of Information Act requests, to information on water quality at millions of points along a network model of all US streams and rivers. The research finds that these grants were associated with substantially decreased water pollution for at least 25 years, though their impact on nearby home values was smaller than their costs.
Another example concerns the CAA, which has created almost 500 local emissions markets for air pollution. Due to a lack of publicly available data, these markets have received little attention from researchers, even though transactions in these markets can help identify the overall efficiency of existing regulation. Under the CAA, a polluting firm may only open or expand a plant in a polluted city if an existing plant permanently decreases its emissions of the same pollutant in that city. An incumbent must certify these emissions reductions with a regulator and can then sell these “offsets” to the entrant. We obtained records of these transactions and used them to determine the marginal costs of cleaning up pollution.5 By comparing offset prices to estimates of the marginal benefits of cleaning up air pollution, we found that the marginal benefits of additional pollution regulation are on average 10 times greater than the marginal costs of emission reductions, though the ratio varies by market.
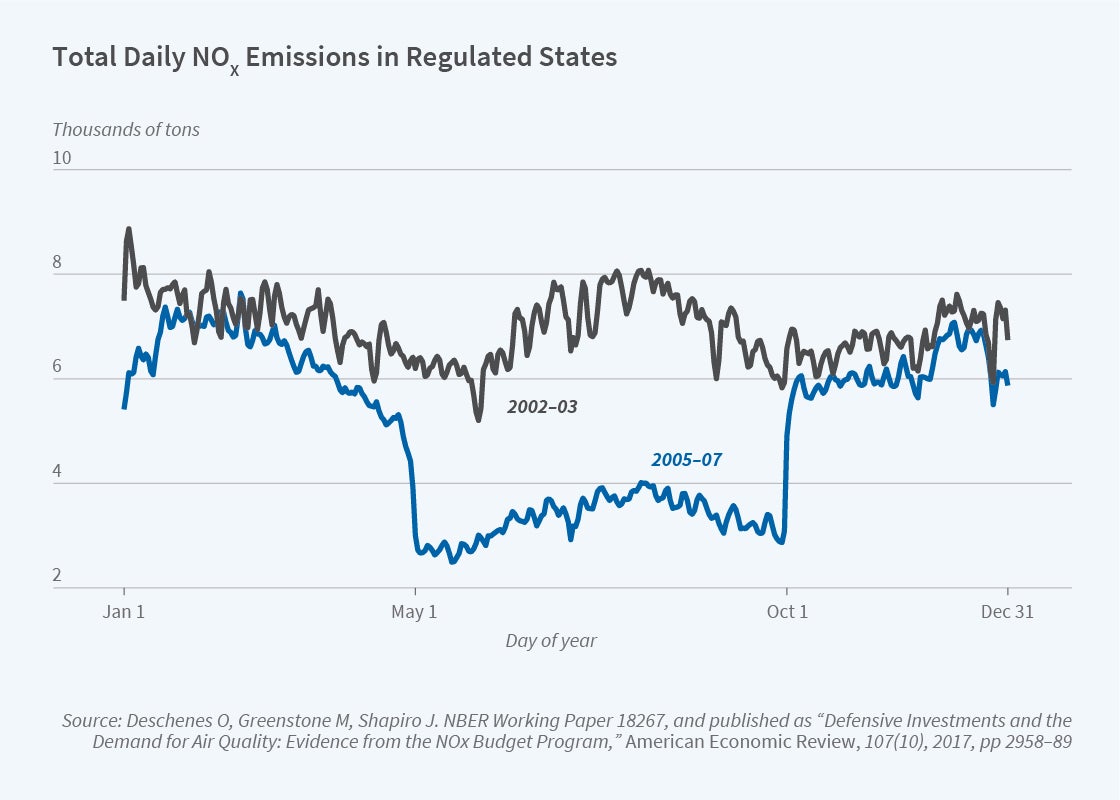
Market intelligence firms also provide increasingly important databases for research. One illustration arises in the study of how environmental damage leads to adverse health outcomes, including deaths. It is widely understood that individuals can undertake defensive investments to protect themselves from the adverse effects of pollution. These defenses represent a cost of the pollution, but can be difficult to quantify. Olivier Deschenes, Michael Greenstone, and Shapiro use data from healthcare interactions for employees and dependents of many large firms to study the importance of medication expenditures, such as for asthma inhalers, which represent one important defense against pollution.6 They study a cap-and-trade market that began in 2003 and regulated pollution in the summer months for 19 Eastern states [Figure 2]. The decrease in medication costs associated with the operation of these markets almost alone offsets the market’s costs. Accounting for prevented premature mortality would make the benefits even larger.
Data from Remote Sensing and Satellite Imagery
Increasingly available remote sensing data have greatly expanded the set of questions researchers can answer. Between 1990 and 2015, for example, only 40 percent of 3,143 US counties had any Environmental Protection Agency (EPA) monitors for air pollutants regulated under the CAA. With so few monitors, it is difficult to know the overall burden of pollution exposure in the US, or how burdens differ between racial groups. Janet Currie, John Voorheis, and Walker use new satellite-based measurements of ambient PM2.5 exposure in the entire US to explore trends in racial inequality in pollution exposure and the drivers of these gaps over time.7 The analysis confirms that African Americans disproportionately live in polluted areas. This Black-White gap in mean pollution exposure, however, has closed substantially since 2000. Spatially targeted CAA regulations are the largest contributor to this convergence.
In related work, Meredith Fowlie, Edward Rubin, and Walker leverage these satellite-based data to assess the extent to which EPA monitors over- or underestimate true exposure to PM2.5 pollution.8 Official monitors miss much spatial variation in pollution within a region. Because US regulation depends on ambient concentrations, this measurement error can lead to both over- and underregulation. Surprisingly, however, redesigning policies to capture more spatially resolved measures of pollution exposure is not guaranteed to improve health outcomes overall.
Connecting Theory to Data
Many important questions involve concepts that data cannot directly report, such as the marginal willingness to pay for environmental goods or the effects of counterfactual policies. Some recent work develops methods to study how actual and counterfactual environmental policies affect such outcomes.
In a recent study, we model how firms trade off producing goods and emitting pollution.9 Pollution in many high-income countries has declined in recent decades. Several factors could explain this, including outsourcing dirty production to low-income countries, productivity growth, or environmental regulation. We use plant-level data from the Census Bureau to construct empirical analogs to the concepts in our model. The model analyzes how environmental and economic policies affect firm abatement and production decisions. We invert the model to use observed data on firm abatement and production decisions to infer what types of environmental and economic policies firms faced over the past few decades. We then use the model to learn how counterfactual policies would affect outcomes and find that environmental regulation, rather than productivity growth or changes in trade, accounts for most of the decrease in pollution.
A related study examines how trade policies affect climate change. Countries have proposed imposing tariffs proportional to the carbon emissions embodied in traded goods to prevent relocation of dirty production abroad (“leakage”) as a result of climate change policies. In a recent paper, Shapiro studies existing tariffs and other trade policies like quotas to see if countries already impose higher trade protection on dirty goods. Such protection would be an implicit carbon tariff.10 Data across countries, years, and policies, however, consistently show the opposite: countries have greater protection on clean goods and lower protection on dirty goods, which constitutes an implicit subsidy to climate change embodied in trade policy. The paper models trade and the environment to predict how changing tariffs and nontariff trade barriers on clean versus dirty goods would affect the environment and the economy. It indicates that harmonizing trade policy between clean and dirty goods would substantially decrease global emissions, without decreasing GDP.
A final example of research that uses administrative data comes from air pollution exhaust standards for vehicles, the centerpiece of the CAA’s regulation of transportation. Mark Jacobsen, James Sallee, Shapiro, and Arthur van Benthem examine comparable microdata on the pollution emissions of every make, model, and trim of new passenger vehicle sold in the US in the last half century, the exhaust standards for these vehicles, and over 60 million vehicle pollution readings.11 This analysis finds that the emissions per mile of new US vehicles have fallen by more than 99 percent since the setting of exhaust standards began in the 1960s. Exhaust standards caused a majority of that decline. A quantitative model of the new and used vehicle fleets highlights that standards are not cost-effective because they exempt the large share of pollution from older used vehicles.
Taken together, our research suggests that environmental policy can have large but unequal environmental benefits and economic costs that, even a half century after passage of many environmental laws, we are still working to understand.
Endnotes
“Regulating Mismeasured Pollution: Implications of Firm Heterogeneity for Environmental Policy,” Lyubich E, Shapiro J, Walker R. NBER Working Paper 24228, January 2018, and AEA Papers and Proceedings 108, 2018, pp. 136–142.
“Energy Cost Pass-Through in US Manufacturing: Estimates and Implications for Carbon Taxes,” Ganapati S, Shapiro JS, Walker R. NBER Working Paper 22281, July 2019, and American Economic Journal: Applied Economics 12(2), 2020, pp. 303–342.
“The Transitional Costs of Sectoral Reallocation: Evidence from the Clean Air Act and the Workforce,” Walker WR. The Quarterly Journal of Economics 128(4), 2013, pp. 1787–1835.
“Consequences of the Clean Water Act and the Demand for Water Quality,” Keiser DA, Shapiro JS. NBER Working Paper 23070, June 2018, and The Quarterly Journal of Economics 134(1), 2019, pp. 349–396.
“Is Air Pollution Regulation Too Stringent?” Shapiro JS, Walker R. NBER Working Paper 28199, December 2020.
“Defensive Investments and the Demand for Air Quality: Evidence from the NOx Budget Program,” Deschenes O, Greenstone M, Shapiro JS. NBER Working Paper 18267, August 2012, and American Economic Review 107(10), 2017, pp. 2958–2989.
“What Caused Racial Disparities in Particulate Exposure to Fall? New Evidence from the Clean Air Act and Satellite-Based Measures of Air Quality,” Currie J, Voorheis J, Walker R. NBER Working Paper 26659, October 2021.
“Bringing Satellite-Based Air Quality Estimates Down to Earth,” Fowlie M, Rubin E, Walker R. NBER Working Paper 25560, February 2019, and AEA Papers and Proceedings 109, 2019, pp. 283–288.
“Why Is Pollution from US Manufacturing Declining? The Roles of Environmental Regulation, Productivity, and Trade,” Shapiro JS, Walker R. NBER Working Paper 20879, January 2015, and American Economic Review 108(12), 2018, pp. 3814–3854.
“The Environmental Bias of Trade Policy,” Shapiro JS. NBER Working Paper 26845, May 2020, and The Quarterly Journal of Economics 136(2), 2021, pp. 831–886.
“Regulating Untaxable Externalities: Are Vehicle Air Pollution Standards Effective and Efficient?” Jacobsen MR, Sallee J, Shapiro J, van Benthem A. NBER Project. 2022.


