Augmenting National Income Statistics to Include Environmental Services
For nearly a century, the National Income and Product Accounts (NIPAs) have provided policymakers, investors, academics, and the lay public with essential indicators of economic performance. However, since their inception, it has been widely acknowledged, especially among economists, that the NIPAs are an incomplete gauge of output and growth. Critical omissions include the value of home production, leisure time, environmental pollution damage, and natural resources in situ.
Beginning with the seminal work of William Nordhaus and James Tobin in 1973, economists have estimated the magnitude of these gaps.1 Subsequent research estimating the magnitude of pollution damage in the United States and the global economy finds that they loom large relative to conventionally measured output.2 Both their magnitude and the central importance of the NIPAs to decision-making broadly suggest that including environmental pollution damage in an augmented accounting system would have far-reaching consequences. The importance of this augmentation lies in four areas: the level of output and its distribution across sectors within the economy, growth, monetary policy, and sustainability. This research summary highlights key issues and research in each of these domains.
By way of background, it is important to recount some of the historical obstacles to empirical estimation of pollution damage as well as remaining challenges to developing an augmented system of accounts. First, at the time of Nordhaus and Tobin’s work, emission quantities of common air and water pollutants were just beginning to be measured in a rigorous fashion. In the US, the passage of landmark environmental legislation in the early 1970s meant that regulators were now charged with tracking emissions in order to document compliance. This was a crucial step toward enabling environmental accounting. Second, the effects of pollution on human health, one of the most important sources of damage from pollution exposure, were just beginning to be known. The pioneering work of Lester Lave and Eugene Seskin provided some of the earliest quantitative evidence of pollution’s association with mortality risk.3 Even today, this effect category remains the largest single quantifiable contributor to environmental pollution damage. Third, monetization of nonmarket services such as mortality risk was in its infancy. In 1968, Thomas Schelling developed the idea of valuing tradeoffs between mortality risk and income.4 This approach, known as the Value of a Statistical Life (VSL), is one of the most important parameters in environmental benefit-cost analysis and environmental accounting. Finally, though in 1973 the social cost of carbon had not been estimated, this parameter is central to estimates of damages from greenhouse gases.
Documenting environmental pollution damage affects the magnitude of aggregate output, net of pollution damage, and the contribution to national product across economic sectors. For example, air pollution damage from the production side of the economy amounted to over 5 percent of gross domestic product (GDP) in 2002.5 Importantly, this estimate does not include emissions from households’ economic activity such as combusting fossil fuels for space heating, water heating, cooking, and personal transport.
The degree of pollution intensity varies dramatically across sectors. In the early 21st century, agriculture and utilities generated air pollution damage on par with reported value-added (VA), whereas the pollution intensity of output from the manufacturing sector was much lower.6 Drilling down further, several industries produced damage in excess of their VA. These particularly polluting industries included enterprises in waste management and fossil-fuel-fired power generation.7 Since the early 21st century, the US economy has greatly reduced its air pollution intensity due to both regulatory and market forces.8 Some sectors, such as utilities, transportation, and manufacturing, spearheaded this reduction, while others, like agriculture, remain pollution-intensive.9
Tracking environmental pollution damage also affects apparent growth rates. How growth changes when pollution damage is deducted from GDP or VA depends on the relative rates of change. If pollution damage rises more rapidly than GDP or VA, then the adjusted measure (which deducts damage) will grow more slowly. Conversely, if pollution damage grows less rapidly, or falls over time, the adjusted measure of output will outpace GDP or VA. I have presented estimates of these effects in the US economy between 1957 and 2016.10 This period featured the passage of the Clean Air Act (CAA) in 1970 and its subsequent implementation through the 1970s, as well as several business cycles. This research suggests that pollution damage began to decrease just after the CAA was enacted, and the orientation between GDP growth and that of the adjusted measure, or environmentally adjusted value added (EVA), switched.
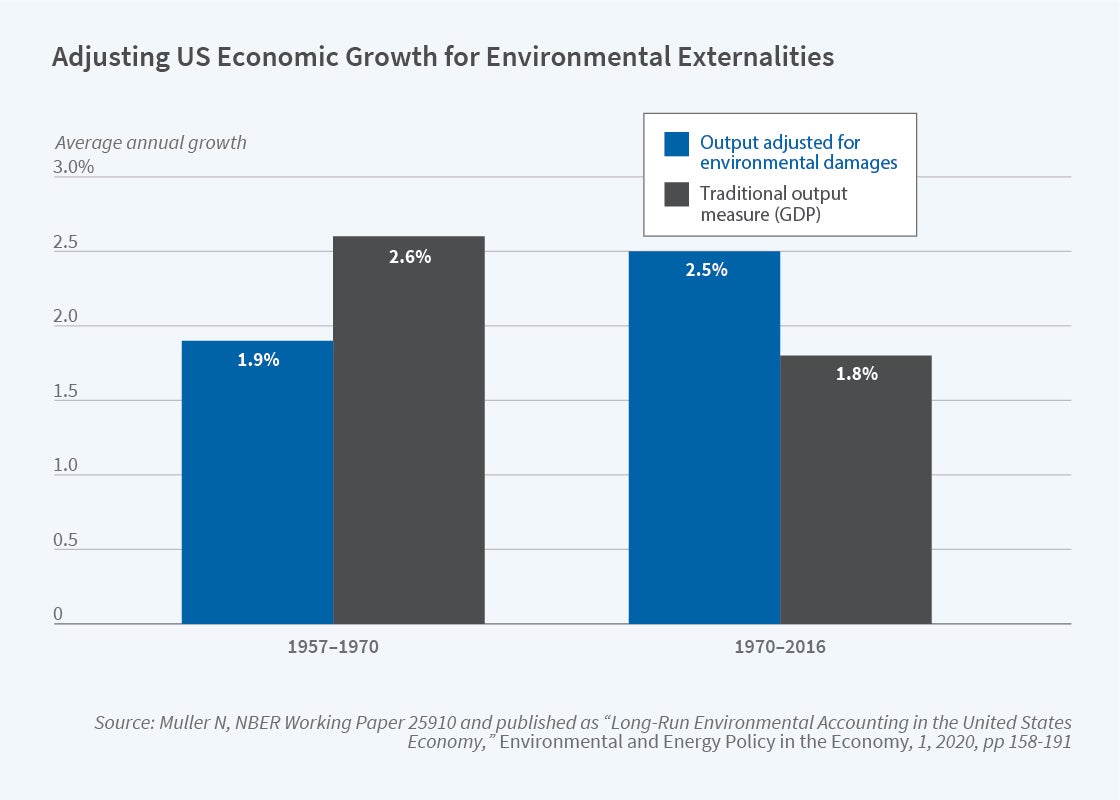
Prior to 1970, damage grew at above 4 percent annually, while GDP increased by between 2 and 3 percent. Thus, EVA grew by less than 2 percent. After the CAA became law in the 1970s, damage fell by 1 percent per year, GDP grew at a 2 percent rate, and EVA expanded by more than 3 percent.11 This reversal of the orientation between EVA and GDP growth rates before and after 1970 is shown in Figure 1. The heightened rate of EVA growth after 1970 has potentially broad implications for the measurement of productivity. As the United States allocated trillions of dollars to the provision of environmental public goods, GDP growth waned relative to its pre-1970 levels. But GDP fails to capture the returns to these investments. The estimates of EVA growth, while only a partial measure of the environmental benefits of the CAA and other environmental legislation, reveal that our productivity estimates might be appreciably affected if they were to include nonmarket pecuniary benefits of reduced pollution.12
The differences between GDP growth and EVA also have ramifications for monetary policy. One of the key determinants of central banks’ interest rate targets is the natural interest rate. This is conventionally defined as the rate at which an economy operates at its full potential. What comprises full potential depends on how output is measured. Specifically, recognizing pollution damage lowers real output in any given period relative to a measure that overlooks pollution. Policymakers’ expectations about trend growth in output also factor into estimates of the natural interest rate. As demonstrated above, EVA growth may diverge appreciably from GDP growth. My recent research explores the difference between conventional estimates of the natural interest rate and a green interest rate based on EVA.13 If policymakers were to employ the green interest rate target, pollution damage would fall because consumption is reallocated from periods of high pollution intensity to periods of low pollution intensity. The effect of this alternative rate is greatest following the introduction of binding environmental policy, during periods of rapid technological innovation, and over the business cycle. This research may inform central banks that have expressed concerns over direct risks from climate change and transition risk as the global economy decarbonizes.
Measuring environmental pollution damage also informs assessments of sustainability. Economists have defined sustainable growth as that which results in non-negative capital formation.14 Pollution damage is, in effect, natural capital depreciation. Thus, accounting for pollution has the potential to influence whether economies grow sustainably because rising pollution damage represents capital depreciation while falling damage is a form of capital appreciation.
A recent working paper computes air pollution and greenhouse gas damage for 168 countries from 1998 to 2018.15 This damage is then deducted from GDP to tabulate EVA. This research shows that North American and Western European economies have been cleaning up since the late 1990s. Damage as a percentage of GDP has fallen significantly in these countries. In contrast, China and India have grown considerably more pollution-intensive over this time. Countries in the lowest income category have shown no change in pollution intensity. A comparison of EVA and GDP growth rates reveals that EVA expanded more rapidly than GDP in Western Europe and North America. In contrast, GDP growth exceeded EVA growth in China and India by as much as 100 basis points during the period under study.
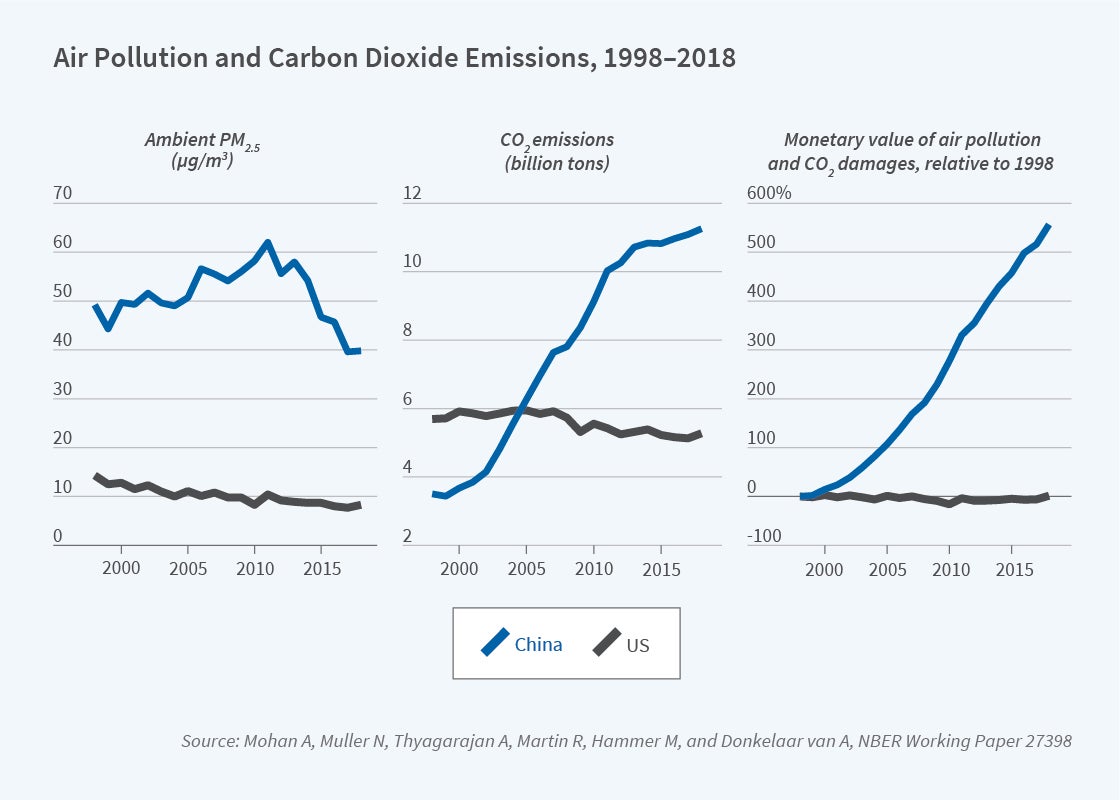
This research also compares sustainability defined in terms of emissions, as is done in prior work,16 and in terms of monetary damage. A comparison of the United States and China [Figure 2] demonstrates the importance of this distinction. Measures of ambient air pollution in China have fallen since 2012. Growth in carbon dioxide (CO2) emissions has decreased rapidly. Thus, one might conclude that China has begun to grow sustainably. In contrast, damage from air pollution and CO2 continues to rise rapidly. Thus, according to the definition of sustainable growth based on damages, China has not yet achieved a sustainable growth path.
Much of the prior work focusing on measuring pollution damage zeroes in on air pollution and greenhouse gases, but a notable exception examines the consequences of the Clean Water Act in terms of costs and benefits as capitalized into housing prices.17 Ongoing research on sustainable growth, and environmental accounting more generally, should focus on other pollutants beyond the local air pollutants and primary greenhouse gases discussed above, and on other pollution types such as water, solid waste, and toxins. Inclusion of these pollutants may appreciably affect the conclusions drawn from the research cited above.
Finally, though data sources and methods always may be improved, the techniques used to estimate pollution damage have matured to the point where regulators could develop a set of environmental accounts. Doing so has the potential to broadly affect the perceived performance of the US economy and the economies of others around the world.
Endnotes
“Is Growth Obsolete?” Nordhaus W, Tobin J. In The Measurement of Economic and Social Performance, Moss M, editor. New York, NBER, 1973.
“The Growth of Nations Revisited: Global Environmental Accounting from 1998 to 2018,” Mohan A, Muller N, Thyagarajan A, Martin R, Hammer M, van Donkelaar A. NBER Working Paper 27398, June 2020.
“An Analysis of the Association between US Mortality and Air Pollution,” Lave L, Seskin E. Journal of the American Statistical Association 68(342), 1973, pp. 284–290.
“The Life You Save May Be Your Own,” Schelling T. In Problems in Public Expenditure Analysis, Chase, Jr. S, editor, pp. 127–162. Washington, Brookings Institution, 1968. This work and its intellectual lineage was documented by H. S. Banzhaf in “The Cold-War Origins of the Value of a Statistical Life,” Journal of Economic Perspectives 28(4), Fall 2014, pp. 213–226.
“Toward the Measurement of Net Economic Welfare: Air Pollution Damage in the US National Accounts — 2002, 2005, 2008,” Muller N. In Measuring Economic Sustainability and Progress, Jorgensen D, Landefeld JS, Schreyer P, editors. Chicago, University of Chicago Press, 2014.
“Environmental Accounting for Pollution in the United States Economy,” Muller N, Mendelsohn R, Nordhaus W. American Economic Review 101(5), August 2011, pp. 1649–1675.
“Long-Run Environmental Accounting in the US Economy,” Muller N. In Environmental and Energy Policy and the Economy 1, 2020, pp. 158–191.
“Fine Particulate Matter Damages and Value Added in the US Economy,” Tschofen P, Azevedo I, Muller N. PNAS 116 (40), October 1, 2019, 19857–19862.
“Long-Run Environmental Accounting in the US Economy,” Muller N. In Environmental and Energy Policy and the Economy 1, 2020, pp.158–191.
“On the Green Interest Rate,” Muller N. NBER Working Paper 28891, June 2021.
“Intergenerational Equity and the Investing of Rents from Exhaustible Resources,” Hartwick J. American Economic Review 67(5), December 1977, pp. 972–974.
“The Growth of Nations Revisited: Global Environmental Accounting from 1998 to 2018,” Mohan A, Muller N, Thyagarajan A, Martin R, Hammer M, van Donkelaar A. NBER Working Paper 27398, June 2020.
“The Green Solow Model,” Brock W, Taylor M. Journal of Economic Growth 15(2), June 2010, pp. 127–153.
“Consequences of the Clean Water Act and the Demand for Water Quality,” Keiser D, Shapiro J. NBER Working Paper 23070, June 2018.


