Wealth Inequality in the United States
Much attention has focused in the last few years on the issue of inequality. With recent proposals for a direct wealth tax, particular attention has been given to wealth inequality. My work also focuses on this issue. Here, I summarize studies of four different aspects.
First, what are the general trends in wealth and wealth inequality over the last 60 years or so in the United States? I pay particular attention to the role of leverage and asset price movements in explaining these trends. Second, how has the racial wealth gap evolved over time, and what are the factors that account for its movement? Third, how does one account for the fact that certain assets like 401(k)s are tax-deferred? How does this affect the valuation of these assets and how does this impact measured inequality and wealth movements over time? Fourth, how might a direct tax on household wealth impact wealth inequality?
The Role of Leverage
In the first study, I examine wealth trends from 1962 to 2019.1 My empirical work in this and the next three papers is based mainly on data from the Federal Reserve Board’s Survey of Consumer Finances. In terms of median wealth, the year 2007 stands out as a true high-water mark. Median net worth in constant dollars showed robust growth over 1962–2001, gaining 1.55 percent per year, and rose even faster over 2001–07, at 2.90 percent per year. Then the Great Recession hit like a tsunami and wiped out 40 years of gains. Over 2007–10, house prices fell 24.5 percent in real terms, stock prices declined 26.6 percent, and median wealth was reduced by a staggering 43.9 percent. By 2010, median wealth was at about the same level as in 1969.
However, between 2010 and 2019 asset prices recovered, and median wealth advanced by a robust 41.9 percent. Still, it was 20.4 percent below its 2007 peak. Mean wealth more than fully recovered by 2016 and by 2019 it was up 9.2 percent from its 2007 level.
Wealth grew more vigorously at the top of the wealth distribution than in the middle. Indeed, according to the Gini coefficient and top wealth shares, wealth inequality rose sharply from 1983 to 1989 (the Gini coefficient was up 0.029), remained relatively stable from 1989 to 2007, then showed a steep increase over 2007–10 (the Gini was up 0.032), and a more modest rise from 2010 to 2016. By 2016, the Gini coefficient and the share of the top percentile were at their highest levels of the 57 years of the study period, at 0.877 and 39.6 percent, respectively. However, from 2016 to 2019 there was actually a small decline in inequality, with the top percentile share down by 1.4 percentage points, the Gini coefficient down by 0.008, and the mean wealth of the top 1 percent down by 1.9 percent.
Another notable trend is the sharp increase in relative debt after 1983, with the debt-income and the debt-net worth ratios peaking in 2010 and then receding. The overall homeownership rate rose from 63.4 percent in 1983 to a peak of 69.1 percent in 2004, then fell off to 64.9 percent in 2019. The overall stock ownership rate — either directly or indirectly through mutual funds, trust funds, or pension plans — after rising briskly from 31.7 percent to a peak of 51.9 percent over 1989–2001, fell off to 46.1 percent in 2013. It rebounded to 49.6 percent in 2019, though it was still down from its peak.
The key to understanding the plight of middle-class Americans in the years following the Great Recession is their high degree of leverage, the high concentration of assets in their homes, and the precipitous fall in home prices. This translated into a very high negative rate of return on their wealth (−10.4 percent per year), which largely explains the steep decline in median wealth over 2007–10. High leverage, moreover, helps explain why median wealth fell more than house prices over these years. The high negative rate of return accounted for 61 percent of the collapse in median net worth, with the other 39 percent due to dissaving.
What about the recovery in median wealth after 2010? In 2010–16, the rate of return should have led to a $42,600 increase in median wealth, while the actual increase was $12,200. Dissaving reduced the gain by $30,400. For 2016–19, both the rate of return and saving made positive contributions, explaining 85.6 and 14.4 percent of the gain, respectively.
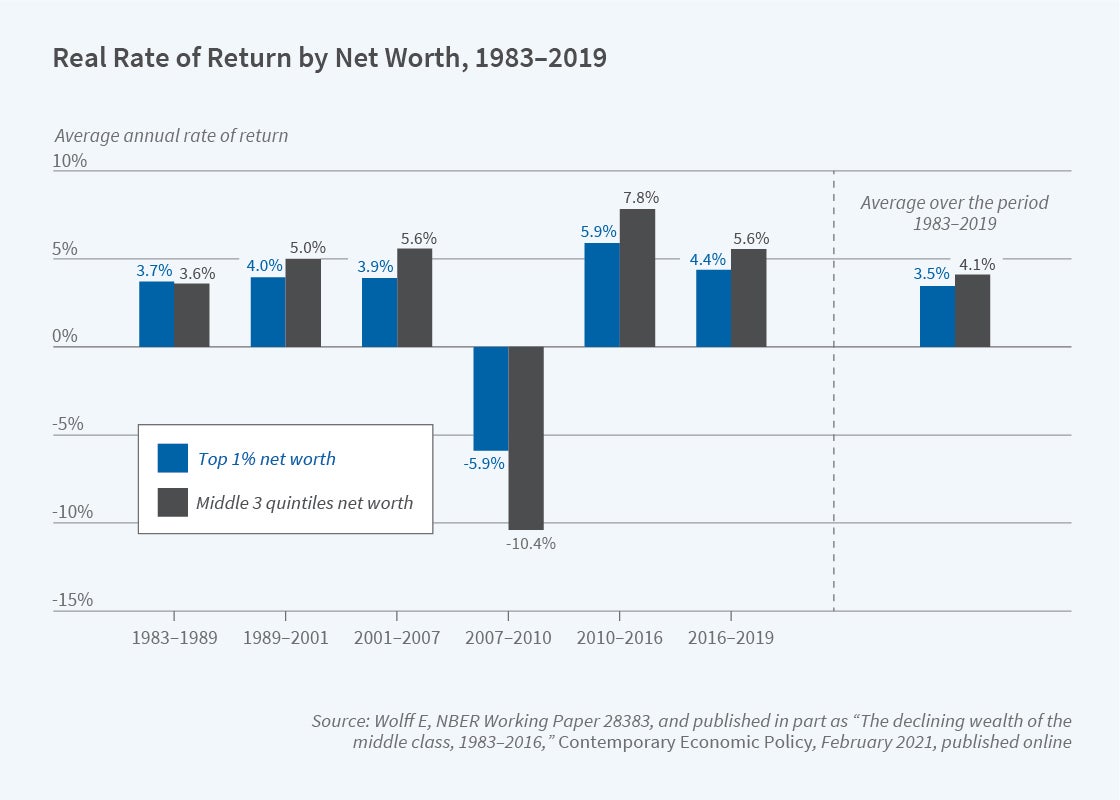
The large spread in returns between the middle three wealth quintiles and the top percentile — over 4 percentage points — also helps explain why wealth inequality climbed steeply from 2007 to 2010. It is first of note that, as shown in Figure 1, the return on net worth for the middle group exceeded that for the top percentile over the whole 1983–2019 period and for all subperiods except 1983–89 and 2007–10. A lot of theoretical work on wealth inequality assumes just the opposite relationship. In a decomposition analysis of the change in the ratio of the wealth of the top percentile to median wealth, the differential in returns between the two groups accounted for 28.7 percent of the increase in the inequality ratio over the Great Recession, with differences in saving accounting for the rest. The middle class took a bigger relative hit to its wealth from the home price plunge than the top 1 percent did from the stock market decline. There was a modest rise in the inequality ratio from 2010 to 2016. The same decomposition shows that the differential in returns between the two groups — now in favor of the middle group — should have led to a decline in the inequality ratio, while there actually was an increase. The inequality ratio fell a bit from 2016 to 2019. In this case, the rate of return difference — again in favor of the middle group — accounted for 18.2 percent of the decline and the residual accounted for 81.8 percent.
The Decline in Black and Hispanic Wealth
The year 2007 was also a watershed year for both the racial and ethnic wealth gaps.2 The ratios of mean net worth between Blacks and Whites and between Hispanics and non-Hispanic Whites reached their maximum values, 0.19 and 0.26, respectively. The Great Recession hit Black households much harder than White because Blacks were more highly leveraged and had a greater share of their assets in their homes; the racial ratio plunged to 0.14 in 2010, reflecting a 33 percent decline of Black wealth in real terms. The wealth gap remained unchanged from 2010 to 2019.
Hispanic households made sizable gains on White households from 1983 to 2007, with the mean net worth ratio growing from 0.16 to 0.26. However, like Blacks, Hispanics got hammered by the Great Recession, with their mean net worth plunging in half over 2007–10 and the wealth ratio falling from 0.26 to 0.15. The relative and absolute losses suffered by Hispanic households over these three years were also mainly due to their much higher leverage and greater concentration of assets in homes. Over 2010–16, the mean wealth ratio rebounded to 0.19, where it remained in 2019.
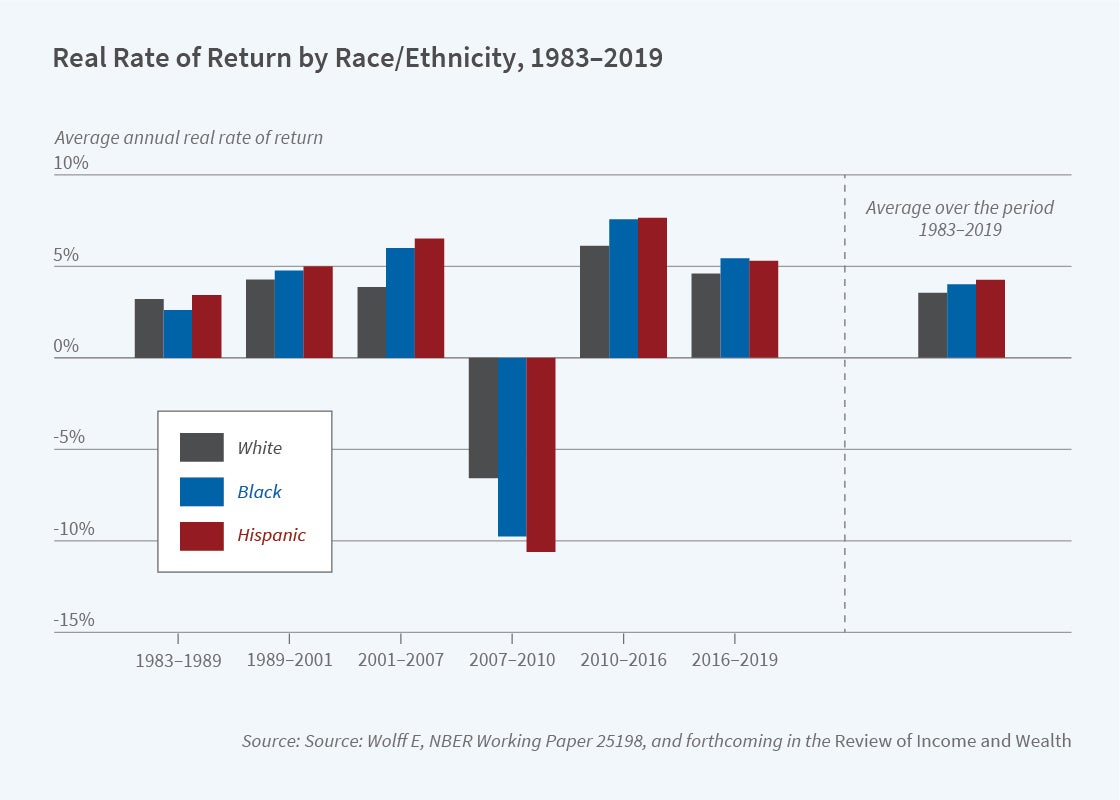
Differential leverage and resulting differences in rates of return on net worth play critical roles in accounting for movements in the wealth of minorities relative to Whites. Blacks and Hispanics had much higher indebtedness and a higher concentration of housing wealth than Whites. In 2007, the debt-net worth ratio among Black households was an astounding 0.553 and that for Hispanics was 0.511, compared to 0.154 among Whites. Housing as a share of gross assets was 54 percent for Blacks and 52.5 percent for Hispanics, compared to 30.8 percent for Whites. The rate of return on net worth for the Black and Hispanic middle groups surpassed that for Whites for the whole period 1983–2019 and for all subperiods except 1983–89 and 2007–10, as shown in Figure 2.
Using a decomposition analysis, I find that capital revaluation explains about three-quarters of the advance of mean wealth among Black households over 2001–07 and 78 percent of the ensuing collapse over 2007–10. Among Hispanics, the corresponding figures are 59 and 57 percent. Differentials in returns account for 43 percent of the gain in the Black-White wealth ratio over 2001–07 and 39 percent of the decline over 2007–10. Over 2010–19, the higher rate of return for Black households should have helped close the racial wealth gap, but this was offset by greater dissaving.
Likewise, disparities in returns account for 33 percent of the gain in the Hispanic-White wealth ratio in 2001–07 and 28 percent of the ensuing drop over 2007–10. Over 2010–16, the higher returns for Hispanic households explain 41.4 percent of their relative gains, but over 2016–19 this effect is neutralized by greater dissaving.
The racial gap in augmented wealth, defined as the sum of net worth, defined-benefit pension wealth, and Social Security wealth, is considerably smaller than that in net worth. The former is defined as the present value of expected future pension benefits and the latter as the present value of expected Social Security benefits. In 2016, while the Black-White ratio in mean net worth was 0.14 and that in median net worth a mere 0.02, the ratio in mean augmented wealth was 0.27 and that in median augmented wealth also 0.27. The ratios in mean defined-benefit pension and Social Security wealth were notably higher, at 0.50 and 0.60, respectively. Whereas the racial gap in net worth widened from 1983 to 2016, the gap in augmented wealth remained largely unchanged.
Taxes and the Revaluation of Household Wealth
The face value of 401(k)s, IRAs, and other tax-deferred assets cannot be directly valued with other components of wealth like houses, stocks, and securities because tax-deferred assets carry a substantial tax liability on withdrawal.3 For example, an IRA valued at $1,000 can yield considerably less than $1,000 when the asset is “cashed out.” Whether the net rate of return is higher with tax-deferred assets or directly investing in stocks depends on the income level of the investor, the time horizon, and the tax treatment of dividends.
I compare trends in wealth levels and wealth inequality with and without netting out this implicit tax liability.4 I also consider how netting out income taxes due on accrued capital gains impacts wealth trends for both conventional net worth and augmented wealth over the period 1983–2016.
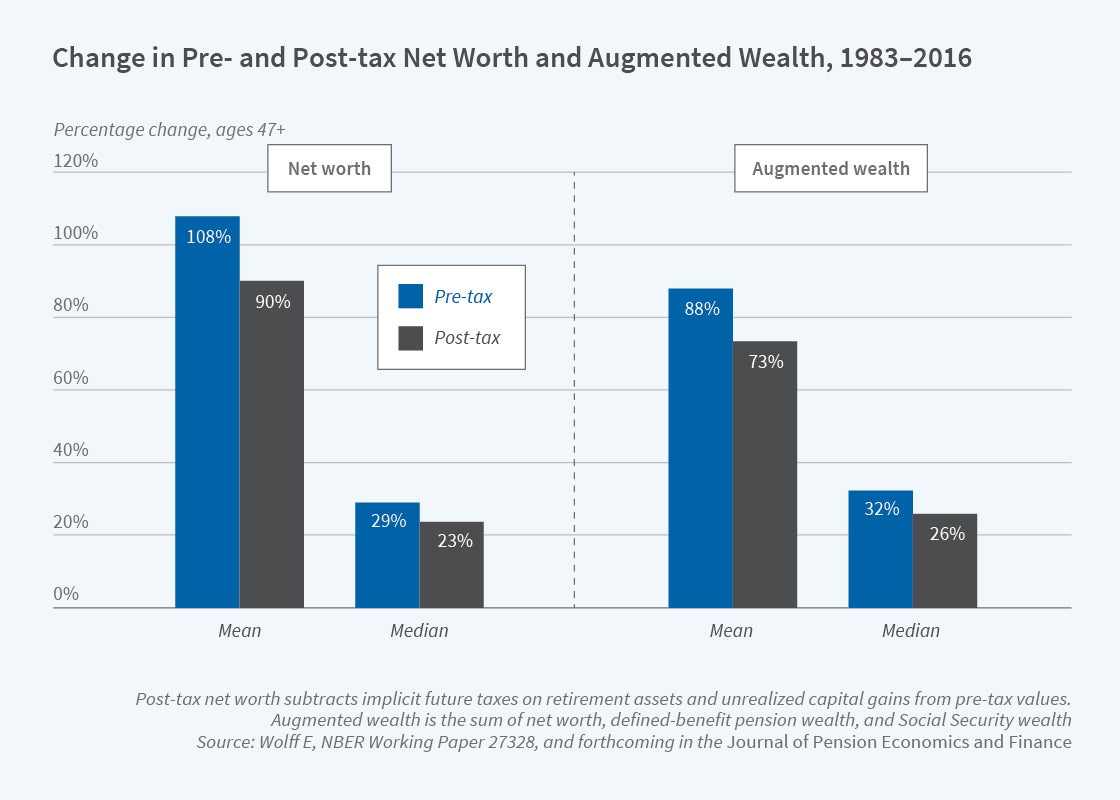
Netting out implicit taxes on tax-deferred assets and accrued capital gains reduces the growth in net worth and augmented wealth by between 17 and 20 percent [see Figure 3] but has little impact on their inequality. However, it does lower pension wealth and Social Security wealth inequality. The implication is that the use of pre-tax values has led to a considerable overstatement of household wealth growth.
The impact of implicit taxes varies by demographic group. Netting out taxes is generally an equalizing factor with regard to intergroup differences in pension and Social Security wealth, though less so for net worth or augmented wealth. It has a minimal effect on the Black-White ratio in net worth or augmented wealth.
Distributional Effects of Wealth Taxation
I also analyze the fiscal effects of a Swiss-type direct tax on household wealth, with a $120,000 exemption and marginal tax rates running from 0.05 to 0.3 percent on $2,400,000 or more of wealth.5 I also analyze the wealth tax proposed by Senator Elizabeth Warren with a $50 million exemption, a 2 percent tax on wealth above that, and a 1 percent surcharge on wealth above $1 billion. Based on the 2016 Survey of Consumer Finances augmented with wealth data from the Forbes 400, the Swiss tax would yield $189.3 billion and the Warren tax $303.4 billion per year by my estimates. Only 0.07 percent of households would pay the Warren tax, compared to 44.3 percent for the Swiss tax. However, the effect on wealth inequality of implementing either the Swiss tax or the Warren tax is small. If the policies were in place for a single year, they would reduce the Gini coefficient by at most 0.0005. The effect of both policies on wealth inequality would grow if they remained in place for a long period of time.
The incidence of the Swiss tax differs by demographic group, falling proportionately more on older than younger families, more on married couples than on singles, and more on Whites than on others.
A potential problem stemming from a wealth tax is capital flight. However, by my estimates, the Swiss tax would reduce the average yield on household assets by only 6.2 percent. It would reduce the yield in the top bracket by 9.7 percent. These figures suggest that disincentive effects on personal savings would be very modest. In contrast, the Warren wealth tax could reduce the after-tax rate of return on investments for the top group by almost 100 percent.
Endnotes
“Household Wealth Trends in the United States, 1962 to 2019: Median Wealth Rebounds … But Not Enough,” Wolff E. NBER Working Paper 28383, January 2021. Published in part as “The Declining Wealth of the Middle Class, 1983–2016,” Contemporary Economic Policy 39(3), July 2021, pp. 461–478.
“The Decline of African-American and Hispanic Wealth since the Great Recession,” Wolff E. NBER Working Paper 25198, October 2018, and Review of Income and Wealth, forthcoming.
“Valuing Assets in Retirement Savings Accounts,” Poterba J. NBER Working Paper 10395, March 2004. Published in National Tax Journal 57(2, Part 2), 2004, pp. 489–512.
“Taxes and the Revaluation of Household Wealth,” Wolff E. NBER Working Paper 27328, June 2020, and Journal of Pension Economics and Finance, forthcoming.
“Wealth Taxation in the United States,” Wolff E. NBER Working Paper 26544, December 2019, and Public Sector Economics 44(2), June 2020, pp. 153–178.


