COVID’s Lessons for Future Modeling of Pandemics
During the first half of the 20th century, Americans enjoyed tremendous gains in health and life expectancy as large investments in sanitation, public health, and medicine resulted in the conquest of infectious diseases. Crude annual mortality rates from infectious disease in the United States fell by an order of magnitude: from nearly 800 per 100,000 in 1900 to fewer than 50 per 100,000 by 1960, with the steady downward trend interrupted dramatically by the Great Influenza Pandemic of 1918–19.1
But, as the emergence of HIV/AIDS and now COVID-19 as worldwide pandemics has made clear, the threat to health, life, and economic prosperity from infectious disease is far from vanquished.2
If there is one lesson economists can take away from the public health and economic disaster of COVID-19, it is that we should strive to have a better understanding of the interaction of behavior and the spread of infectious disease so that we might be better prepared with public health and economic policy tools to contain the damage from the next emergent pandemic. After one year of data on COVID, it is clear that endogenous public and private behavior aimed at slowing disease transmission has played an important role in shaping the evolution of this pandemic and in constraining the potential impact of the policy tools available to improve public health and economic outcomes.
I started working on COVID-19 in early 2020 as the virus emerged in China and led to stringent lockdowns of millions in that country. In my first paper on the topic, I spelled out the implications of a standard epidemiological model for the peak prevalence and long-run impact of the disease here in the United States, using parameters estimated from the early data on COVID-19 from China.3, 4 Models like this one have been widely used to guide the public health response to COVID-19 around the world.
Three quantitative implications of this standard epidemiological model stand out. First, the model gave dire forecasts for the peak of the first wave of the disease absent drastic efforts to slow transmission. Second, it forecast that if efforts to slow transmission were applied early but were only temporary, this dramatic peak of the first wave would simply be delayed. Cases and deaths would explode again once efforts to slow transmission were relaxed. Third, the model offered dramatic predictions for the long-run impact of the disease: more than two-thirds of the population would experience infections or need to be vaccinated before the pandemic would come to an end.5
It is now clear that the first two predictions of this standard model were off by at least an order of magnitude. The model predicted that the portion of the population with active infections at the first peak would range from 10 to 20 percent, or between 33 million and 66 million simultaneous active infections. Given current parameter estimates suggested by the Centers for Disease Control and Prevention for use in modeling COVID-19, this peak of infections would have resulted in a peak of roughly 30,000 to 60,000 deaths in the United States per day.6 Certainly if anything like this outcome had occurred, the impact of the pandemic on economies worldwide in the spring of 2020 would have been much larger than what we saw. Nothing of the sort happened anywhere in the world.
Looking at the evolution of the pandemic across a large number of countries worldwide and in US states, Karen Kopecky, Tao Zha, and I document that the second main implication of the standard epidemiological model was also off by a wide margin.7 While many locations in the world have suffered severe second or third waves of COVID deaths after relaxing costly public measures to control disease transmission, the scale of these waves has been much smaller than predicted from standard models. The growth rates of daily infections and deaths from COVID never returned to the extraordinarily high levels seen in many locations around the world in March 2020.
What about the third prediction, regarding the long-run impact of the disease? Empirically, the question of what percentage of the population has to gain immunity to COVID-19 either through prior infection or vaccination before the pandemic will come to an end is not yet fully resolved. But the available data from locations such as Manaus, Brazil, which has experienced high rates of infection, and Israel, which has high vaccination rates, indicate that the predictions of a standard epidemiological model for the long-run impact of COVID are likely correct.
How does consideration of the impact of behavior on the progression of a pandemic help us understand this relationship between model predictions and observed outcomes? Within economics, Tomas Philipson pioneered the study of the interaction of behavior and the spread of disease in his work on the HIV/AIDS pandemic. In a 1999 chapter summarizing work on that pandemic, Philipson argued for the incorporation into epidemiological models of prevalence-elastic private demand for prevention of the spread of infectious disease.8 He argued that such models offer two fundamental economic insights into the interaction of behavior and public health. The first of these is that costly private behavior to prevent disease transmission is self-limiting: as disease incidence falls, private efforts at disease control are relaxed and the disease reemerges. The second is that public interventions aimed at disease control are less beneficial than might be anticipated, given offsetting private responses.
I believe the insight that the demand, both public and private, for costly measures to control disease is self-limiting if it depends on disease prevalence is particularly powerful for understanding where a standard epidemiological model fails and where such a model succeeds in matching the data. Kopecky, Zha, and I argue that the data on the progression of the COVID pandemic across many countries and the US states throughout 2020 conform strikingly well with a core prediction of a simple epidemiological model modified to include prevalence-elastic demand for disease prevention: that after the first phase of the pandemic in which disease grows rapidly, the growth rates of infections and deaths should remain in a relatively narrow band around zero until the pandemic is over.9, 10 However, according to such a model, the pandemic ends only when, at pre-pandemic patterns of behavior, the fraction of the population that remains susceptible to the disease has fallen, either through infection or vaccination, below the herd immunity threshold given by the inverse of the basic reproduction number measured with pre-pandemic patterns of behavior. That is, the predictions for the long-run impact of COVID-19 made in March 2020 using a standard epidemiological model should continue to hold. 11
The intuition for this result is simple: if the prevalence of the disease falls toward zero, then the demand for costly disease prevention efforts also falls toward zero, and thus the disease will come back unless the population has already achieved herd immunity measured at pre-pandemic levels of behavior. Given estimates of the basic reproduction number in the range of 2.5 or now higher with new variants, this herd immunity threshold should kick in when significantly less than 40 percent of the population remains susceptible.
In my most recent paper on COVID-19, I build a parsimonious quantitative epidemiological model with a behavioral response to disease prevalence that might be useful for evaluating the impact of public health interventions and natural shocks such as the emergence of new virus strains on the evolution of epidemics.12 The challenge here is to find model specifications that can match the magnitude of the waves of disease prevalence that we have seen in many locations around the world in a plausible model with a relatively stable structure over time. I propose such a model and apply it to account for the evolution of the COVID-19 pandemic over the past year in the United States and the United Kingdom. I model the impact of natural shocks to transmission rates due to seasonality and the emergence of new, more transmissible variants of the COVID virus, as well as potential changes in the demand for costly measures to mitigate disease transmission.
I find that this parsimonious model can account for the evolution of the COVID pandemic in these two countries remarkably well. I find that a seasonal decline in transmission rates is an important component of the explanation as to why the prevalence of COVID dropped to such low levels in the summer of 2020 in the United States and the United Kingdom, while declines in the strength of the behavioral response to disease prevalence in the late fall were an important component of the explanation for the large waves of infections and deaths seen in the late fall and winter.
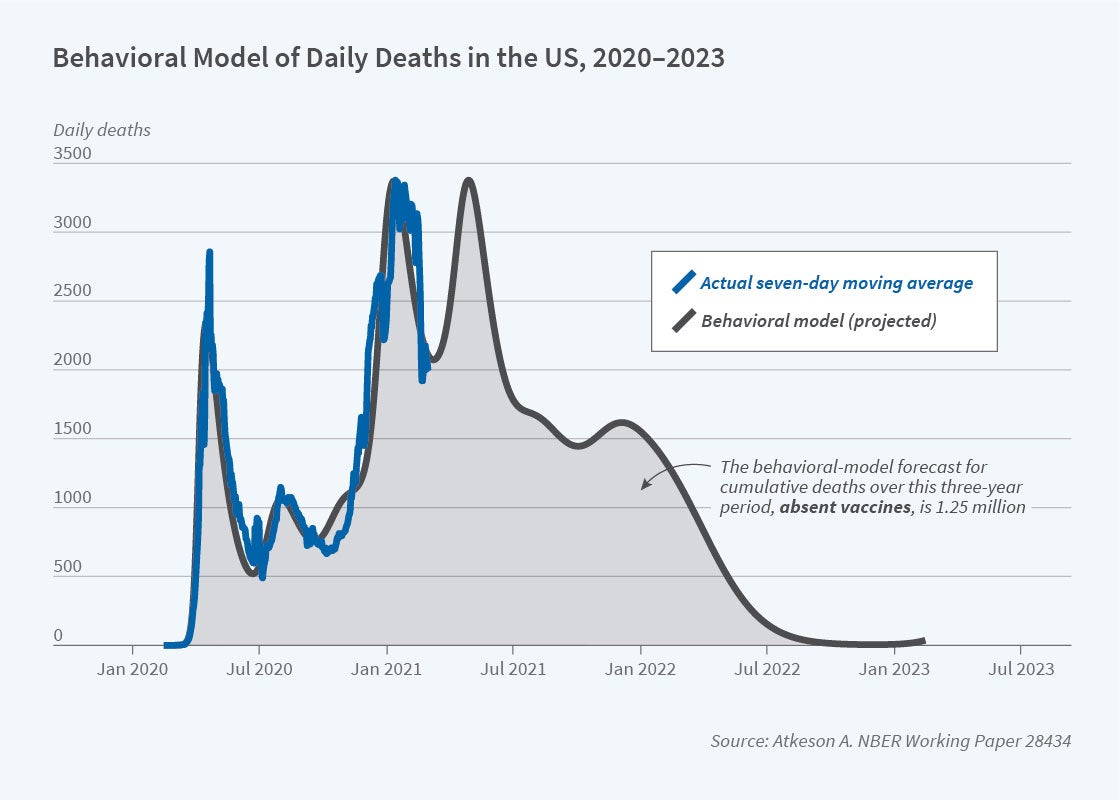
I use this model to generate forecasts for the evolution of the pandemic going forward over the next two years in both the US and UK, with the new, more contagious variant arriving in the model for the United States in December 2020. The transmission rate for this new variant in the model is set to match measures of the variant B.1.1.7 now prevalent in the United Kingdom. For purposes of comparison with implications of the standard epidemiological model I studied in March 2020, I show these forecasts without consideration of the impact of vaccines on the course of the pandemic. In Figure 1, I show in blue the prediction from the epidemiological model with a behavioral response to disease prevalence for the evolution of daily deaths from COVID-19 in the United States of the period from mid-February 2020 through mid-February 2022. I show data on the seven-day moving average of daily deaths in the United States over the past year in blue. We see in this figure that the behavioral model matches the data on deaths over the past year quite well, and it forecasts, absent vaccines, a continuation of the pandemic well into 2022. The cumulative death toll in this forecast is 1.25 million.
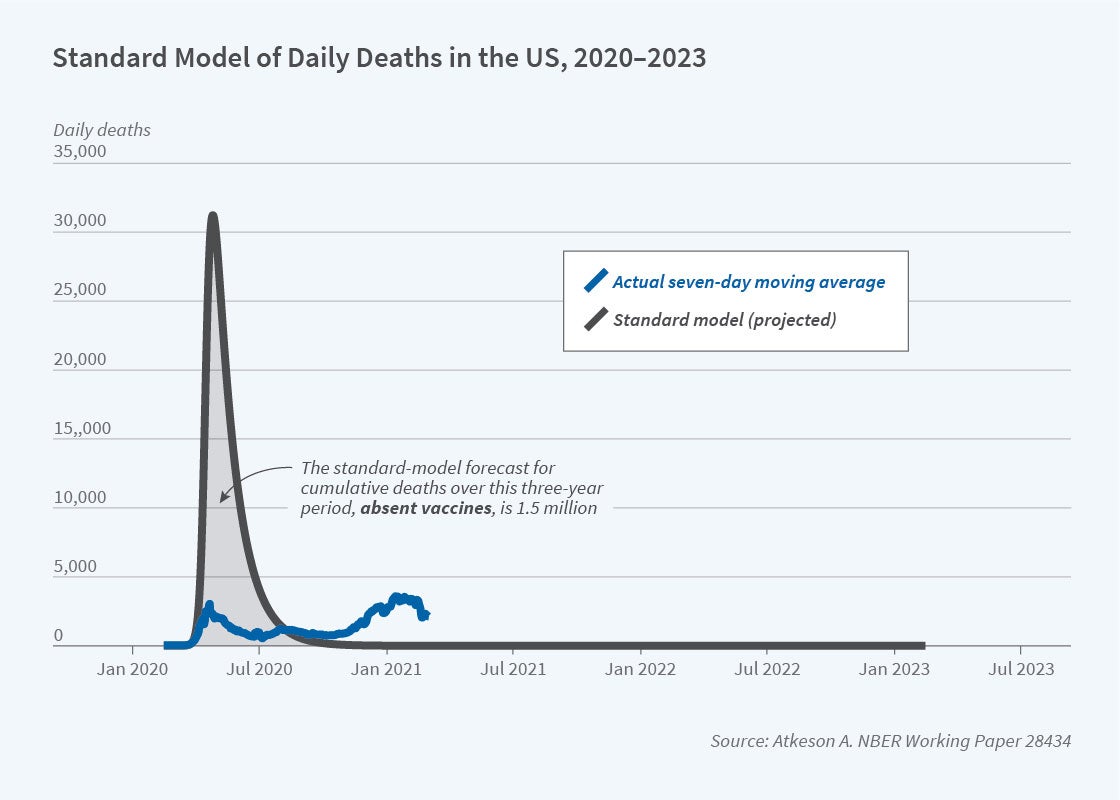
To make the comparison with a standard epidemiological model clear, in Figure 2, I show, again in blue, the prediction of the same model with the behavioral response of transmission to disease prevalence turned off, and the data on daily deaths from the past year again shown in blue. As is clear from this figure, the standard model overstates the first peak of daily deaths by at least an order of magnitude (these peak at over 30,000/day), but then the pandemic comes quickly to an end in the fall of 2020. The cumulative death toll in this forecast is 1.5 million. This prediction for the cumulative death toll is certainly larger than in the model with a behavioral response, but the gap between the two models in this dimension is much smaller than their predictions for the initial peak and the time scale of the pandemic.
What is clear from these figures is that an epidemiological model with a response of public and private behavior to disease prevalence gives a dramatically different forecast for the severity of disease peaks, even with a relaxation of mitigation behavior, and for the speed with which the pandemic plays out over time. In this behavioral model, the pandemic takes two and a half years to play out rather than six to nine months. At the same time, the model’s implication for the long-run impact of the disease in terms of the portion of the population experiencing it remains the same: a substantial majority of the population must become immune through infection or vaccination for the pandemic to come to an end.
Given these insights on the impact of behavior on the dynamics of the COVID pandemic, what can we learn about the room for policy to impact health and economic outcomes in the face of potentially offsetting private behavioral responses?13
A number of NBER researchers have compared the health and economic impacts of the Great Influenza Pandemic of 1918–1919 and COVID-19 across regions of the United States and countries around the world. If we take it as a given that the evolution of this pandemic has been shaped by both a public and private prevalence-elastic demand for disease prevention, what relationship should we expect to see in such data? In a comment on a report on the macroeconomic impact of COVID-19 by Jesús Fernández-Villaverde and Charles Jones,14 I use a simple Susceptible/Infected/Recovered (SIR) model with prevalence-elastic demand for disease prevention to argue that the answer to this question depends on the source of heterogeneity across countries or regions. If countries or regions vary primarily in the transmissibility of the virus holding behavior fixed due to predetermined natural or cultural factors,15 then one should see higher cumulative deaths associated with larger cumulative losses of economic activity six months or so into the pandemic. Instead, if countries or regions vary primarily in the elasticity of the response of private and public behavior to disease prevalence,16 then one should see the reverse: higher cumulative deaths from COVID-19 should be associated with smaller cumulative losses of economic activity six months or so into the pandemic. Clearly, then, interpretation of cross-country or cross-regional data on outcomes will depend on good measurement of the sources of heterogeneity across countries or regions, as well as on the timing of the data within the overall evolution of the pandemic.
Many economists have looked at the possibilities for improving both health and economic outcomes through targeted public health measures such as wide-scale testing and contact tracing.17 In work with Michael Droste, Michael Mina, and James Stock, I seek to quantify those benefits taking into account not only the technological and cost properties of the tests but also the behavioral responses of agents in complying with quarantine and in response to any decline in disease prevalence brought about by the success of testing and quarantine.18 While we find substantial economic benefits from such a program, it is clear that behavioral responses are critical to determining this success. Real-world attempts to control COVID-19 with mass testing once the disease was well established have met with mixed results, in large part because of differing behavioral responses to testing.19
It is my hope that economists take up the task of developing quantitative economic epidemiological models to help us do a better job with our policy responses the next time we encounter an emergent infectious pandemic.
Endnotes
“Trends in Infectious Disease Mortality in the United States during the 20th Century,” Armstrong G, Conn L, Pinner R. Journal of the American Medical Association 281(1), January 1999, pp. 61–66.
“Emerging Pandemic Diseases: How We Got to COVID-19,” Morens D, Fauci A. Cell 182(5), September 2020, pp. 1077–1092. See also this September 2019 report from the President’s Council of Economic Advisers on the potential public health and economic impact of pandemic influenza. To place the mortality rate from COVID-19 in historical perspective, note that COVID mortality in the United States was roughly 100 in 100,000 in 2020 and may very well reach this level again in 2021. So while mortality from COVID will not reach the levels reached during the 1918–19 influenza pandemic, it will clearly be the most significant short-term increase in mortality from infectious disease in the United States in at least 60 years.
“What Will Be the Economic Impact of COVID-19 in the US? Rough Estimates of Disease Scenarios,” Atkeson A. NBER Working Paper 26867, March 2020.
Later data from other countries suggest that COVID progresses at substantially faster rates than initially estimated in China. Thus, if one were to update the analysis in my paper from March 2020, the time scale on the x axis of all of the figures would be substantially shortened. In a contemporaneous paper, James H. Stock used a similar standard epidemiological model to arrive at similar forecasts for peak infections and the long-run impact of the disease. “Data Gaps and the Policy Response to the Novel Coronavirus,” Stock J. NBER Working Paper 26902, March 2020. His estimates of the time scale of the pandemic are closer to those that have been observed outside of China.
These implications of a standard epidemiological model for the magnitude of the first peak and the long-run impact of COVID-19 are driven by estimates of the basic reproduction number of the virus (the R0 ) from early data in China. “Herd Immunity: Understanding COVID-19,” Randolph H, Barreiro L. Immunity 52(5), May 2020, pp. 737–741, offers a description of the calculations and considerations involved. Data on the recent emergence of more virulent variants of COVID-19 in the United Kingdom and elsewhere yield higher estimates of this basic reproduction number. Thus, if I were to update this first paper with new parameter estimates, the implications for the peak of active infections and the long-run impact of COVID-19 would be even more dire.
Note the range of parameter estimates suggested by the CDC in Table 1 here: https://www.cdc.gov/coronavirus/2019-ncov/hcp/planning-scenarios.html.
“Estimating and Forecasting Disease Scenarios for COVID-19 with an SIR Model,” Atkeson A, Kopecky K, Zha T. NBER Working Paper 27335, June 2020. Here we propose a method for estimating epidemiological models with time-varying transmission rates; “How Deadly Is COVID-19? Understanding the Difficulties with Estimation of Its Fatality Rate,” Atkeson, A. NBER Working Paper 26965, April 2020. In this paper I examine some of the challenges in identifying model parameters from aggregate time series data; In “Four Stylized Facts about COVID-19,” Atkeson A, Kopecky K, Zha T. NBER Working Paper 27719, August 2020, we describe our findings regarding the evolution of the COVID-19 pandemic through the summer of 2020.
“Economic Epidemiology and Infectious Diseases,” Philipson T. NBER Working Paper 7037, March 1999.
“Behavior and the Transmission of COVID-19,” Atkeson A, Kopecky K, Zha T. Federal Reserve Bank of Minneapolis, Staff Report 618, February 2021.
“The Economic Consequences of R̂=1: Toward a Workable Behavioral Epidemiological Model of Pandemics,” Gans J. NBER Working Paper 27632, July 2020. Joshua Gans reviews the implications of epidemiological models with a prevalence-elastic demand for costly measures to prevent disease transmission and much of the work by NBER affiliates on this topic.
See “Resurgence of COVID-19 in Manaus, Brazil, despite High Seroprevalence,” Sabino E, Buss L, Carvalho M, Prete C, Crispim M, Fraiji N, et al. Lancet 297(10273) February 2021, pp. 452–455, and “Vaccines Are Curbing COVID: Data from Israel Show Drop in Infections,” Mallapaty S. Nature 590(197), February 2021, regarding data from Brazil and Israel on the empirical herd immunity threshold. More complex models that emphasize heterogeneity and the network structure of human interaction potentially offer more optimistic implications for the long-run impact of COVID. See, for example: “Implications of Heterogeneous SIR Models for Analyses of COVID-19,” Ellison G. NBER Working Paper 27373, June 2020; “Socioeconomic Network Heterogeneity and Pandemic Policy Response,” Akbarpour M, Cook C, Marzuoli A, Mongey S, Nagaraj A, Saccarola M, Tebaldi P, Vasserman S, Yang H. NBER Working Paper 27374, June 2020; “Pandemic Control in ECON-EPI Networks,” Azzimonti M, Fogli A, Perri F, Ponder M. NBER Working Paper 27741, August 2020; “Integrated Epi-Econ Assessment,” Boppart T, Harmenberg K, Hassler J, Krusell P, Olsson J. NBER Working Paper 28282, December 2020. Recent research “Immunological Characteristics Govern the Transition of COVID-19 to Endemicity,” Lavine J, Bjornstad O, Antia R. Science 371(6530), February 2021, pp. 741–745 forecasts that COVID-19 may become endemic if immunity is only temporary, as is the case for other coronaviruses.
“A Parsimonious Behavioral SEIR Model of the 2020 COVID Epidemic in the United States and the United Kingdom,” Atkeson A. NBER Working Paper 28434, February 2021.
Given the wide variety of public policies to slow COVID transmission worldwide, ranging from strict to none, this finding of a nearly universal decline in the growth of the pandemic suggests that private behavioral responses played a prominent role in limiting peaks of infections and deaths. A great deal of research by NBER affiliates, much of it summarized by Sumheda Gupta and his coauthors in “Mandated and Voluntary Social Distancing during the COVID-19 Epidemic: A Review,” Gupta S, Simon K, Wing C. NBER Working Paper 28139, November 2020, documents in detail the importance of costly private efforts to prevent disease transmission in shaping the early phase of this pandemic.
"Macroeconomic Outcomes and COVID-19: A Progress Report,” Fernández-Villaverde J, Jones C. NBER Working Paper 28004, October 2020; “How Should We Interpret the Cross Country or Region Relationship between Cumulative Deaths and Lost Economic Activity from COVID?” Atkeson A. October 2020. Both these papers are forthcoming in Brookings Papers on Economic Activity.
“What Explains Temporal and Geographic Variations in the Early US Coronavirus Pandemic?” Allcott H, Boxell L, Conway J, Ferguson B, Gentzkow M, Goldman B. NBER Working Paper 27965, October 2020, examines the importance of such factors for explaining the early evolution of the pandemic across many locations. See also “Modeling Infectious Disease Dynamics,” Cobey S. Science 368(6492), May 2020, pp. 713–714.
“Social Distancing and Social Capital: Why US Counties Respond Differently to COVID-19,” Ding W, Levine R, Lin C, Xie W. NBER Working Paper 27393, June 2020; “Polarization and Public Health: Partisan Differences in Social Distancing during the Coronavirus Pandemic,” Allcott H, Boxell L, Conway J, Gentzkow M, Thaler M, Yang D. NBER Working Paper 26946, April 2020; “Inequality and the Coronavirus: Socioeconomic Covariates of Behavioral Responses and Viral Outcomes across US Counties,” Brown C, Ravallion M. NBER Working Paper 27549, July 2020.
See “National COVID-19 Testing Action Plan,” The Rockefeller Foundation, as advocated by Paul Romer, as well as “An SEIR Infectious Disease Model with Testing and Conditional Quarantine,” Berger D, Herkenhoff K, Mongey S. NBER Working Paper 26901, March 2020; “The Macroeconomics of Testing and Quarantining,” Eichenbaum M, Rebelo S, Trabandt M. NBER Working Paper 27104, August 2020; “The Cost of Privacy: Welfare Effects of the Disclosure of COVID-19 Cases,” Argente D, Hsieh C, Lee M. NBER Working Paper 27220, May 2020; “Testing, Voluntary Social Distancing and the Spread of an Infection,” Acemoglu D, Makhdoumi A, Malekian A, Ozdaglar A. NBER Working Paper 27483, July 2020; “Group Testing in a Pandemic: The Role of Frequent Testing, Correlated Risk, and Machine Learning,” Augenblick N, Kolstad J, Obermeyer Z, Wang A. NBER Working Paper 27457, July 2020; “A Theory of Voluntary Testing and Self-Isolation in an Ongoing Pandemic,” Hellmann T, Thiele V. NBER Working Paper 27941, October 2020.
“Economic Benefits of COVID-19 Screening Tests,” Atkeson A, Droste M, Mina M, Stock J. NBER Working Paper 28031, October 2020.
The University of Illinois, Urbana-Champaign has conducted one of the largest mass testing campaigns among universities with remarkable results after an initial difficulty with compliance with quarantines. The mass testing pilot conducted in Liverpool, England, had less favorable outcomes due to problems with uptake of testing.


