What Drives Stock Price Fluctuations? Expected Cash Flows Versus Expected Returns
One leading view in finance is that the high volatility of the stock market valuations of US corporations is driven by large fluctuations in expected returns. However, if expected returns are so volatile, why is the capital stock of the same US corporations relatively stable? In Reconciling Macroeconomics and Finance for the US Corporate Sector: 1929 to Present (NBER Working Paper 33459), researchers Andrew Atkeson, Jonathan Heathcote, and Fabrizio Perri seek to reconcile these seemingly discordant observations.
Fluctuations in expected cash flows, not expected returns, are the primary drivers of volatility in US corporate valuations.
The researchers analyze the Integrated Macroeconomic Accounts (IMA) for the United States, a unified dataset developed jointly by the Bureau of Economic Analysis and the Federal Reserve Board. The IMA combines data on macroeconomic flows from the National Income and Product Accounts with comprehensive financial information from the Financial Accounts of the United States. It provides internally consistent income statements, cash flow statements, and market value balance sheets for major US economic sectors.
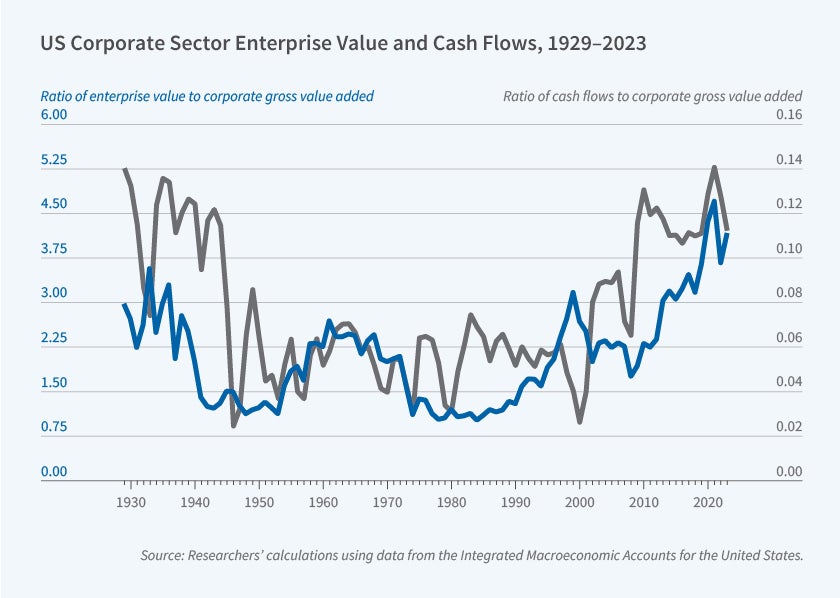
Using data from the IMA, the researchers construct new series for enterprise value and cash flows of US corporations, which are reproduced in the graph. IMA cash flows include all payouts to firms’ stakeholders. IMA enterprise value tracks closely standard measures of US stock market valuations. However, relative to standard series of payouts used in the literature (i.e., dividends), the IMA cash flows display higher volatility and higher low frequency comovement with enterprise value. Because of these features, when the researchers use a standard valuation model to interpret the fluctuations in US enterprise value, they find that fluctuations in expected IMA cash flows have been the dominant driver of changes in valuations. Variations in expected rates of return play a smaller role.
To understand the source of fluctuations in expected IMA cash flows, the researchers use the concept of “factorless income,” a pure rent paid to firm owners that is not attributable to either capital or labor inputs. This concept allows for a decomposition of corporate cash flows and valuations into components associated with earnings from physical capital and factorless income. Before World War II, the decline in the value of physical capital explained much of the expected cash flows and thus enterprise value. After World War II, however, fluctuations in the value of factorless income account for the majority of variation in expected cash flows and enterprise value.
Since only minor fluctuations in expected returns are needed to understand fluctuations in valuations, once these fluctuations are inserted in a standard macro model of consumption and investment, the researchers find that the resulting capital stock can match the stable series of the observed capital stock of US corporations well. In particular, focusing on the post-1990s period, the researchers find that a modest decline in US expected growth is sufficient to explain declining risk-free rates and a return premium on corporate sector investments relative to risk-free rates that is quite stable at around 5 percentage points.


