Are US Treasury Bonds Still a Safe Haven?
Safe assets are integral to the functioning of banks, financial markets, and the international financial system. Financial market participants use safe assets to meet liquidity and transaction needs, as high-quality collateral for loans and derivative contracts, and as default-free stores of value. These services imply a nonpecuniary return on safe assets, a convenience yield, that drives up the prices of safe assets and lowers their expected return in equilibrium.
The clearest example of the existence of a safe-asset convenience yield comes from examining US Treasury bonds. US Treasuries have been the premier safe asset around the world for the past several decades, although events in the recent COVID-19 crisis raise the specter that this reign may end, as we review later in this article.
The left panel of Figure 1 plots the spread in yields between long-term AAA corporate bonds and Treasury bonds against the total stock of privately held US Treasury bonds, using annual data from 1919 to 2008. The figure traces out a convenience-demand function for safe assets, akin to a money-demand function. Krishnamurthy and Annette Vissing-Jorgensen infer from this relation that the average convenience yield on Treasury debt over their sample is 75 basis points.1
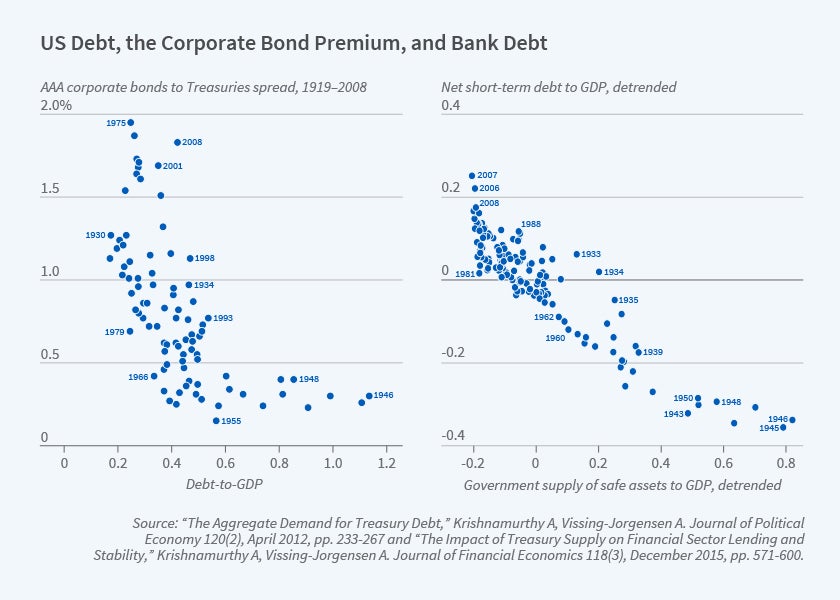
There is ample evidence that some private safe assets carry convenience yields, the most significant example being short-term debt issued by financial institutions, including banks. Gary Gorton argues that this shapes the structure and operation of the banking system.2 Figure 1’s right-side panel plots the quantity of outstanding short-term financial sector debt against the supply of government safe assets, including gold certificates in the early part of the sample, from 1874 to 2014. The figure illustrates that bank debt is a substitute for government debt: less government debt increases the convenience yield on safe assets (left panel) and induces the banking sector to take advantage of the higher convenience yield by increasing their issuance of bank debt (right panel).
International Dimensions
Although we have reviewed evidence from the United States, it is likely that government and bank debt in other advanced countries also bear a convenience yield, and that the forces we have described above carry over to these countries. Marco Del Negro, Domenico Giannone, Marc P. Giannoni, and Andrea Tambalotti argue that this factor helps explain the low neutral real rate of interest across advanced economies.3 Nevertheless, US dollar safe assets are noteworthy relative to those of other countries in carrying a higher convenience yield and shaping the international financial system.
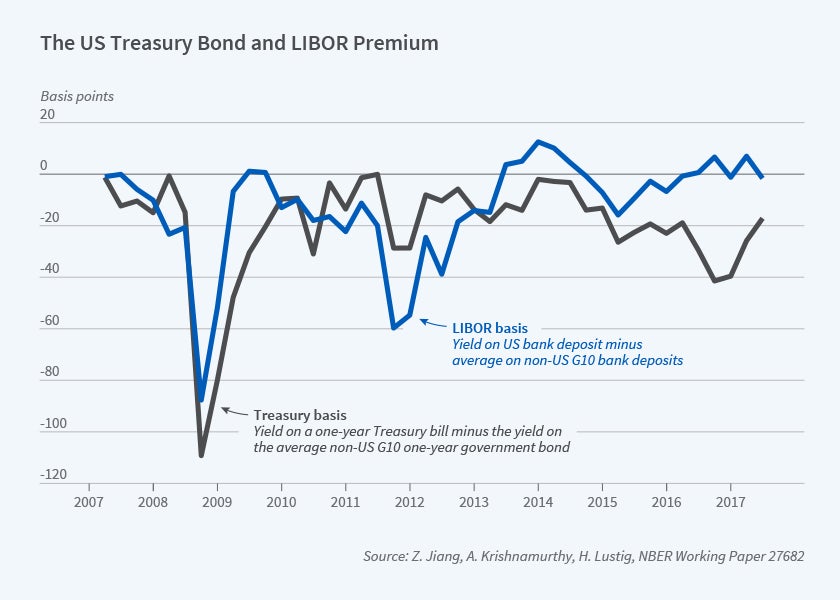
Figure 2 illustrates the premium on dollar bonds compared to the bonds of other countries. It plots in black the Treasury basis, which is defined as the yield on a one-year Treasury bill minus the yield on the average non-US G10 one-year government bond, swapped into dollars via a foreign exchange forward. The black line is negative, indicating the lower yield on US Treasury bonds; hence, the figure is evidence of a higher convenience yield on dollar bonds. Wenxin Du, Joanne Im, and Jesse Schreger are the first to construct and study this basis spread.4 The blue line is the LIBOR basis, constructed analogously but for LIBOR (bank deposit) rates.
Because safe dollar debt carries a convenience yield, high-grade firms and banks domiciled both in the US and around the world finance themselves in dollar-denominated debt. That is, the dominance of dollar debt, which is a well-documented feature of the international financial system, is a direct consequence of the dollar safe asset phenomenon. Moreover, high levels of dollar debt explain why US monetary policy has large international spillover effects and why changes in the dollar exchange rate drive a global financial cycle. Finally, as Pierre-Olivier Gourinchas and Hélène Rey observe, the existence of a dollar convenience yield induces the US as a whole to run a carry trade of issuing safe dollar debt and investing in higher-return foreign assets.5 Jiang, Krishnamurthy, and Hanno Lustig develop a model that connects these observations.6
Why Are US Safe Assets Special?
Working with Konstantin Milbradt, we have developed a model that emphasizes financial coordination incentives in the determination of safe asset status.7 The key idea is that the safety of assets is endogenous to investors’ actions: investors act in a manner to make the asset safe. By having a larger Treasury bond market, liquidity and market depth in Treasury bonds are enhanced, drawing in investors across the globe. This in turn reduces rollover risk for the Treasury, which enhances the safety of the bonds, reinforcing investors’ desire to purchase them. The model endogenously generates the outcome that the value of the safe asset rises in bad states of the world, when investors endogenously fly to safety.
The model also offers a nuanced perspective on the outstanding amount of government debt. Having too little debt reduces liquidity and investor coordination incentives. Having too much debt relative to fiscal capacity, however, renders debt unsafe and weakens coordination incentives. The size of the US economy enables the country to sustain a large absolute amount of liquid debt, which is why investors coordinate around Treasury debt as the world’s safe asset. The model is cast in real terms, and one shortcoming of the analysis is that it does not explain why global investors coordinate on US Treasury debt issued in nominal dollar units.8
The US Treasury Market in 2020: Canary in the Coal Mine?
The large and growing size of US deficits has raised concern that US Treasuries and the US dollar may end their reign at the center of the international financial system. We review events in the 2020 COVID-19 crisis in this context.
The β of Long-Term Treasuries
Treasury bonds typically appreciate in times of turmoil — that is, they have a negative β. However, events in March 2020, during the COVID-19 crisis, did not follow this established pattern. As in many previous periods of financial market turmoil, stock prices fell dramatically, implied stock index return volatility spiked, credit spreads widened, and the dollar appreciated. Yet, in contrast to previous episodes, prices of long-term Treasury securities fell sharply. From March 9 to March 18, when the US stock market fell 19.3 percent, the 10-year Treasury yield increased by about 60 basis points (a return of -4.9 percent), resulting in an unusual positive correlation between stock and bond returns (see the left panel of Figure 3). The pattern of rising yields also held for five-year Treasury notes. He, Stefan Nagel, and Zhaogang Song find that this behavior was not due to rising inflation expectations and inflation uncertainty, which fell during this episode.9
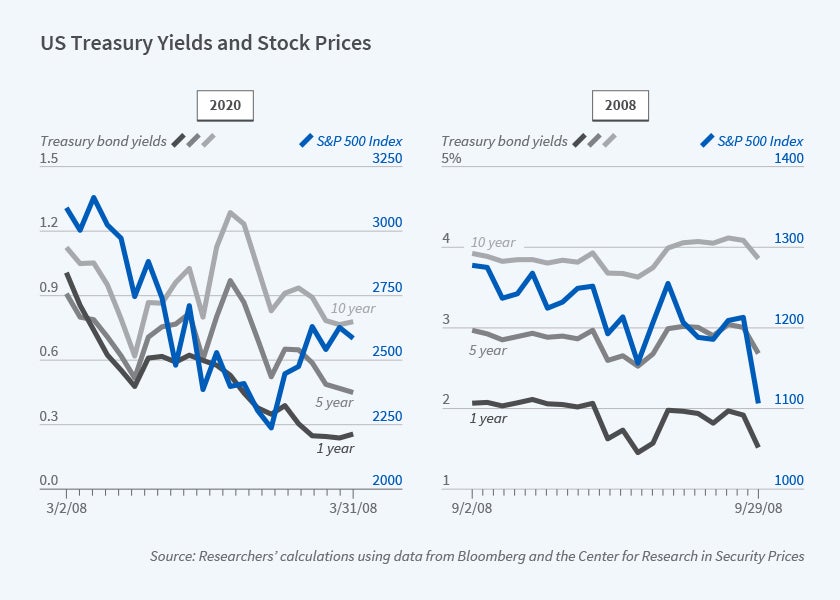
The positive β of long-term Treasuries during March 2020 is particularly striking when contrasted with what occurred during the global financial crisis of 2007–09. The right panel of Figure 3 plots the daily market movement of the S&P 500 and yields of Treasury securities in September 2008, covering the Lehman bankruptcy on September 15. Treasury yields fall (prices rise) when the stock market falls.
It is worth highlighting that the contrast in price movements between 2020 and 2008 is only present in long-term Treasury securities. Figure 3 shows that the yield of one-year Treasury bills has remained largely flat in 2020. However, yields at the short end are affected by the Fed’s monetary policy easing. We next examine quantities where a clearer contrast between long- and short-term Treasuries emerges.
Sales of Treasuries
We plot the changes in Treasury holdings of a number of the key actors, comparing March 2020 and September 2008. Figure 4 shows the flows for three major institutional players in the Treasury market: foreign investors, mutual funds, and the Fed. We focus on foreign investors and mutual funds because they are liquidity sensitive holders. We separate the long-term treasuries (notes and bonds) and short-term securities (T-bills), and graph the flows for each player as a percentage of the corresponding total outstanding Treasuries in each bucket. In Figure 4, we report the dollar volume (in billions) corresponding to each bar. We only plot the flows in September 2008 for an analogous comparison to March 2020, although the flows were spread out over the second half of 2008 for all entities.
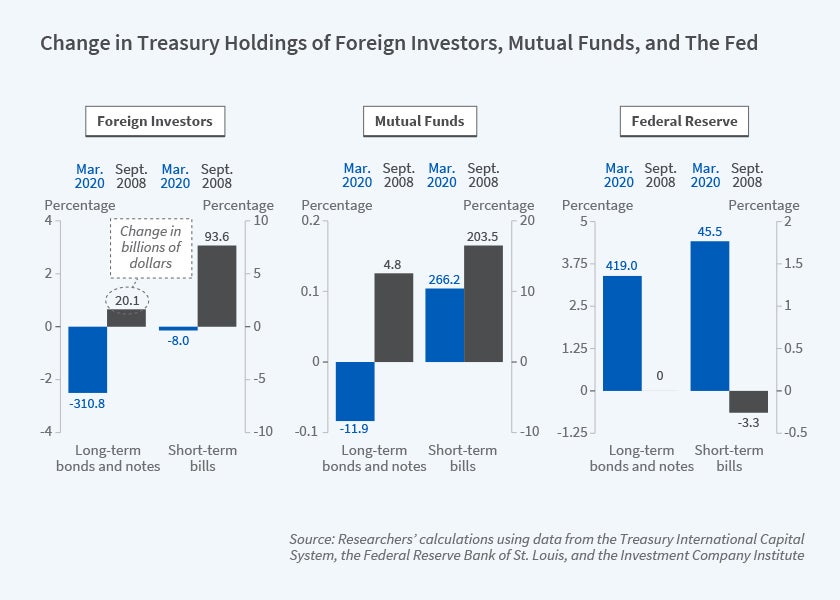
For long-term Treasuries in 2020, we observe that foreign investors, including foreign central banks and investors in tax havens, sold about 2.5 percent, or US $311 billion (the negative blue bar in the top-left of Figure 4). In comparison, they bought about 0.7 percent, or US $20 billion in September 2008. Mutual funds acted similarly, selling in 2020 but buying in 2008. In the COVID-19 crisis, the Fed stepped in to buy 3.4 percent of outstanding long-term Treasuries, or US $419 billion, starting on March 15. In sharp contrast, the Fed supplied about $200 billion worth of long-term Treasuries during the period from March 2008 to June 2009 by allowing dealers to obtain Treasuries against non-Treasury collateral in the Term Securities Lending Facility.10
Next, consider the quantity movement of short-term T-bills in March 2020. Mutual funds purchased a massive amount of short-term Treasuries, totaling 10.4 percent of the outstanding stock, or $266 billion. Foreign investors were net sellers, although the amount was negligible. Note that foreign central banks were likely to have acquired dollars via the Fed’s swap lines, which were expanded temporarily on March 19 to include some central banks in emerging markets. We conclude that unlike the case of long-term Treasuries where liquidity-sensitive investors sold in 2020, investors sought the safe haven of short-term Treasuries in both 2020 and 2008.
Are Treasuries and the Dollar Losing Safe-Haven Status?
Relative to short-term T-bills, whose values are largely determined by the near-term promise to repay by the US government, the market prices of long-term Treasuries are endogenous. They are subject to coordination incentives of market participants and expectation of future fundamentals.11 The positive β of long-term Treasuries thus raises the prospect that investors questioned the safe-haven status of these bonds.
Furthermore, although the dollar did appreciate in March 2020, which indicates a flight to safety and is consistent with past episodes of market turbulence, the degree of appreciation in the dollar against other currencies is much smaller than that in 2008. From the perspective of safe-haven assets, this observation is at odds with the fact that the 2020 global macroeconomic shock due to the ongoing COVID-19 pandemic appears as severe as the financial crisis shock in 2008. Moreover, the dollar has depreciated since March 2020, alongside weakening US economic fundamentals and a rising fiscal deficit.
There are alternative perspectives on the Treasury market behavior. Darrell Duffie, and in another report Andreas Schrimpf, Hyun Song Shin, and Vladyslav Sushko, argue that the price behavior of long-term Treasury bonds in March 2020 reflects long-standing flaws in clearing/settlement market design for Treasury bonds, amplified by constraints on dealer balance sheets.12 Dealers who in previous episodes may have absorbed these flows did not do so because of regulatory balance sheet constraints.13 As a result, long-term Treasury prices fell in March 2020. The Fed’s announcements of the purchase of long-term Treasury bonds and subsequent purchases were critical in restoring market function. Indeed, as of September 2020, the long-term Treasury market has normalized. Yields have fallen and the negative β pattern for long-term Treasury bonds has been restored. Whether the events of March 2020 were a technical aberration or the proverbial canary in the coal mine of international investors shifting toward a nondollar equilibrium remains an open and consequential question.
Endnotes
“The Aggregate Demand for Treasury Debt,” Krishnamurthy A, Vissing-Jorgensen A. Journal of Political Economy 120(2), April 2012, pp. 233–267; “The Impact of Treasury Supply on Financial Sector Lending and Stability,” Krishnamurthy A, Vissing-Jorgensen A. Journal of Financial Economics 118(3), December 2015, pp. 571–600.
“The History and Economics of Safe Assets,” Gorton G. Annual Review of Economics 9, 2017, pp. 547–586.
“Safety, Liquidity, and the Natural Rate of Interest,” Del Negro M, Giannone D, Giannoni M, Tambalotti A. Brookings Papers on Economic Activity, Spring 2017, pp. 235–316.
“The US Treasury Premium,” Du W, Im J, Schreger J. NBER Working Paper 23759, August 2017, and Journal of International Economics 112, May 2018, pp. 167–181.
“International Financial Adjustment,” Gourinchas P, Rey H. Journal of Political Economy 115(4), August 2007, pp. 665–703.
“Dollar Safety and the Global Financial Cycle,” Jiang Z, Krishnamurthy A, Lustig H. NBER Working Paper 27682, August 2020.
“A Model of Safe Asset Determination,” He Z, Krishnamurthy A, Milbradt K. NBER Working Paper 22271, May 2016, and American Economic Review 109(4), April 2019, pp. 1230–1262.
“Banking, Trade, and the Making of a Dominant Currency,” Gopinath G, Stein J. NBER Working Paper 24485, April 2018, and “The International Medium, of Exchange,” Chahrour R, Valchev R. March 2020, offer models that pin down this denomination based on firms’ pricing decisions. There is a complementarity between firms’ decisions to denominate their exports in a given unit of account and bond issuers’ decisions to denominate in that same unit of account.
“Treasury Inconvenience Yields during the COVID-19 Crisis,” He Z, Nagel S, Song Z. NBER Working Paper 27416, June 2020.
“Repo Market Effects of the Term Securities Lending Facility,” Fleming M, Hrung W, Keane F. Federal Reserve Bank of New York Staff Reports, No. 426,January 2010.
“A Model of Safe Asset Determination,” He Z, Krishnamurthy A, Milibradt K, American Economic Review, vol 109(4), pages 1230– 1262; “Beauty Contests and Iterated Expectations in Asset Markets,” Allen F, Morris S, Shin HS. The Review of Financial Studies 19(3), Fall 2006, pp. 719–752.
“Still the World’s Safe Haven? Redesigning the US Treasury Market After the COVID-19 Crisis,” Duffie D. Hutchins Center Working Paper 62, Brookings Institution, May 2020; “Leverage and Margin Spirals in Fixed Income Markets During the Covid-19 Crisis,” Schrimpf A, Shin HS, Sushko V. BIS Bulletin 2, April 2020.
“Treasury Inconvenience Yields during the COVID-19 Crisis,” He Z, Nagel S, Song Z. NBER Working Paper 27416, June 2020.


