Program Report: Economics of Education
The NBER Economics of Education Program covers topics related to education in a manner that is deeply informed by economic logic and empirical methods. The program draws upon theory from several fields including public, labor, development, and urban economics, as well as industrial organization. The program has 179 members and meets three times a year in Cambridge, Chicago, Stanford, and Washington. The average meeting attracts about 100 submissions for a program of about 10 papers. The program has a culture that combines rigor, constructive advice, and noteworthy collegiality.
Top North American universities are very well represented, but the Economics of Education draws participants from many states, countries, universities, and organizations. While the papers often analyze high-income countries’ policies, most of the issues are fairly universal. Thus, it should come as no surprise that about two-fifths of the papers focus on policies in low- and middle-income countries. For instance, recent conferences have featured studies of Gambia,1 Ghana,2 Colombia,3 and Brazil.4
Economics of Education participants eagerly take up new topics and methods. Researchers very often employ administrative data that are comprehensive, massive, and accurate. An example would be student financial aid data that are linked to academic and labor market performance. Such data let us apply the latest econometric methods as soon as they become available. Cutting-edge methods make for exciting meetings and, crucially, allow us to differentiate between correlation and causation.
Program participants nearly always have close connections with policymakers as well as researchers in non-profit and for-profit institutions. These connections ensure substantial attention to questions on the “policy table.”
Since my last report, the Economics of Education Program has issued more than 850 working papers and hosted additional scores of conference papers.5 Therefore, I cannot possibly describe them all. When last I reported, I focused on productivity in education, teacher value-added, and student loans. Though I will not discuss these topics in this report, they continue to attract substantial research interest. My last report also forecast that technology and university majors would be increasingly important topics. This turned out to be the case, and I discuss both of those topics in this report. I am often asked how artificial intelligence (AI) is changing education, and it is early days for an answer. Nevertheless, I will speculate, based on what the latest research shows, toward the end of this report.
How Data Science Is Changing the Study of the Economics of Education
Machine learning, natural language processing, deep learning, and other data science tools are rapidly changing how we conduct research in the economics of education. These tools can provide us with techniques and measurements that allow us to answer time-honored, fundamental questions that were intractable previously. In the process, new questions inevitably arise.
For instance, Bruhn, Gilraine, Ludwig, and Mullainathan show that there is vastly more information in test scores than is typically used.6 This is because individual questions are usually aggregated into a single score that educators, parents, and researchers see. Ex ante, it is not obvious that the aggregate score destroys much information, but, in fact, it does. The authors use Texas data on 5 million students and 1.31 billion student-item responses to show that much valuable data is effectively thrown away. By valuable they mean data that is highly relevant for student outcomes and educational decisions.
The evidence for findings along these lines is strong. Nielsen shows that individual test items have different implications for outcomes such as school completion and labor market earnings.7 For instance, individual test items can fully explain Black/White earnings differences, whereas aggregate scores do not come close to doing so.
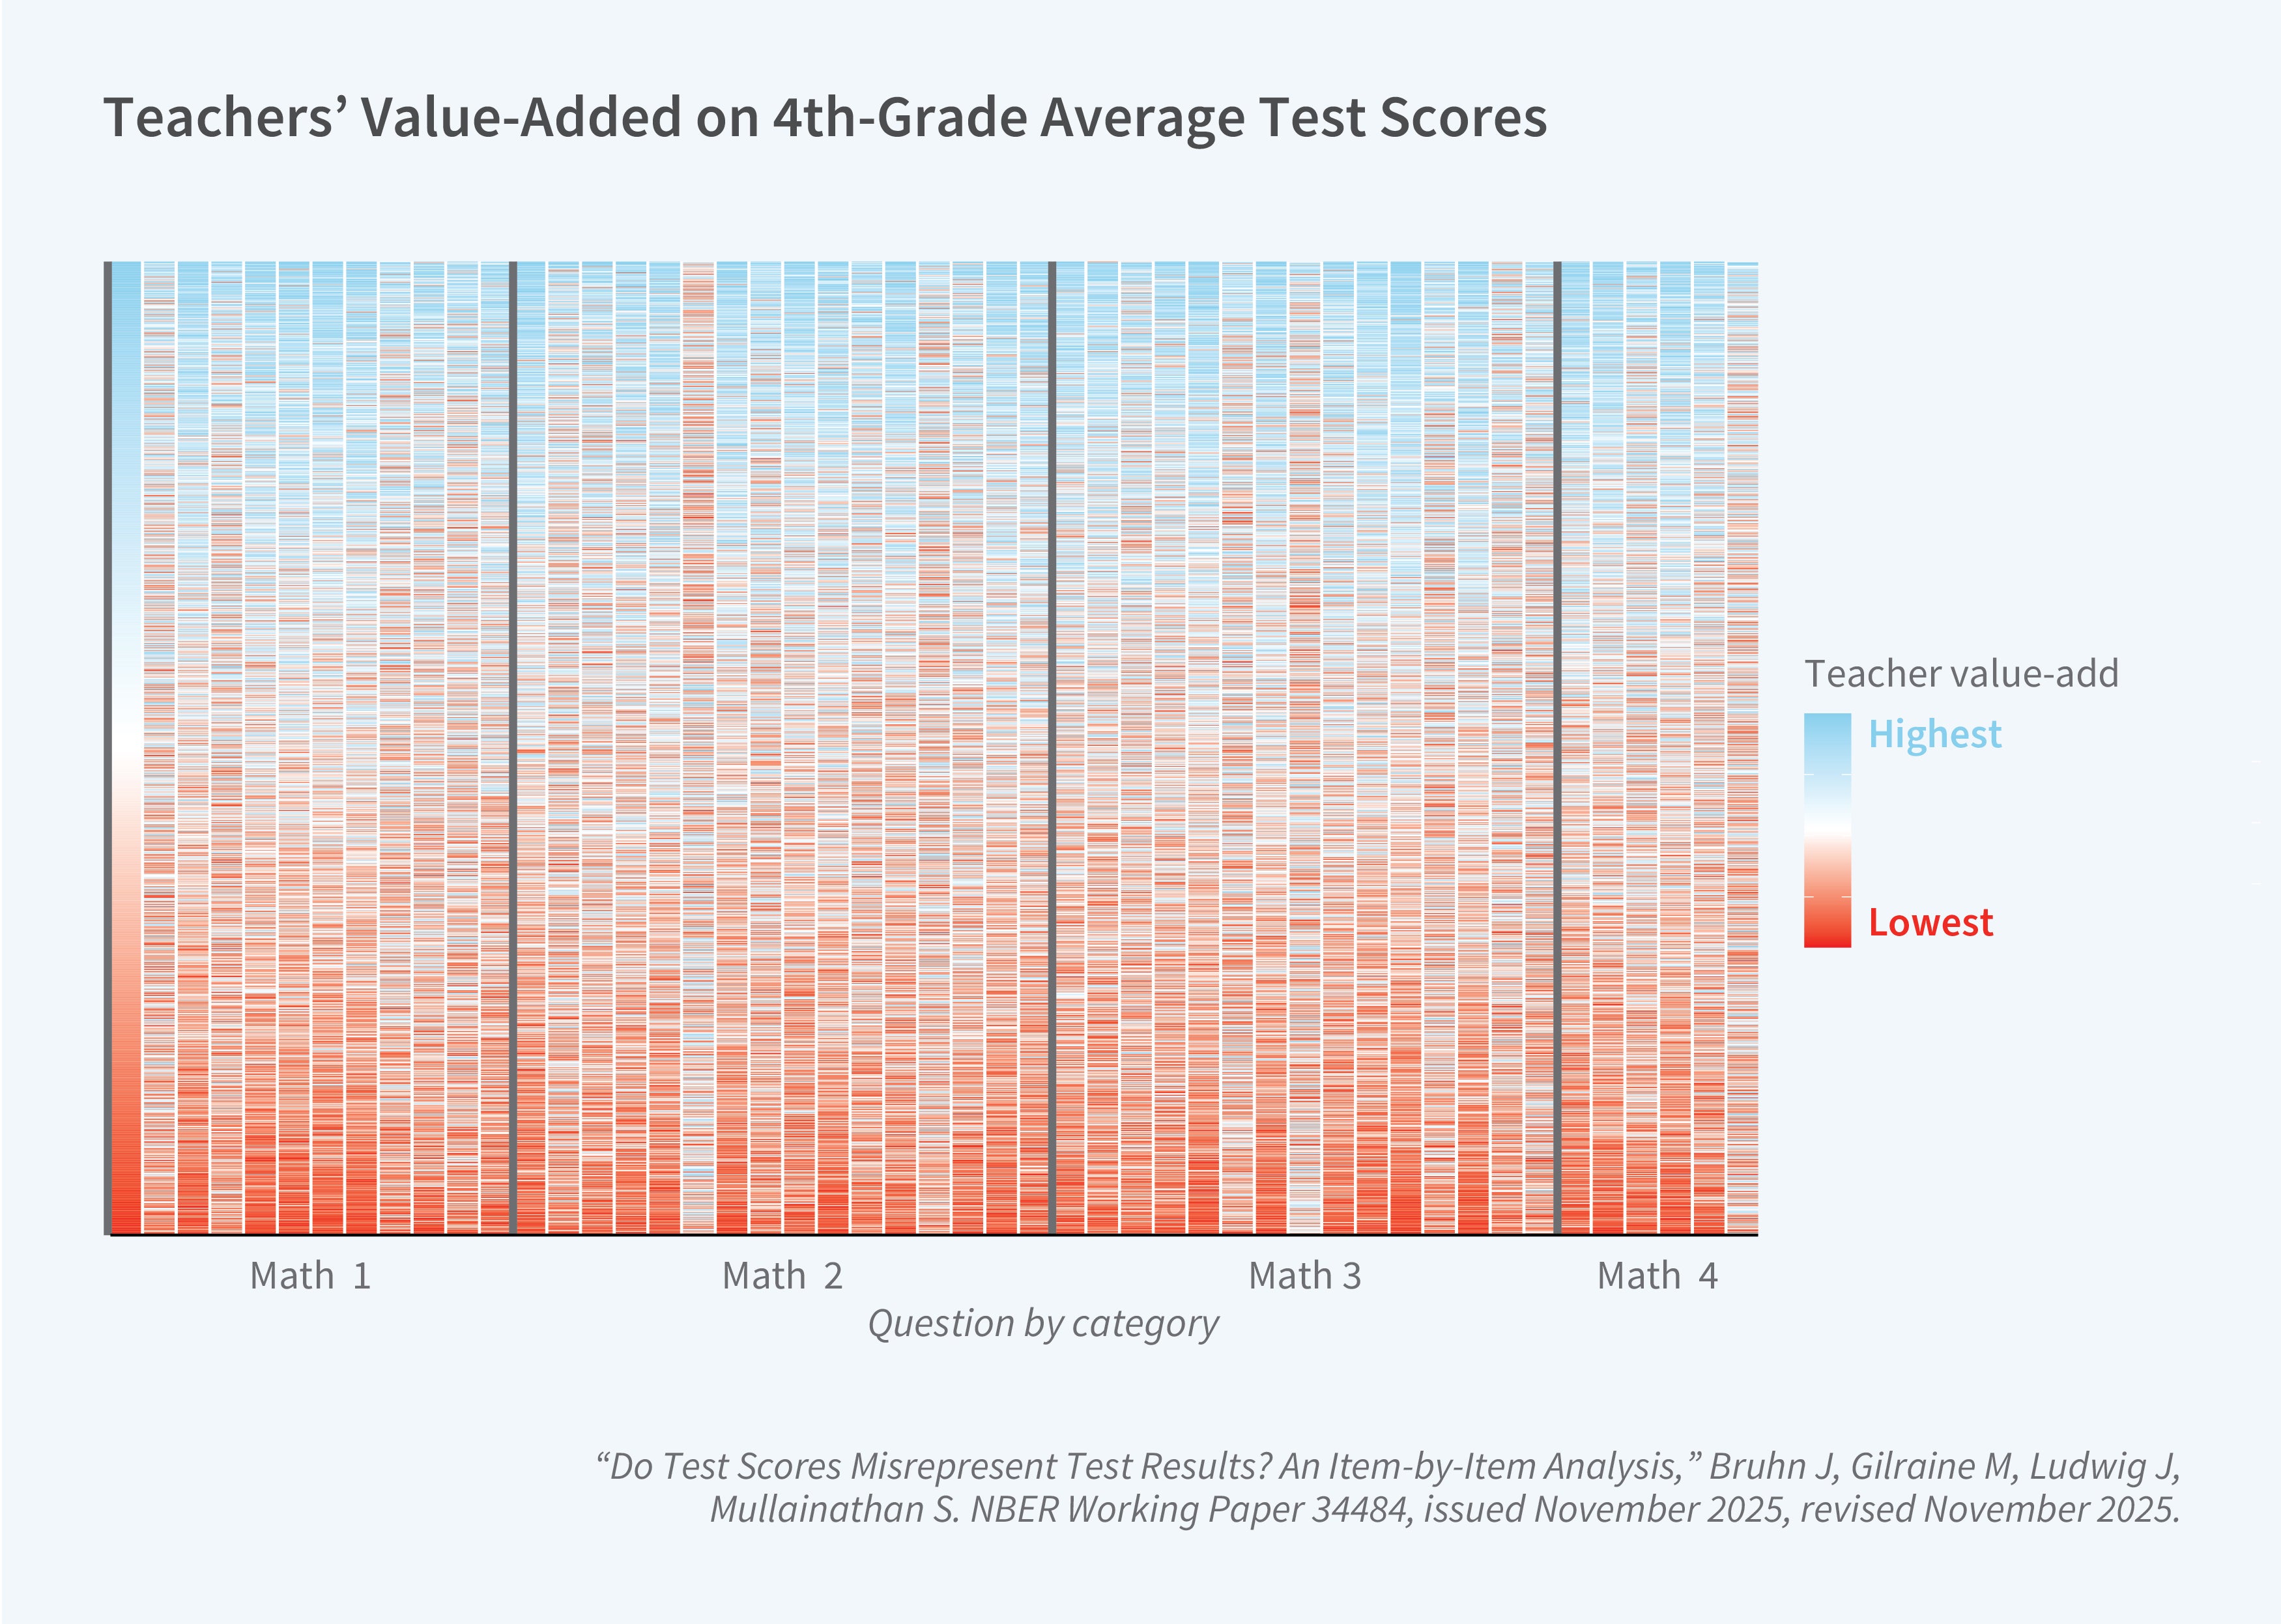
Similarly, using administrative data from Maryland, Conrad, Pope, and Zuo demonstrate that subscores reveal substantial heterogeneity in skill and earnings premiums that aggregate scores mask.8 Additional supporting evidence is offered by Moreno-Medina, Nielsen, and Rodriguez.9 They digitize content for 3,500 individual test items and 1 billion student-item records linked to Texas administrative data. They show wide variation in individual items’ predictive power for earnings and other later outcomes. To interpret these differences, the authors use machine learning and AI to analyze why individual items have the explanatory power that they do.
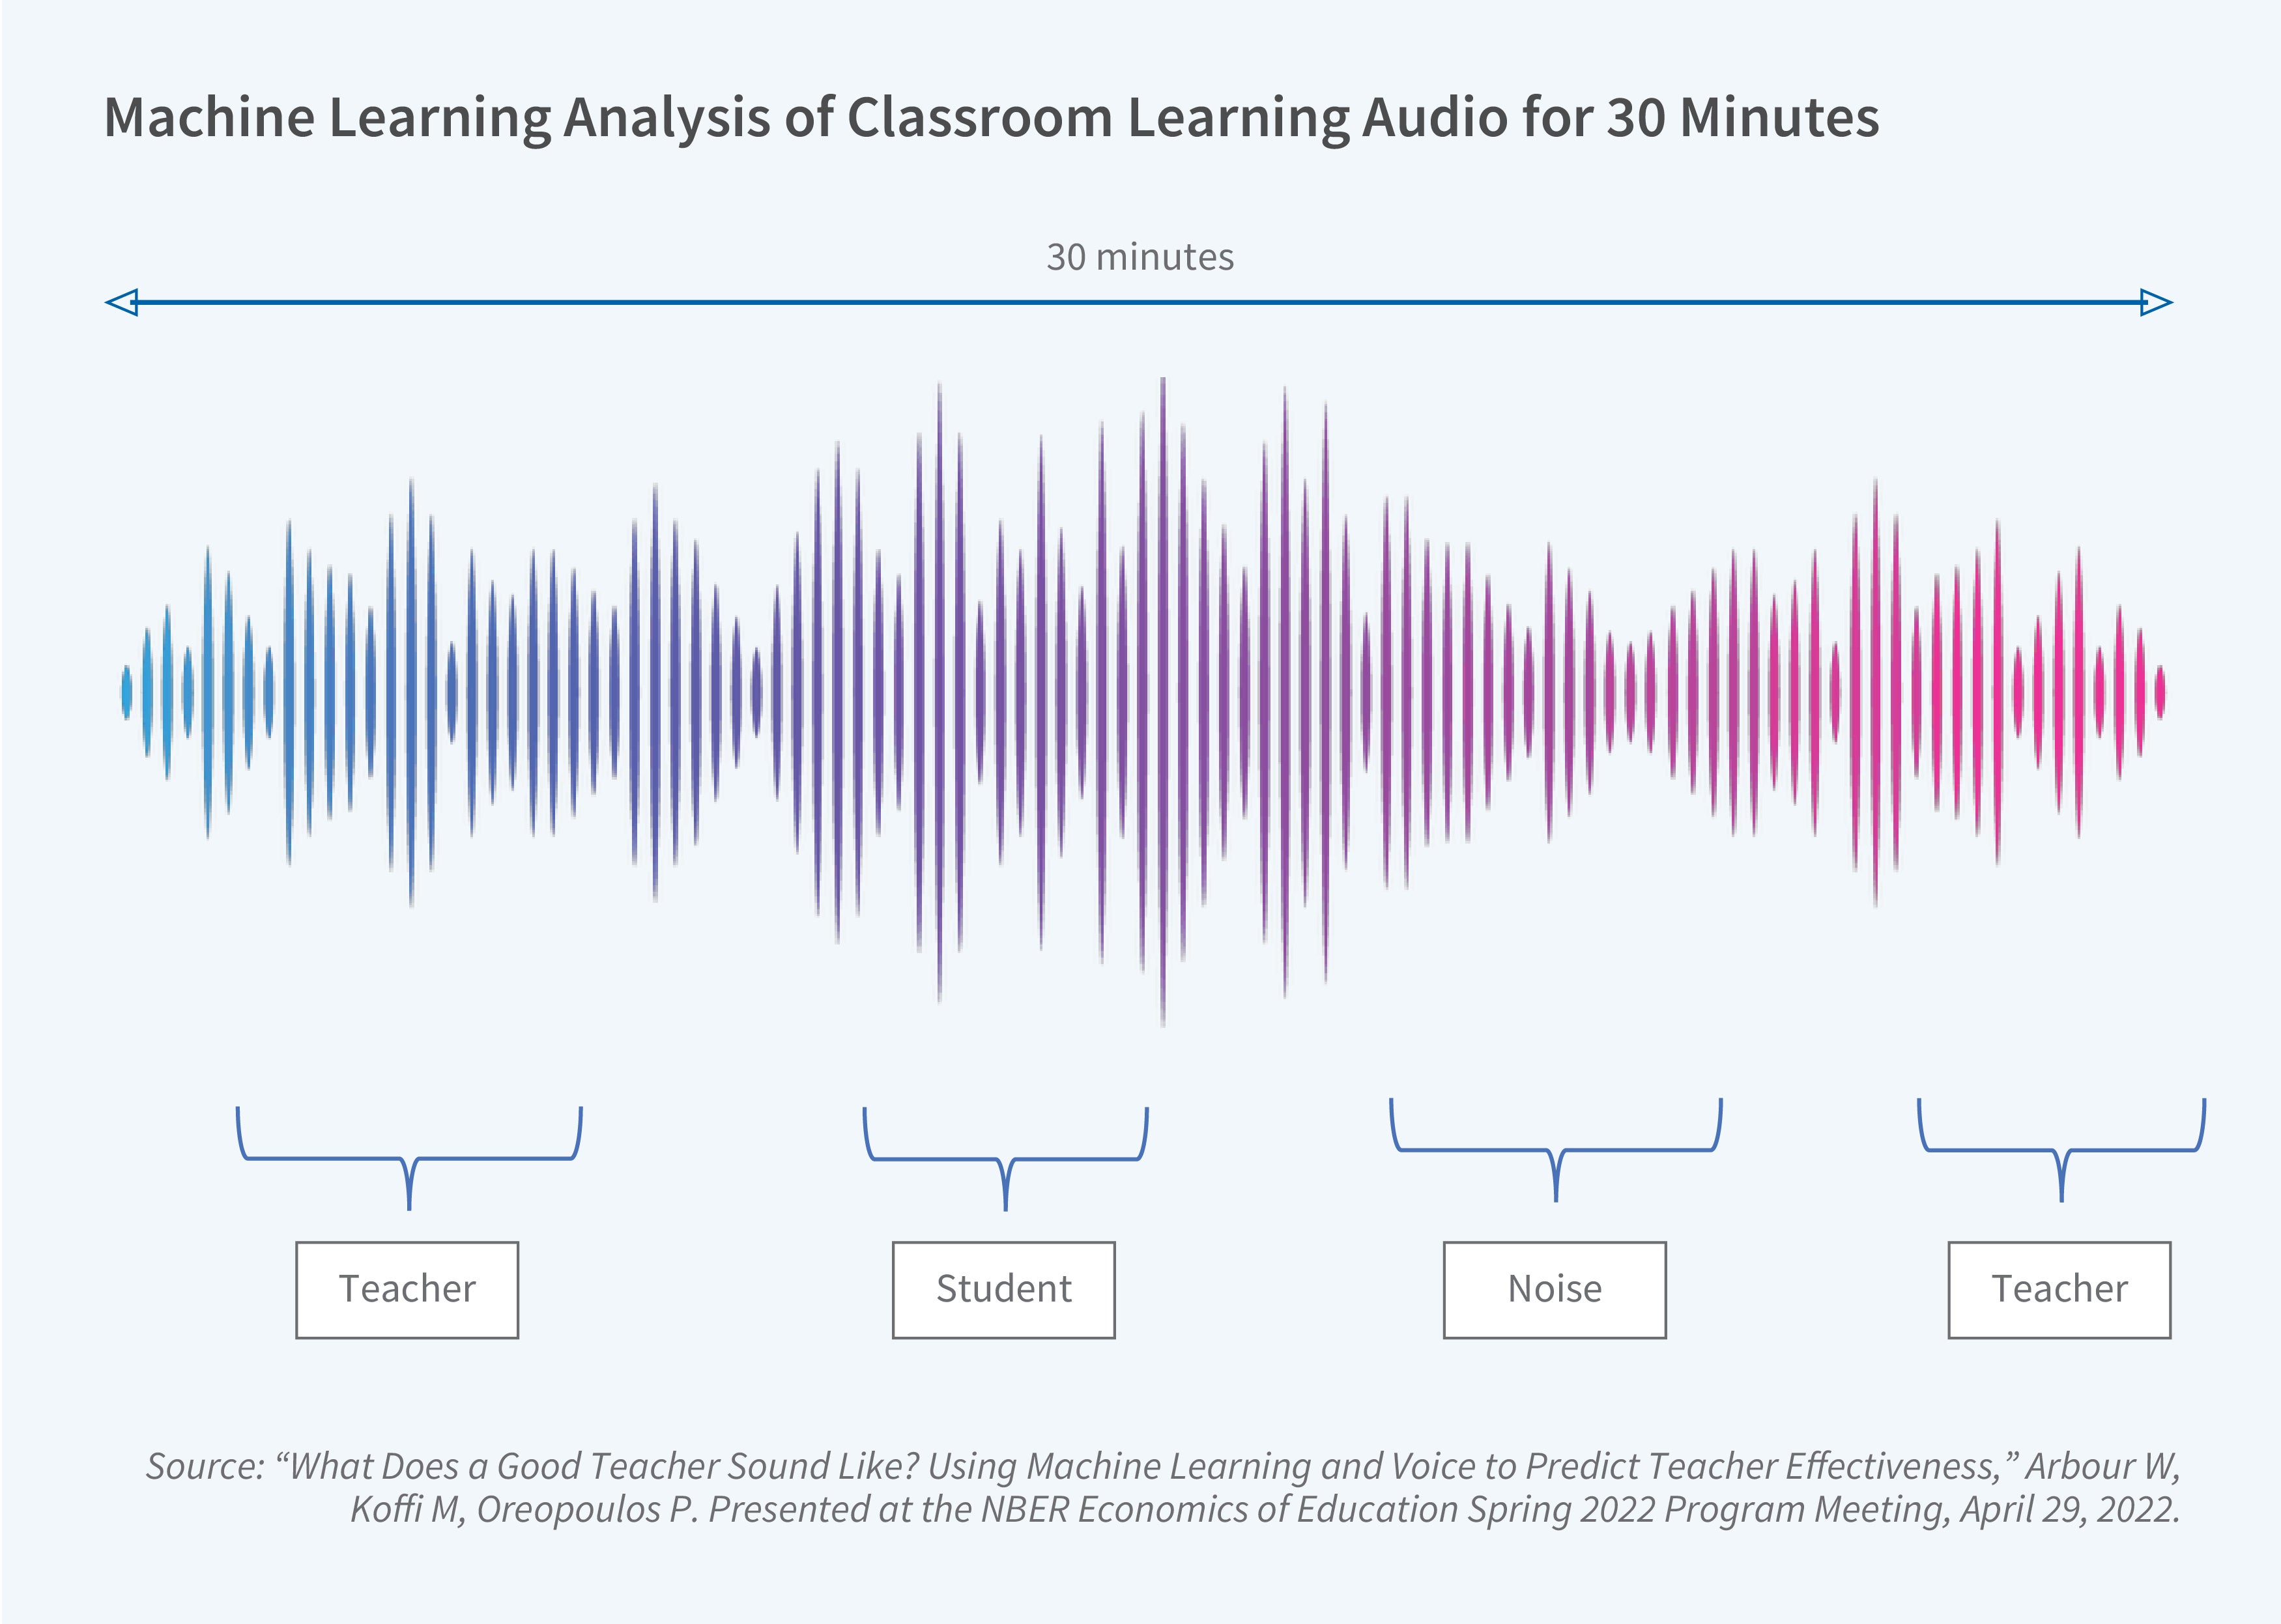
Arbour, Koffi, and Oreopoulos use machine learning to analyze the audio in thousands of 30-minute classroom videos.10 They identify the sounds coming from the teacher, the students, and noise. Figure 2 illustrates how they do this. The audio not only reveals how much of the time is occupied by the teacher’s speech but the teacher’s vocal pitch, brightness, smoothness, and 27 other vocal measures. Remarkably, the authors show that machine learning can predict a teacher’s value-added, using audio alone (without word recognition), as well as or better than highly trained classroom observers. This result matters because predicting teachers’ value-added is important to get right in education, but employing highly trained observers is prohibitively expensive.
Shaikh uses rich data on 3,700 undergraduates in an online programming course, precisely tracking their study time.11 His field experiment induces period-by-period exogenous variation in students’ study effort. He shows that weighting the course grade toward early assignments, rather than equal weights or later assignments, encourages more effective effort. Specifically, early weights mitigate procrastination by boosting effort when foundational skills are being acquired. These foundational skills then allow the students to benefit more from later assignments. Shaikh’s research may cause dramatic changes in how instructors structure their courses. His presentation drew rapt attention from the many professors in the room.
Aucejo, Perry, and Zafar use detailed work and study effort data from a partnership between Arizona State University and Uber to analyze how labor supply and study effort respond to changes in labor market conditions and college tasks.12 They find that a 10 percent increase in study effort reduces weekly time spent on the Uber platform by only 1 percent, indicating that the opportunity cost of studying can be very low with a flexible work schedule. The authors also show that study time is fairly insensitive to labor market conditions: A 10 percent increase in weekly pay rates reduces study hours by only 2 percent.
Biasi and Ma apply natural language processing to the text of 1.7 million university course syllabi and 20 million academic articles to construct the “education-innovation gap,” a measure of a syllabus’s distance from frontier knowledge.13 They show that students at more selective universities learn more frontier knowledge and that, even within a university, research-active instructors teach more frontier knowledge. The authors use a credibly causal empirical strategy that relies on instructor turnover to demonstrate that students who experience more frontier knowledge complete more doctoral degrees, produce more patents, and earn more.
Technology Use in Education
So far, I have discussed how technology is changing how researchers analyze the economics of education. Obvious follow-up questions are how technology is changing what students learn, how they learn, and how productive schools are. Increasingly, the evidence suggests that there are different answers to this question depending on the nature of the technology and how it is used. This is where economics is so helpful. If we look at the economic logic behind different technologies, we may be able to predict which technologies are going to improve education and which are not. It is this economic reasoning that makes technology so exciting.
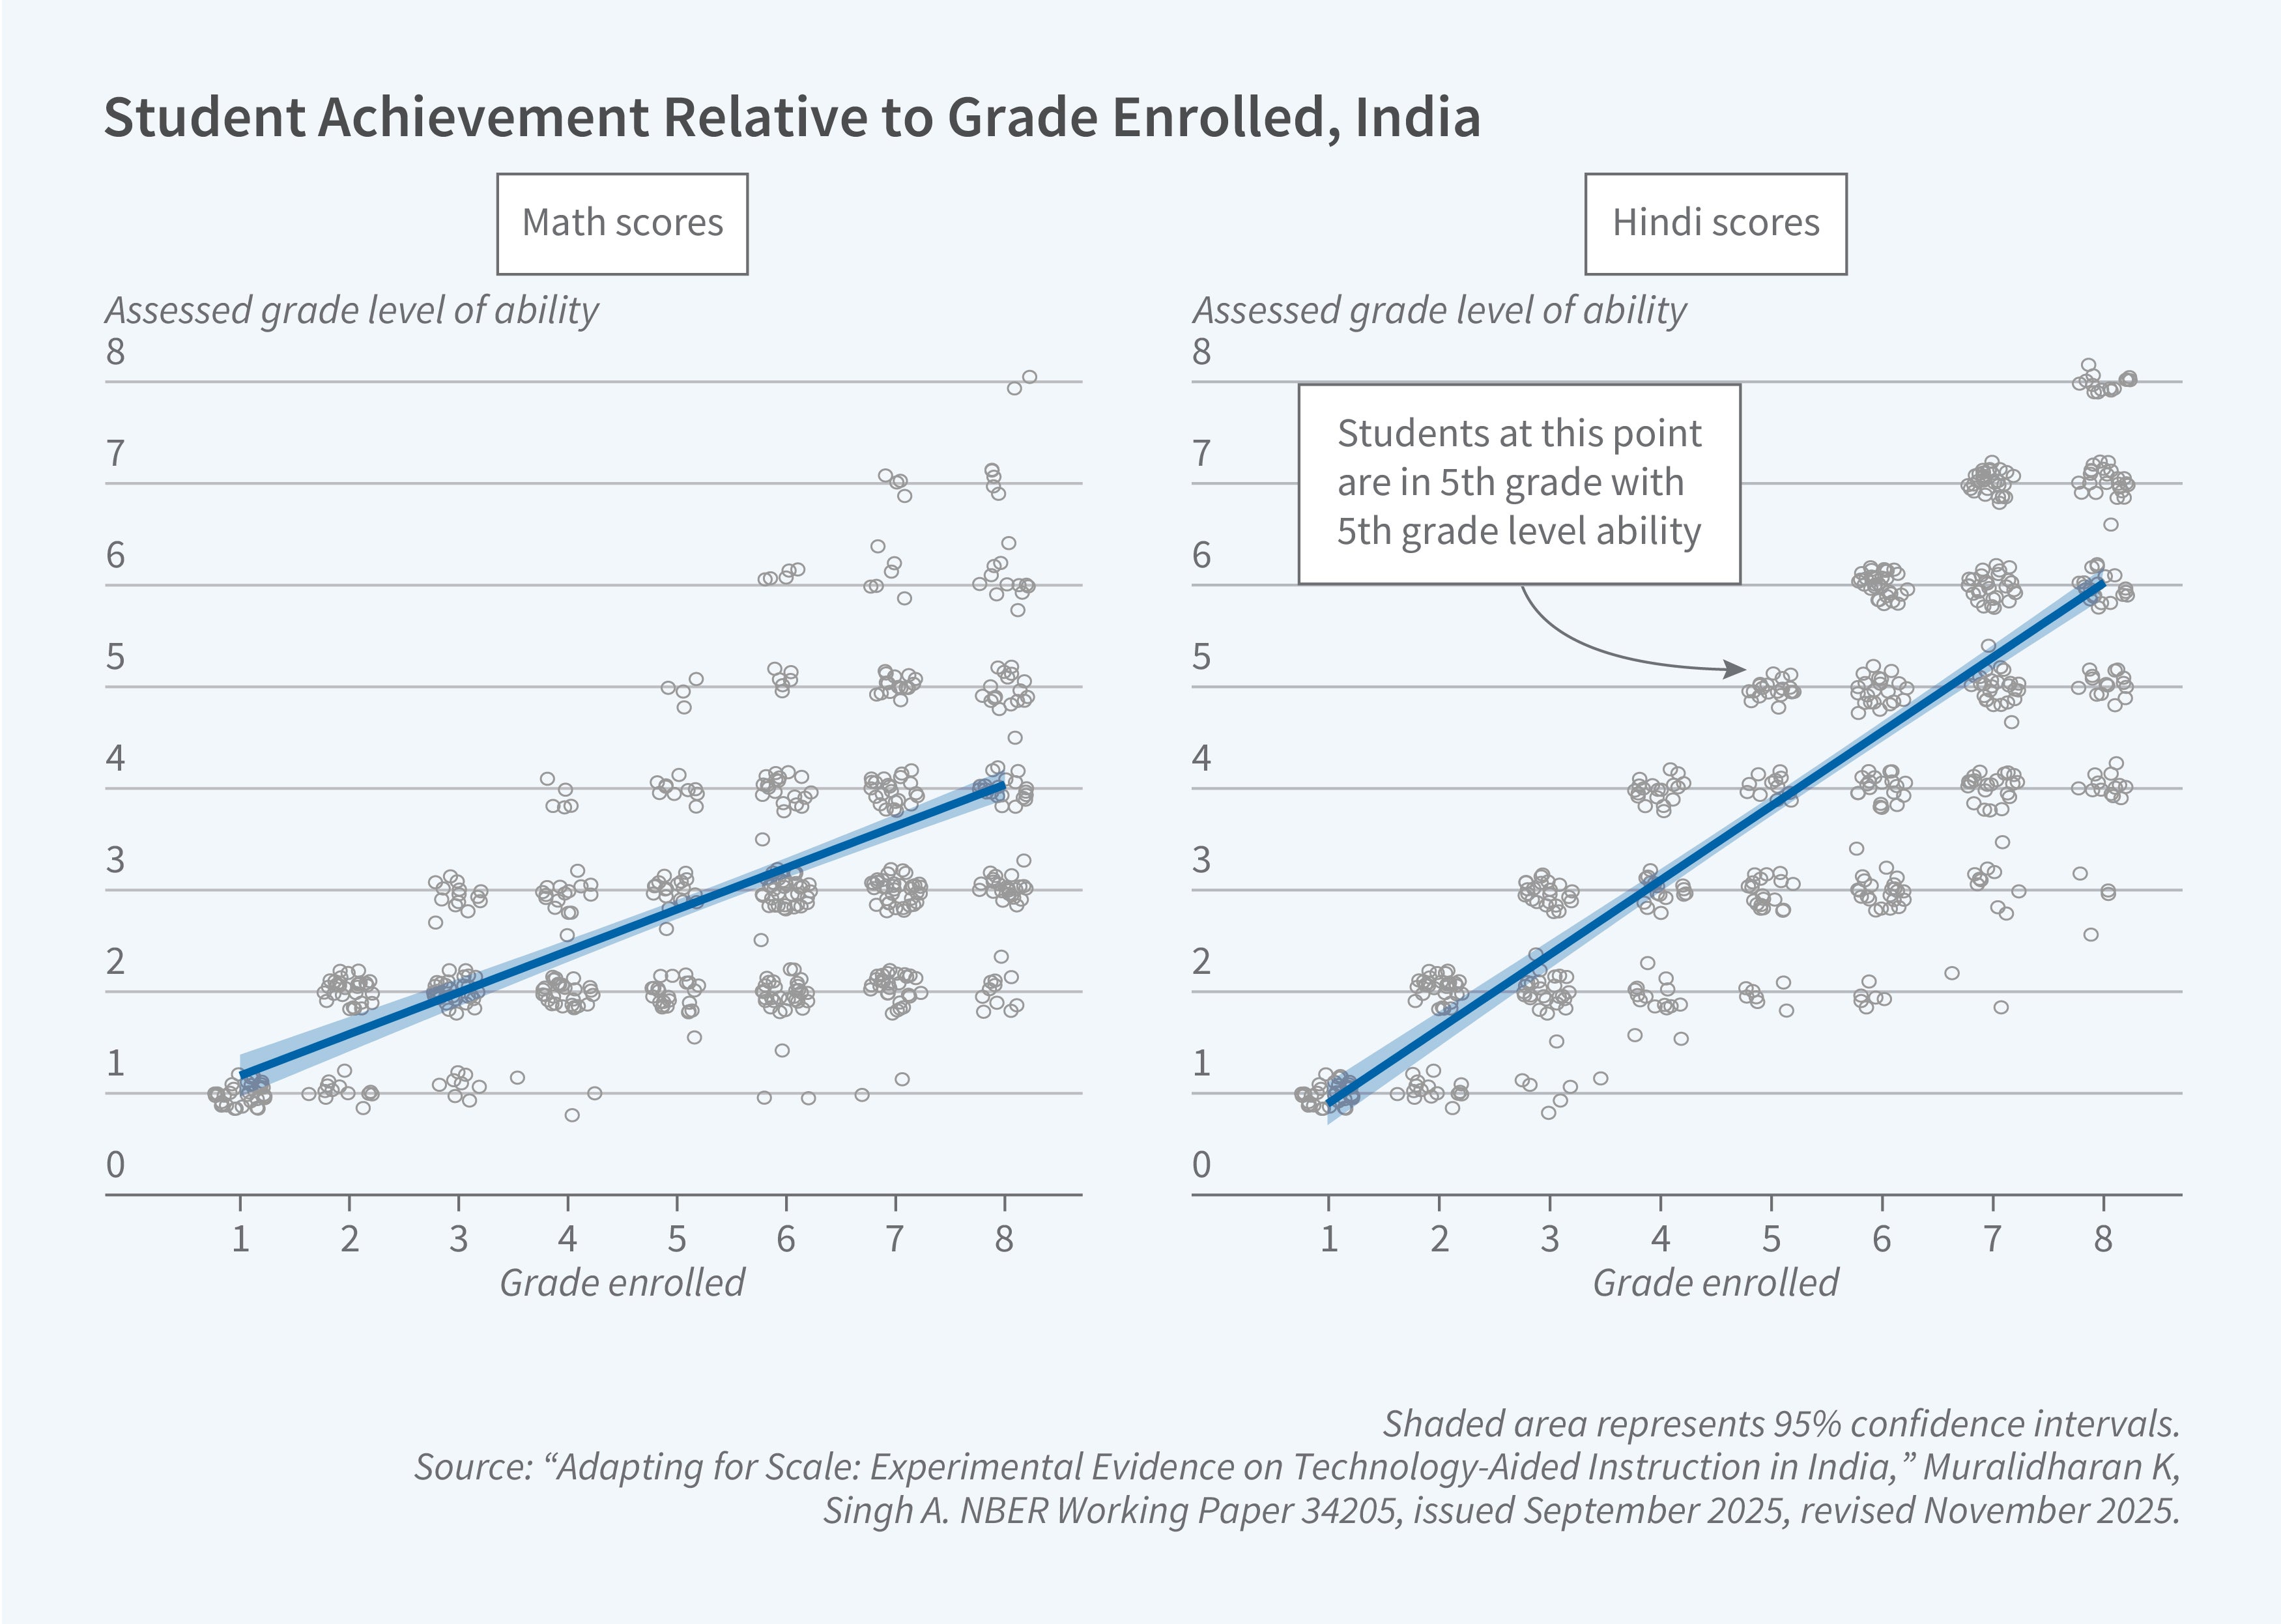
Personalized adaptive learning (PAL) and computer-assisted learning (CAL), while not exactly the same, share the same “endogenous learning” logic. The logic is that students who do not learn basic material benefit much less when presented with advanced material. For instance, students who are still confused about addition may benefit very little from lessons about fractions. Students who struggle with basic reading comprehension may benefit very little from lessons on essay writing. Moreover, as students age, they increasingly diverge in terms of what they have already learned. While first grade material is appropriate for most first graders, a classroom of seventh graders may contain a few students who need first grade material, some who need third grade material, and others who need seventh grade material. Figure 3, from Muralidharan and Singh, shows this fact.14 While the figure is based on India, the finding is fairly universal.
What PAL and CAL attempt to do is diagnose each child’s current skills and customize the curriculum with which the child engages. The goal is to ensure that students demonstrate proficiency with a topic before moving on. Can PAL or CAL software achieve this goal? This would require that students work with computers, rather than attend class-wide lectures.
Muralidharan and Singh conduct a randomized controlled trial with 250,000 students in an Indian state that integrated PAL software into normal public school schedules with existing teachers and modest computer labs that had to be shared among all classes. While the software they test was successful in small-scale trials, such trials often impose conditions that preclude rolling out the software everywhere. A small trial may rely on students who can stay after school or specially trained (and, therefore, expensive) teachers. Muralidharan and Singh’s fully scaled-up experiment shows that students who used PAL scored about 0.2 standard deviations higher in math and language arts. This represents an impressive 50 to 66 percent productivity increase.
Oreopoulos, Gibbs, Jensen, and Price study two field experiments (in Nashville, Tennessee, and Arlington, Texas) in which primary and middle school math teachers are coached to integrate CAL into normal school days.15 The authors show that the coaching improves math performance by 0.12 to 0.22 standard deviations. This is despite the coaching inducing only limited integration. For instance, most students master fewer than half of the prescribed CAL activities before moving on to the next topic.
Bhatt, Guryan, Khan, LaForest-Tucker, and Mishra also analyze CAL, but as a substitute for high-dosage tutoring rather than as part of normal lessons.16 While credible research has shown that high-dosage tutoring can improve achievement, such tutoring is often impossible to scale owing to its high costs and dependence on volunteers, such as tutors drawn from local universities. The authors’ randomized controlled trial doubles the number of students who receive help by rotating students between CAL and in-person tutoring. In Chicago and New York City high schools, the authors show that CAL substitution, rotated in this manner, reduces costs by 30 percent, gets more students into tutoring, and generates the same improvements as high-dosage tutoring.
“One Laptop per Child” (OLPC) programs are some of the most ambitious attempts to integrate technology into education. Rolled out in 40 low- and middle-income countries, OLPC programs provide a laptop to each student, most of whom would otherwise have no access to any device such as a laptop, tablet, or smartphone. OLPC programs also provide technical support and train teachers to integrate laptops into their lessons. These programs are costly. Moreover, the economic logic behind them is not terribly clear. A student can do many things with a laptop—not just instructional activities, but play games, stream video, and use social media. Just as the rollout of television had an ex ante ambiguous predicted effect on learning, so might laptops.
Cueto, Beuermann, Cristia, Malamud, and Pardo conduct a randomized controlled trial of Peru’s OLPC program over 10 years.17 They show that students do use the laptops and develop familiarity with the technology. However, the authors find no significant effects on academic performance, school completion, or university enrollment. Its long-term nature, accurate data, and rigorous empirical strategy make this study stand out among others on laptop provision.
At present, there is worldwide debate about smartphones. On the one hand, they can be used for instruction, and they are cheap and easy to network. However, policymakers are worried that smartphones distract students, encourage bullying, or hamper social development by suppressing in-person interactions. These worries explain why several countries and numerous North American school districts have enacted smartphone restrictions. The restrictions have usually been triggered by anecdotes. Little actual evidence is available about which restrictions have their intended effects. Fortunately, there are several recent and credible studies on the question.
Allcott, Baron, Dee, Duckworth, Gentzkow, and Jacob evaluate US schools that have restricted smartphone use during the school day by insisting that they be placed in lockable pouches.18 They use GPS pings to verify changes in actual use. Because the schools that adopt pouches are self-selected, the authors use a stacked difference-in-differences design to address biases. The authors find that in the first year after adoption, disciplinary incidents increase. However, the disciplinary effect fades later. For academic achievement, school attendance, self-reported class attention, and online bullying, the authors report effects that are close to zero or statistically insignificant.
Figlio and Özek study Florida’s 2023 smartphone ban in schools.19 Because the ban was statewide, there are no true control schools. Therefore, the authors compare schools where there was a larger pre-ban difference in cellphone use between regular school days and teacher in-service days (high-effect schools) and those with a smaller pre-ban difference in cellphone use (low-effect schools). The results show that the cellphone ban increased disciplinary incidents, but that these effects began to dissipate after the first year. The authors find statistically significant improvements in test scores in the second year of the ban. The effects come exclusively from middle and high schools, though the ban applied to primary schools, too.
Aksoy, Lusher, and Carrell evaluate an app designed to keep university students off their smartphones while in class.20 They conduct an experiment at Texas A&M University where randomly selected students are encouraged to use Pocket Points, which rewards students with points if they lock their phones when in class (verified by GPS). The points can be used at participating businesses. The authors show that use of this app does reduce smartphone use and that the reduction caused students to self-report increased classroom focus, attendance, and academic satisfaction. However, the effects on transcript grades are statistically insignificant.
College Majors
With good reason, students have long wanted to know how their choice of a college major would affect their earnings and other life outcomes. Despite assertions commonly splashed in the media, major-specific returns are largely unknown and currently unknowable for the US. This is because self-selection into majors is severe and incredibly difficult to address with empirical strategies that could produce plausibly causal results.
In contrast, it is possible to obtain plausibly causal evidence on the effect of program field selection for the many countries where a student must be admitted into a specific field based on a sharply enforced test score cutoff. However, evidence from such cutoff-based studies is not relevant for Americans who choose majors only after being admitted to a university, frequently switch majors, rarely face cutoffs for declaring a major, and face different labor market institutions.
Should rigorous economists therefore give up on learning about US majors? The answer is “no,” as shown by several recent papers.
Conlon and Patel show that American students exhibit dramatic biases about how majors connect to careers.21 Using administrative and survey data, they find that students grossly overestimate their likelihood of ending up in their major’s “stereotypical” career. For instance, 63 percent of biology majors expect to be doctors (versus 23 percent in reality), 65 percent of art majors expect to be artists (versus 17 percent), and 42 percent of journalism majors expect to be journalists (versus 4 percent). Students grossly underestimate how likely they are to end up in a career that is generic, meaning that it is not strongly associated with any major. Using a field experiment, the authors show that giving students accurate information causes them to rely less on stereotypes when choosing their majors.
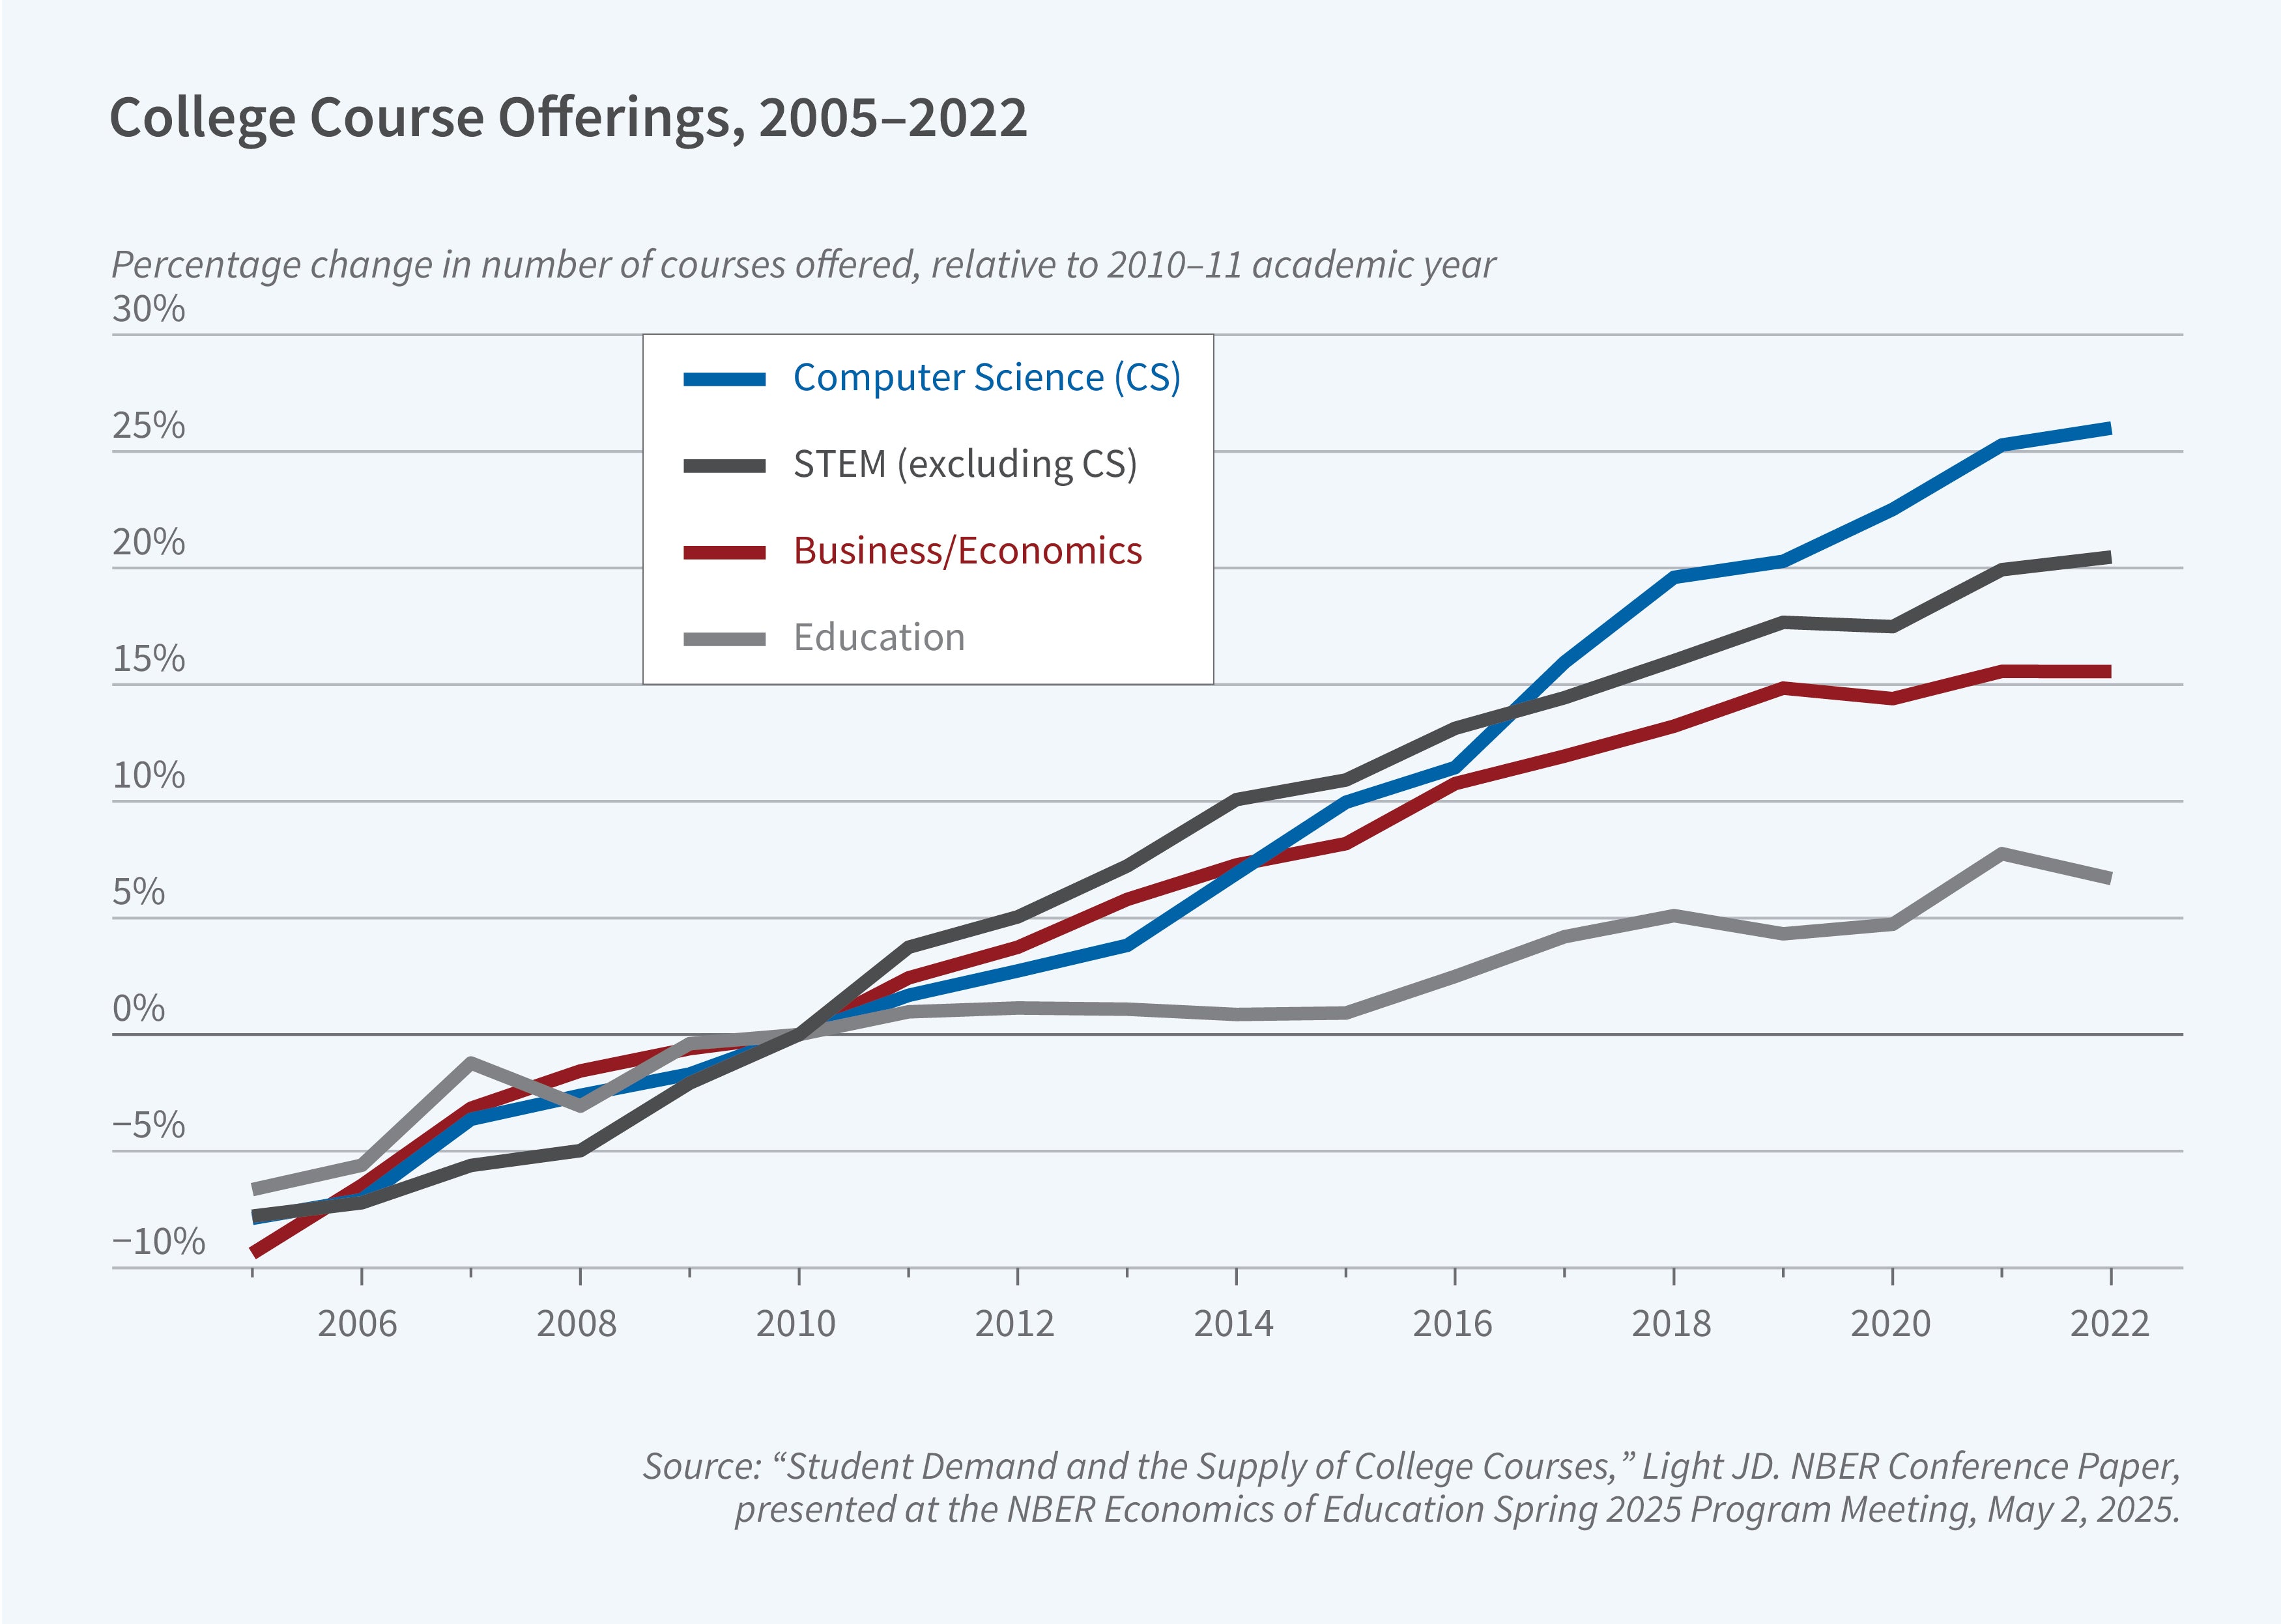
When the labor market demands more computer scientists, say, and fewer social workers, do universities respond by changing their supply of the relevant courses? Conzelmann, Hemelt, Hershbein, Martin, Simon, and Stange show that they do, although not all majors and universities are equally responsive.22 The authors identify supply responses using exogenous demand shocks to regional labor markets (a “shift-share” strategy). Light, using a similar empirical strategy but different data, finds broadly consistent results.23 Light’s methods are distinctive because he uses natural language processing to analyze hundreds of thousands of course descriptions. Taken together, the results suggest that universities respond to demand by offering more courses, more sections, and more instruction on skills that employers want. However, universities respond asymmetrically: They add supply more in growing fields than they contract supply in shrinking fields. See Figure 4.
Students may choose majors not just because of what is the best match for them but also because it is easier to signal ability in some majors than in others. Economic theory predicts that students who expect to face discrimination may be induced to choose certain majors in order to signal that they do not fit the stereotype. For instance, Black students may worry about discrimination caused by employers believing that selective universities lowered admission standards for them. Female students may have similar concerns about how to signal their math ability. In such cases, Black or female students who are able in math may be induced to major in, say, statistics—not because they are well matched but because it allows them to signal their abilities fairly precisely through the major and grades. Batistich, Bond, Linde, Mumford test this hypothesis using administrative data from several large universities.24 They show that able Black students are disproportionately likely to choose a major that offers precise signaling. Lepage, Li, and Zafar show that female students who are able in math are disproportionately likely to choose STEM majors and to reveal their grades to employers.25
How Artificial Intelligence Affects Education
When university materials such as lecture notes and study guides went online, many professors observed that the change made the distribution of achievement more bimodal. Highly motivated, compliant, able students performed even better because they still attended class, concentrated during class, studied, and came to office hours. Their effort was more productive, though, because they had access to comprehensive materials 24 hours a day, 7 days a week. On the other hand, students who struggled with motivation, compliance, and understanding performed worse because the ready availability of online materials tempted them to neglect class, procrastinate, and hope that the materials would substitute for in-person help. I remember going through the transition while teaching advanced undergraduate econometrics over several years at Harvard. The increasing bimodality in the distribution of achievement was measurable.
Generative AI may affect learning in a similar way, with some students using the tools to make their effort more productive and other students using the tools to substitute for effort. It is very early days yet for evidence on how AI affects student learning, but one recent paper by Reyes and Contractor provides intriguing evidence.26 The authors run a lab-based experiment in which university students are assigned to learn about a novel topic (such as CRISPR gene editing), take before-and-after tests, and write a short essay. The students are randomly assigned to computer labs with and without access to generative AI tools. The authors find that the AI tools improve test performance and essays by about 0.25 standard deviations at the end of the learning session. These gains hold up when students take a follow-up test and write an essay using no AI tools one week later. The researchers find that the gains on the follow-up test are found primarily among students with high pre-experiment grade point averages. This may indicate that these students use AI tools differently from their classmates, thereby capturing greater benefits.
Endnotes
“When Your Bootstraps Are Not Enough: How Demand and Supply Interact to Generate Learning in Settings of Extreme Poverty,” Eble A, Escueta M. NBER Working Paper 31388, June 2023.
“How to Build a Reader: Evidence from a Scalable Literacy Intervention in Ghana,” Andersen ETJ, Graffy S, Kerwin JT, Lambon-Quayefio M. Presented at the NBER Economics of Education Spring 2026 Program Meeting, April 23, 2026.
“Financial Aid and Upward Mobility: Evidence from Colombia’s Ser Pilo Paga,” Londoño-Vélez J, Rodriguez C, Sanchez F, Álvarez-Arango LE. NBER Working Paper 31737, issued September 2023, revised February 2025.
“The Effects of Widespread Online Education on Market Structure and Enrollment,” Barahona N, Dobbin C, Otero S. NBER Working Paper 34522, November 2025.
“Program Report: Economics of Education, 2019,” Hoxby CM. NBER Reporter, April 2019.
“Do Test Scores Misrepresent Test Results? An Item-by-Item Analysis,” Bruhn J, Gilraine M, Ludwig J, Mullainathan S. NBER Working Paper 34484, issued November 2025, revised November 2025.
“Test Items, Outcomes, and Achievement Gaps,” Nielsen E. Presented at the NBER Economics of Education Fall 2018 Program Meeting, November 2, 2018.
“Skills That Pay: Subject-Specific Test Scores and Long-Run Outcomes,” Conrad CL, Pope NG, Zuo GW. Paper to be presented at the NBER Economics of Education Summer Institute 2026 Meeting, July 29, 2026.
“The Anatomy of a High-Return Question: Text, Skills, and the Economics of Achievement Measurement,” Moreno-Medina J, Nielsen E, Rodriguez V. Paper to be presented at the NBER Economics of Education 2026 Summer Institute Meeting, July 29, 2026.
“What Does a Good Teacher Sound Like? Using Machine Learning and Voice to Predict Teacher Effectiveness,” Arbour W, Koffi M, Oreopoulos P. Presented at the NBER Economics of Education Spring 2022 Program Meeting, April 29, 2022.
“Identifying a Cumulative Learning Technology: Evidence from Online Learning,” Shaikh H. Presented at the NBER Economics of Education Fall 2025 Program Meeting, December 5, 2025.
“Assessing the Costs of Balancing College and Work Activities: The Gig Economy Meets Online Education,” Aucejo EM, Perry AS, Zafar B. NBER Working Paper 32357, April 2024.
“The Education-Innovation Gap,” Biasi B, Ma S. NBER Working Paper 29853, issued March 2022, revised May 2023.
“Adapting for Scale: Experimental Evidence on Technology-Aided Instruction in India,” Muralidharan K, Singh A. NBER Working Paper 34205, issued September 2025, revised November 2025.
“Teaching Teachers to Use Computer Assisted Learning Effectively: Experimental and Quasi-Experimental Evidence,” Oreopoulos P, Gibbs C, Jensen M, Price J. NBER Working Paper 32388, April 2024.
“Can Technology Facilitate Scale? Evidence from a Randomized Evaluation of High Dosage Tutoring,” Bhatt MP, Guryan J, Khan SA, LaForest-Tucker M, Mishra B. NBER Working Paper 32510, May 2024.
“Laptops in the Long Run: Evidence from the One Laptop per Child Program in Rural Peru,” Cueto S, Beuermann DW, Cristia J, Malamud O, Pardo F. NBER Working Paper 34495, November 2025, and Journal of Public Economics 252, December 2025, Article 105538.
“The Effects of School Phone Bans: National Evidence from Lockable Pouches,” Allcott H, Baron EJ, Dee T, Duckworth AL, Gentzkow M, Jacob B. NBER Working Paper 35132, April 2026.
“The Impact of Cellphone Bans in Schools on Student Outcomes: Evidence from Florida,” Figlio DN, Özek U. NBER Working Paper 34388, October 2025.
“From Distraction to Dedication: Commitment and Incentives Against Phone Use in the Classroom,” Aksoy B, Lusher LR, Carrell SE. NBER Working Paper 33703, April 2025, and Journal of Economic Behavior & Organization 236, August 2025, Article 107082.
“What Jobs Come to Mind? Stereotypes About Fields of Study,” Conlon JJ, Patel DA. Presented at the NBER Economics of Education Fall 2024 Program Meeting, December 6, 2024.
“Skills, Majors, and Jobs: Does Higher Education Respond?” Conzelmann JG, Hemelt SW, Hershbein B, Martin SM, Simon A, Stange KM. NBER Working Paper 31572, August 2023.
“Student Demand and the Supply of College Courses,” Light JD. Presented at the NBER Economics of Education Spring 2025 Program Meeting, May 2, 2025.
“Statistical Discrimination and Optimal Mismatch in College Major Selection,” Batistich MK, Bond TN, Linde S, Mumford KJ. Presented at the NBER Economics of Education 2025 Summer Institute Meeting, July 23, 2025.
“Anticipated Gender Discrimination and Grade Disclosure,” Lepage LP, Li X, Zafar B. NBER Working Paper 30765, December 2022.
“Experimental Evidence on the Learning Impact of Generative AI,” Reyes GJ, Contractor Z. Presented at the NBER Economics of Education Spring 2026 Program Meeting, April 24, 2026.