The Economics of Variations in Health and Health Care
When my Dartmouth colleague Dr. John Wennberg drove through Vermont in the late 1960s collecting data on hospital admissions, surgical procedures, and doctor visits, he found something unexpected -- enormous variability in rates of medical care use across seemingly similar Vermont towns. In some school districts, nearly every school child still retained his tonsils, while in other districts, nearly every school child’s tonsils had been removed.
Since 1996, the Dartmouth Atlas of Healthcare has used national Medicare claims data to document regional variations in health care patterns, now across 306 "hospital referral regions" in the United States. The most recent data from 2010 shows per capita age-sex-race-price-adjusted Medicare expenditures ranging from $6,176 in LaCrosse, Wisconsin to $13,824 in McAllen, Texas. These variations have captured the attention of a now-expanding group of economists, physicians, and other social scientists. Both NBER and Dartmouth have been centers for this research, much of which has been supported with funding through the National Institute on Aging. My work, with various collaborators, has focused on three general questions:
1. What are the causes of regional variations in health care utilization?
Health status is one leading candidate for the observed variations; after all, regions in Louisiana or West Virginia should spend more, given the greater burden of disease and poverty in those states. One study drew on rich survey data of elderly Medicare enrollees with information about income, poverty status, health behaviors such as smoking and drinking, and self-reported health, and found that health and income explained one-third of overall regional variations, leaving two-thirds unexplained.1 A different approach compared treatment patterns for specific diseases such as heart attacks with highly detailed chart-review information; even this "apples-to-apples" approach finds considerable differences in risk-adjusted spending between the highest and lowest quintile of Medicare patients.2
Another explanation for the regional variations is patient preferences and demand more generally – people in high-spending regions may demand, and get, more health care. We have tested this hypothesis using a national survey of Medicare enrollees, where enrollees were asked about their preferences for more intensive diagnoses and treatments.3 However, we did not find that patient preferences in a region could explain more than a small fraction (generally less than 10 percent) of the overall regional variations in Medicare spending across regions.
If not health or demand, then perhaps these variations are the consequence of "supplier-induced demand": physicians prescribing more than medically necessary to augment their income. One problem with this explanation is that Medicare is a federally administered program that pays just about the same for procedures (adjusted for local prices) in LaCrosse, Wisconsin as in McAllen, Texas. If McAllen physicians are engaging in classic supply-induced demand behavior, then why aren't LaCrosse physicians?
If not the standard supplier-induced demand story, then perhaps a more subtle version applies: that physicians perform clinically unnecessary procedures in response to peer pressure from referring physicians, or because patients insisted on them. We found that physicians were surprisingly disposed to reporting such effects, but these factors didn't explain regional differences in Medicare expenditures. Instead, physician beliefs in the effectiveness of intensive treatments for chronically ill patients (for example those with serious Class IV heart failure) were the best explanation for why some regions spent so much more than others.4 That many of these beliefs were inconsistent with guidelines set by the American College of Cardiology, and the American Heart Association, at least points to the possibility that some treatments are being provided with very little benefit to patients.
2. What are the consequences of regional health care variations?
What are the welfare consequences of these variations in spending, in terms of improved health and longevity? If more spending leads to better health, then perhaps some regions are spending too little. There is some controversy about the association between spending and health outcomes, with some studies showing zero or even negative associations between spending and survival or quality of life.5 Still others, using instrumental variables approaches, have shown that higher spending is associated with better health outcomes, for example Joseph Doyle and colleagues' research showing greater health returns to tourists with acute emergency room admissions admitted to higher cost hospitals,6 or for those patients who happen to be picked up by an ambulance loyal to higher-spending hospitals.7 Some sense of this ambiguity can be seen in an earlier study by Elliott Fisher and colleagues; using a variety of datasets and measures of both intensity and health outcomes, they tested this hypothesis in 42 different ways, and found 23 showed a negative association, 14 a zero association, and 5 a positive association – in other words, no consistent pattern.8
How can this empirical puzzle be explained? One approach is to recognize that health care offers a mind-boggling variety of different treatments, ranging from aspirin for heart attacks (highly effective, nearly costless), to antiretrovirals for HIV and AIDS patients (highly effective, even if costly), to proton beam therapy for prostate cancer (no known medical benefits over alternatives, very expensive). Thus $1,000 in extra spending could go for valuable treatments that save lives, or it could be devoted to useless (or even harmful) treatments or diagnostic tests. Without knowing more about how the money is spent, it's nearly impossible to discern how some measure of average health care spending should be associated with health outcomes, so it is probably not surprising to find confusion as well in the empirical evidence. As it turns out, the productivity literature in economics provides a valuable conceptual and empirical framework for addressing this question of how spending relates to health.
Why are productivity differences so important in explaining regional variations?
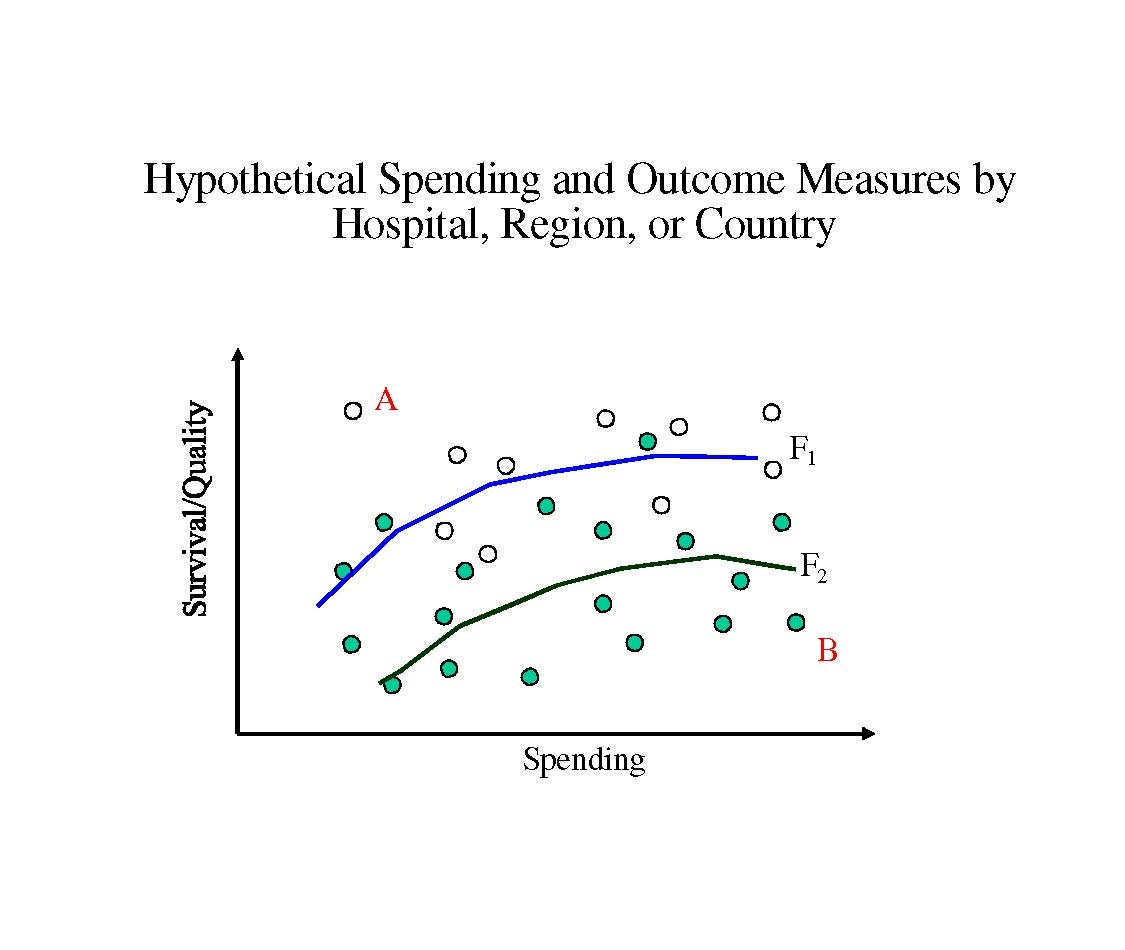
Nearly every study of spending and outcomes shows a similar pattern – wide variability in both health outcomes and health spending, as shown in the figure. Each dot could represent (for example) outcomes for a specific hospital, or it could be for a region or even a country.9 Empirically, the correlation between these dots could be positive, negative, or zero; the slope of the line is less important than the scatter-shot nature of the data. The key point is that, relative to the most productive hospital or country in the upper left hand corner of the graph (denoted A), the other hospitals either cost more, get worse health outcomes, or both, as is the case for Hospital B.
Amitabh Chandra and I, following on earlier work by Wennberg and colleagues, have tried to capture these productivity issues in the context of a simple model that characterizes medical treatments from most cost-effective to least cost-effective.10 The most cost-effective treatments, like antiretrovirals for AIDS and HIV patients, are deemed "Category I," while treatments with heterogeneous benefits – helpful for some, but not all patients, such as stents for cardiovascular disease – are "Category II." Finally, treatments like proton beam therapy with little known value but very high costs are viewed as "Category III" treatments.
As Douglas Staiger and I found for the treatment of heart attacks, hospitals that adopted Category I treatments like aspirin and beta blockers –pennies per pill – showed consistently better health outcomes with identical costs; in other words, they were the hospitals with the open dots, characterized by the production function F1 in the Figure above, rather than on F2 which characterized the slower adopters marked by the green dots.11 Similarly, the lower production function F2 can represent health care systems that are investing more heavily in Category III treatments, leading to the same outcomes but at higher costs. This Figure also illustrates why simple correlations between health care spending and health outcomes could be either positive or negative (or zero), even when the "true" return to spending is still positive, as shown by the generally positive slopes of the production functions.
Thinking about health care as an industry that is far from the production possibility frontier immediately raises the question of why – is there something specific about health care's lack of market incentives and dominance of third-party payers that might lead to such inefficiencies? One study suggests no, that in fact these differences in productivity in health care are little different from the degree of inefficiency in some other industries, and that the more productive hospitals actually gain market share over time. 12
There are also several unresolved questions. For example, why do some regions appear to do so much better in adopting "Category I" treatments (such as beta blockers for heart attack patients), and why were these same regions so rapid to adopt other innovations in non-health sectors as well (such as hybrid corn in the 1930s and 1940s)? 13 Second, why are regional variations for private health insurance often so different from patterns for Medicare patients? 14 Finally, will financial reforms such as those being implemented under the Affordable Care Act of 2010 lead existing health care providers to improve their productivity so that they figure out how to offer better quality care at lower cost?
Conclusion
Productivity in U.S. health care is a central issue to the economic health of the United States. My work and that of others suggests that between 10 and 20 percent of U.S. health care spending may have very little effect on health outcomes. These efficiency estimates are staggering -- 20 percent inefficiency in an industry comprising 18 percent of GDP is nearly 4 percent of GDP – and understate the additional efficiency costs of raising tax revenue to pay for the inefficient care.15
More importantly, there is likely to be enormous inefficiency because hospitals and providers are so far from the production frontier in health, whether because of the slow diffusion of new technologies, poor use of existing technologies, or a lack of knowledge about the value of commonly used treatments for different types of patients. Understanding better how to target and reward productivity improvements in health care can ultimately provide the basis for real productivity growth in health care: both saving money, and saving lives.
1. J. Sutherland, E. Fisher, and J. Skinner, "Getting Past Denial - The High Cost of Health Care in the United States," New England Journal of Medicine, 361(13) (September 24, 2009), pp. 1227-30.
2. E. Fisher, D. Wennberg, T. Stukel, D. Gottlieb, F. Lucas, et al., "The Implications of Regional Variations in Medicare Spending. Part 1: The Content, Quality, and Accessibility of Care," Annals of Internal Medicine, 138(4)(2003), pp. 273-87.
3. D. Cutler, J. Skinner, A. Stern, and D. Wennberg, "Physician Beliefs and Patient Preferences: A New Look at Regional Variation in Health Care Spending," NBER Working Paper No. 19320, August 2013.
4. Cutler et al., 2013, op. cit.
5. Institute of Medicine, "Variation in Health Care Spending: Target Decision Making, Not Geography," Consensus Report, July 24, 2013.
6. J. Doyle, Jr., "Returns to Local-Area Health Care Spending: Using Health Shocks to Patients Far From Home," American Economic Journal: Applied Economics 3 (2011), pp. 221-43. Also NBER Working Paper No. 13301, August 2007.
7. J. Doyle, Jr., J. Graves, J. Gruber, and S. Kleiner, "Do High-Cost Hospitals Deliver Better Care? Evidence from Ambulance Referral Patterns," NBER Working Paper No. 17936, March 2012.
8. E. Fisher, D. Wennberg, T. Stukel, D. Gottlieb, F. Lucas, et al., "The Implications of Regional Variations in Medicare Spending. Part 2: Health Outcomes and Satisfaction with Care," Annals of Internal Medicine 138, (February 18 2003), pp. 288-98.
9. A. Garber and J. Skinner, "Is American Health Care Uniquely Inefficient?" Journal of Economic Perspectives, 22 (2008), pp. 27-50. Also NBER Working Paper No. 14257, August 2008.
10. A. Chandra and J. Skinner, "Technology Growth and Expenditure Growth in Health Care," Journal of Economic Literature 50 (2012), pp. 645-80. Also NBER Working Paper No. 16953, April 2011. See also J. Wennberg, E. Fisher, and J. Skinner, "Geography and the Debate over Medicare Reform," Health Affairs 21(2)(2002), pp. w96-w144.
11. J. Skinner and D. Staiger, "Technology Diffusion and Productivity Growth in Health Care," NBER Working Paper No. 14865, April 2009.
12. A. Chandra, A. Finkelstein, A. Sacarny, and C. Syverson, "Healthcare Exceptionalism? Productivity and Allocation in the U.S. Healthcare Sector," NBER Working Paper No. 19200, July 2013.
13. J. Skinner and D. Staiger, "Technology Adoption from Hybrid Corn to Beta Blockers," in Hard to Measure Goods and Services: Essays in Honor of Zvi Griliches, E. Berndt and C. Hulten, eds., Chicago: University of Chicago Press, 2005. Also NBER Working Paper No. 11251, April 2005.
14. M. Chernew, L. Sabik, A. Chandra, T. Gibson, and J. Newhouse, "Geographic Correlation Between Large-Firm Commercial Spending and Medicare Spending." American Journal of Managed Care 16.2 (February 2010), pp. 131-8.
15. K. Baicker and J. Skinner, "Health Care Spending Growth and the Future of U.S. Tax Rates," in Tax Policy and the Economy: volume 25, J. Brown, ed., Chicago: University of Chicago Press, 2011. Also NBER Working Paper No. 16772, February 2011.


