US Treasury Bonds and Trade Policy Uncertainty
In April 2025, the United States implemented its highest tariffs in a century, triggering reciprocal tariff announcements from China, Canada, and the European Union. In the days following the tariff announcements, the S&P 500 fell more than 11 percent. The yield on 30-year Treasury bonds rose and peaked at 5.2 percent in late May, its highest level since before the 2007–08 global financial crisis.
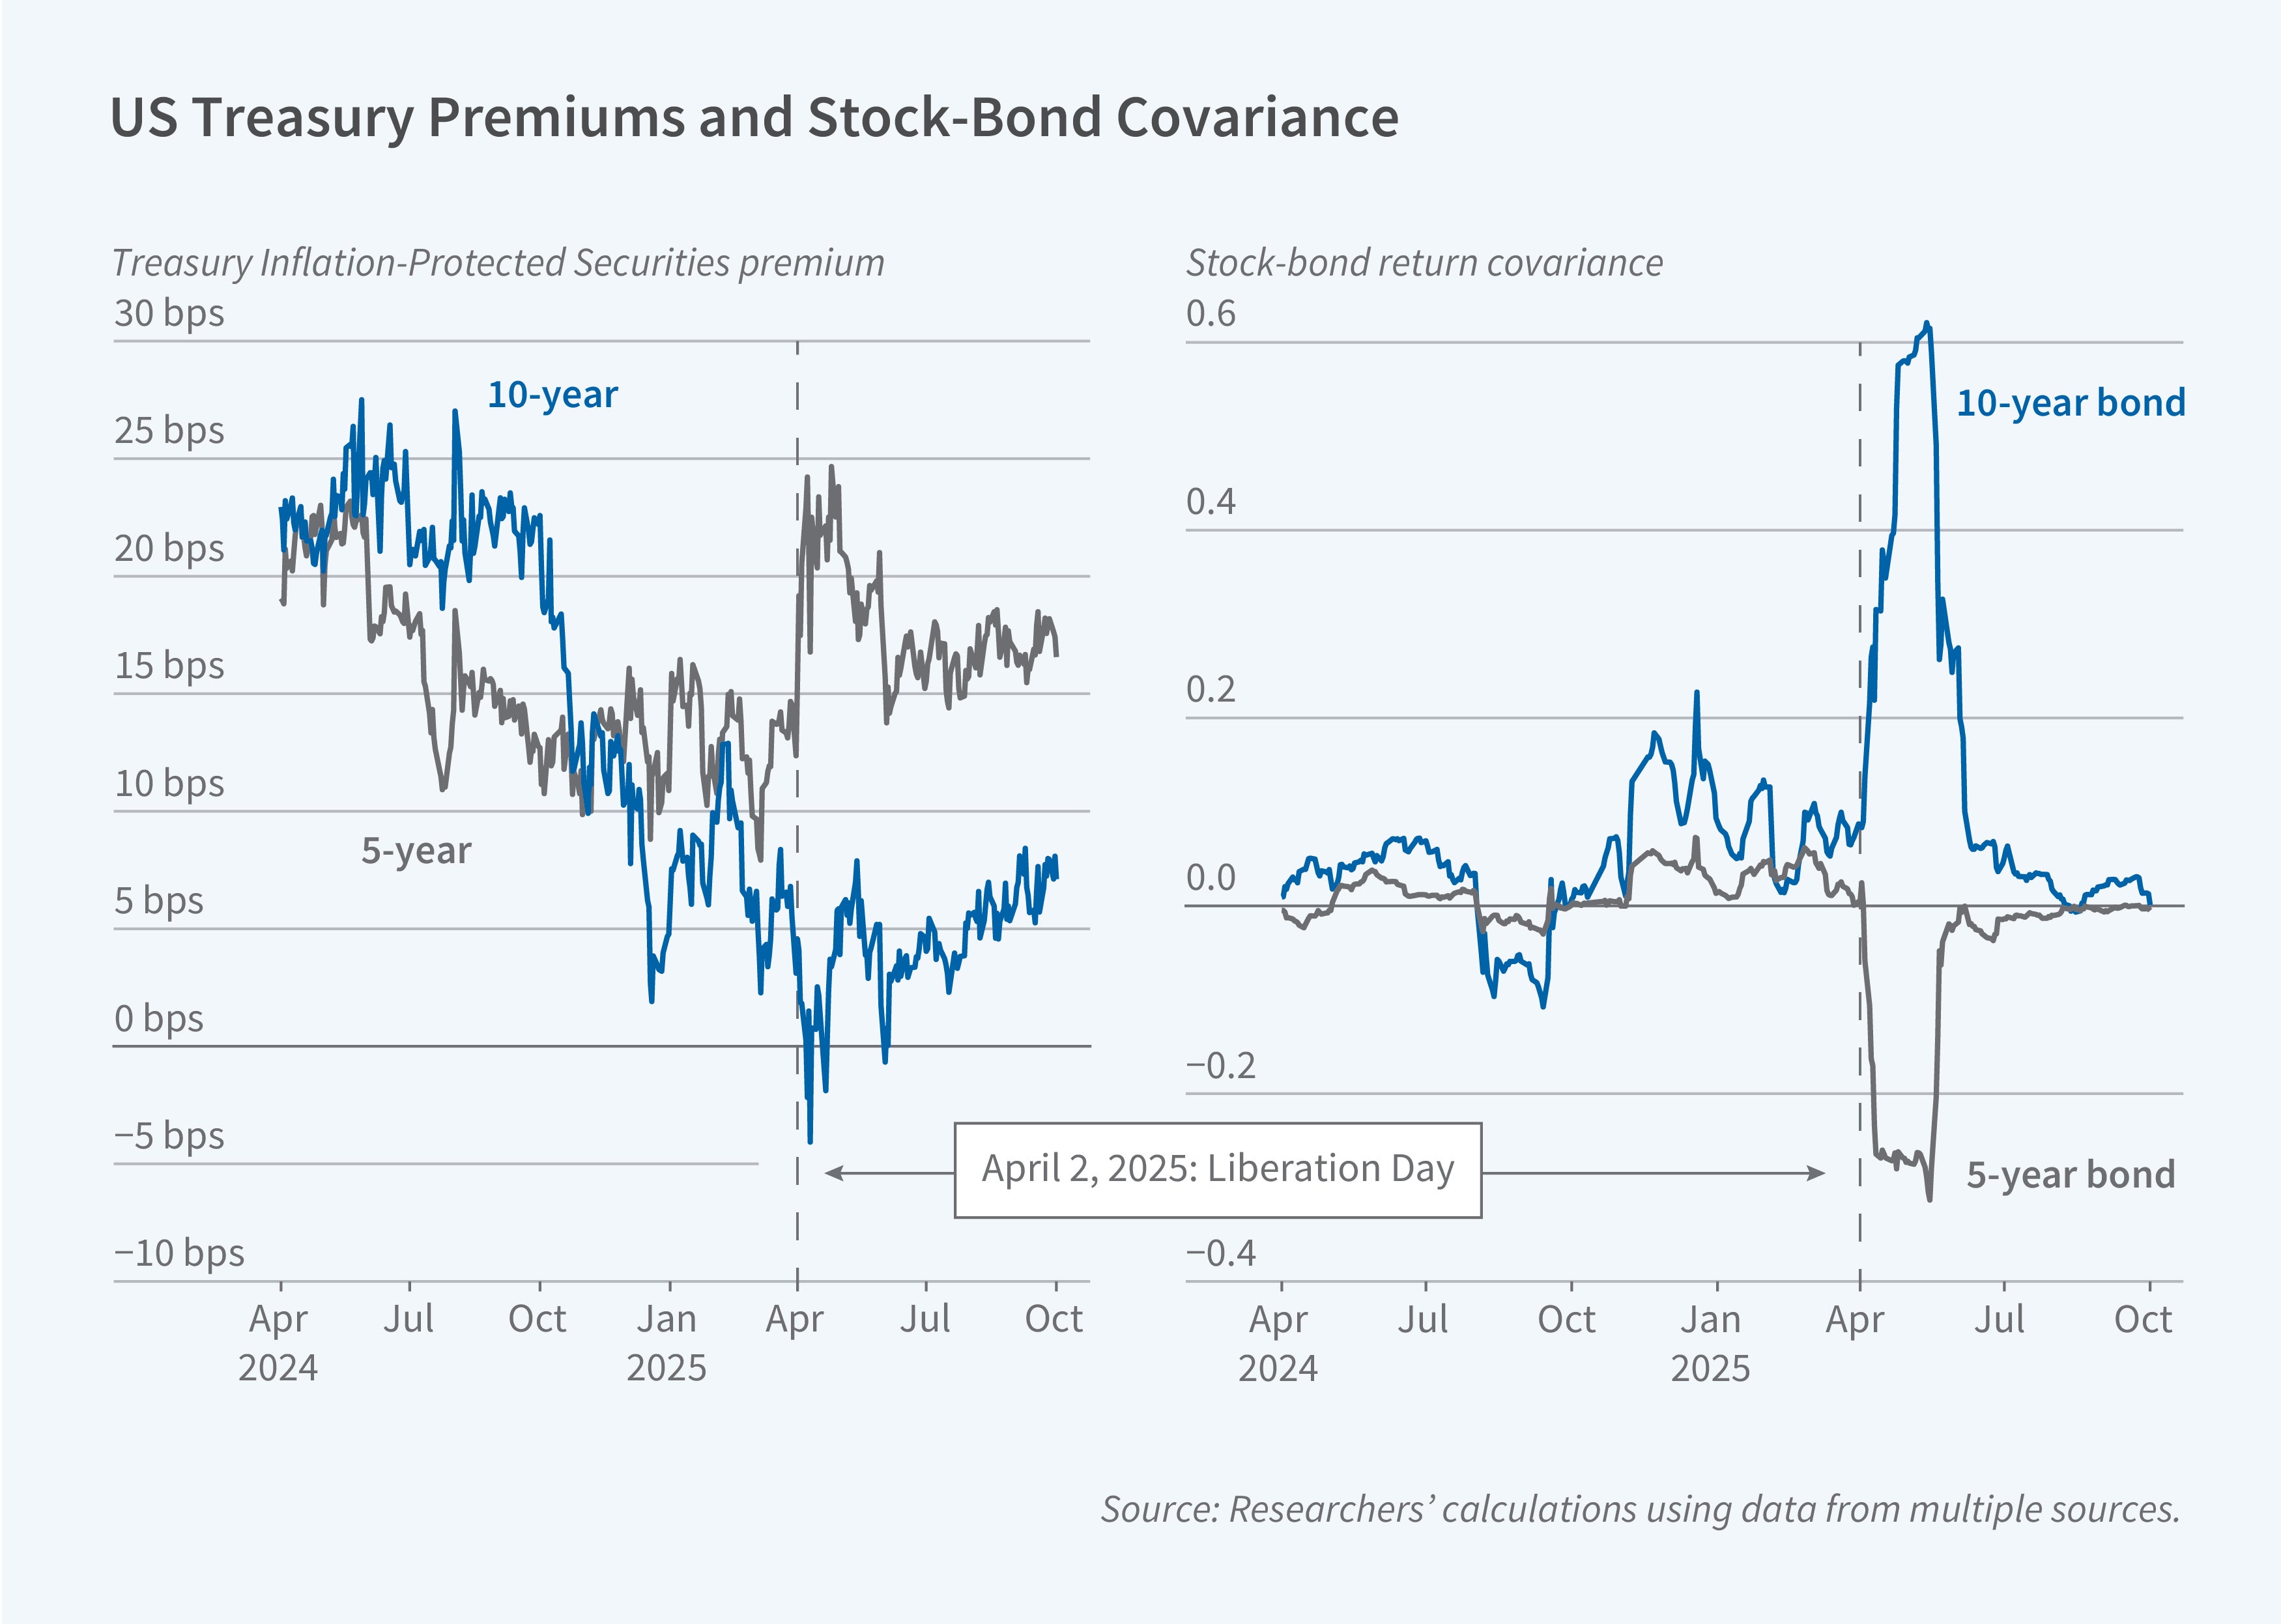
In Tariff War Shock and the Convenience Yield of US Treasuries—A Hedging Perspective (NBER Working Paper 34640), Viral V. Acharya and Toomas Laarits investigate the breakdown in long-term Treasury bonds' traditional role as a hedge against stock market declines. The researchers decompose Treasury yields into three components: a risk-free rate, a credit spread, and a convenience yield. They measure convenience yield using the Treasury Inflation-Protected Securities (TIPS)-Treasury premium, which compares nominal Treasury yields with synthetic nominal Treasuries constructed from TIPS and inflation swaps. The convenience yield—the premium investors pay for Treasury securities' liquidity, safety, and collateral value—typically ranges between 10 and 40 basis points for long-term bonds. Using intraday data at five-minute intervals from two actively traded exchange-traded funds—SPY, an S&P 500 fund, and IEF, a fund of 7–10 year maturity nominal Treasuries—they calculate daily stock-bond covariances to capture rapid shifts in market dynamics.
The 10-year TIPS-Treasury premium declined by nearly 10 basis points from late March 2025 to its trough on April 10, a significant drop relative to the average historical spread of 24 basis points. The two-year premium exceeded the 10-year premium by 7 basis points in April 2025, reversing the typical relationship where these measures were historically an average of only 2 basis points apart.
On April 9, April 11, and April 23, three days coinciding with major tariff announcements, the returns on long-term Treasuries exhibited positive covariance with stocks, meaning they declined alongside equities rather than serving as a hedge. The April 23 positive covariance ranked in the top 0.25 percent of all trading days since 2005. Decomposing bond returns by yield component shows that the positive covariance arose specifically from day-to-day changes in convenience yield at the 10-year maturity, while the two- and five-year convenience yields maintained their traditional negative covariance with stocks.
Using historical data spanning two decades, the researchers estimate that the shift in hedging properties can account for approximately 12 basis points of the convenience yield decline, a magnitude that is consistent with the observed drop. Throughout the period following the tariff announcements, the short end of the Treasury curve continued exhibiting safe-asset properties, with two- and five-year convenience yields increasing over 10 basis points relative to their pre-announcement levels.
The researchers consider two potential explanations for the shift in the hedging properties of long-term Treasuries. One is changing demand for long-term Treasuries as a safe long-term asset. Treasury International Capital System data show $47 billion in outflows from long-term US Treasuries in April 2025, a 2 standard deviation shift from the typical $47 billion monthly inflow since February 2023. The euro area, Canada, and Asian countries all sold Treasuries opposite their historical pattern during market stress. Meanwhile, gold appears to have emerged as an alternative safe asset. Intraday analysis shows a negative relationship between stock-bond and stock-gold covariances. On days when Treasuries exhibited positive covariance with stocks, gold showed negative covariance, suggesting investors substituted gold for long-term Treasuries as a hedge.
A second potential explanation is rising inflation expectations. Higher expected inflation can reduce long-term convenience yields more than short-term convenience yields. However, inflation expectations rose only modestly in April 2025: 36 basis points for the two-year, 13 basis points for the five-year, and just 5 basis points for the 10-year convenience yields. These increases are insufficient to explain the 15 basis point divergence between short-term and long-term convenience yields. It appears, therefore, that the observed changes reflected concerns about Treasury hedging properties rather than inflation expectations.


