Bank Liquidity and the Dynamics of the Fed’s Balance Sheet
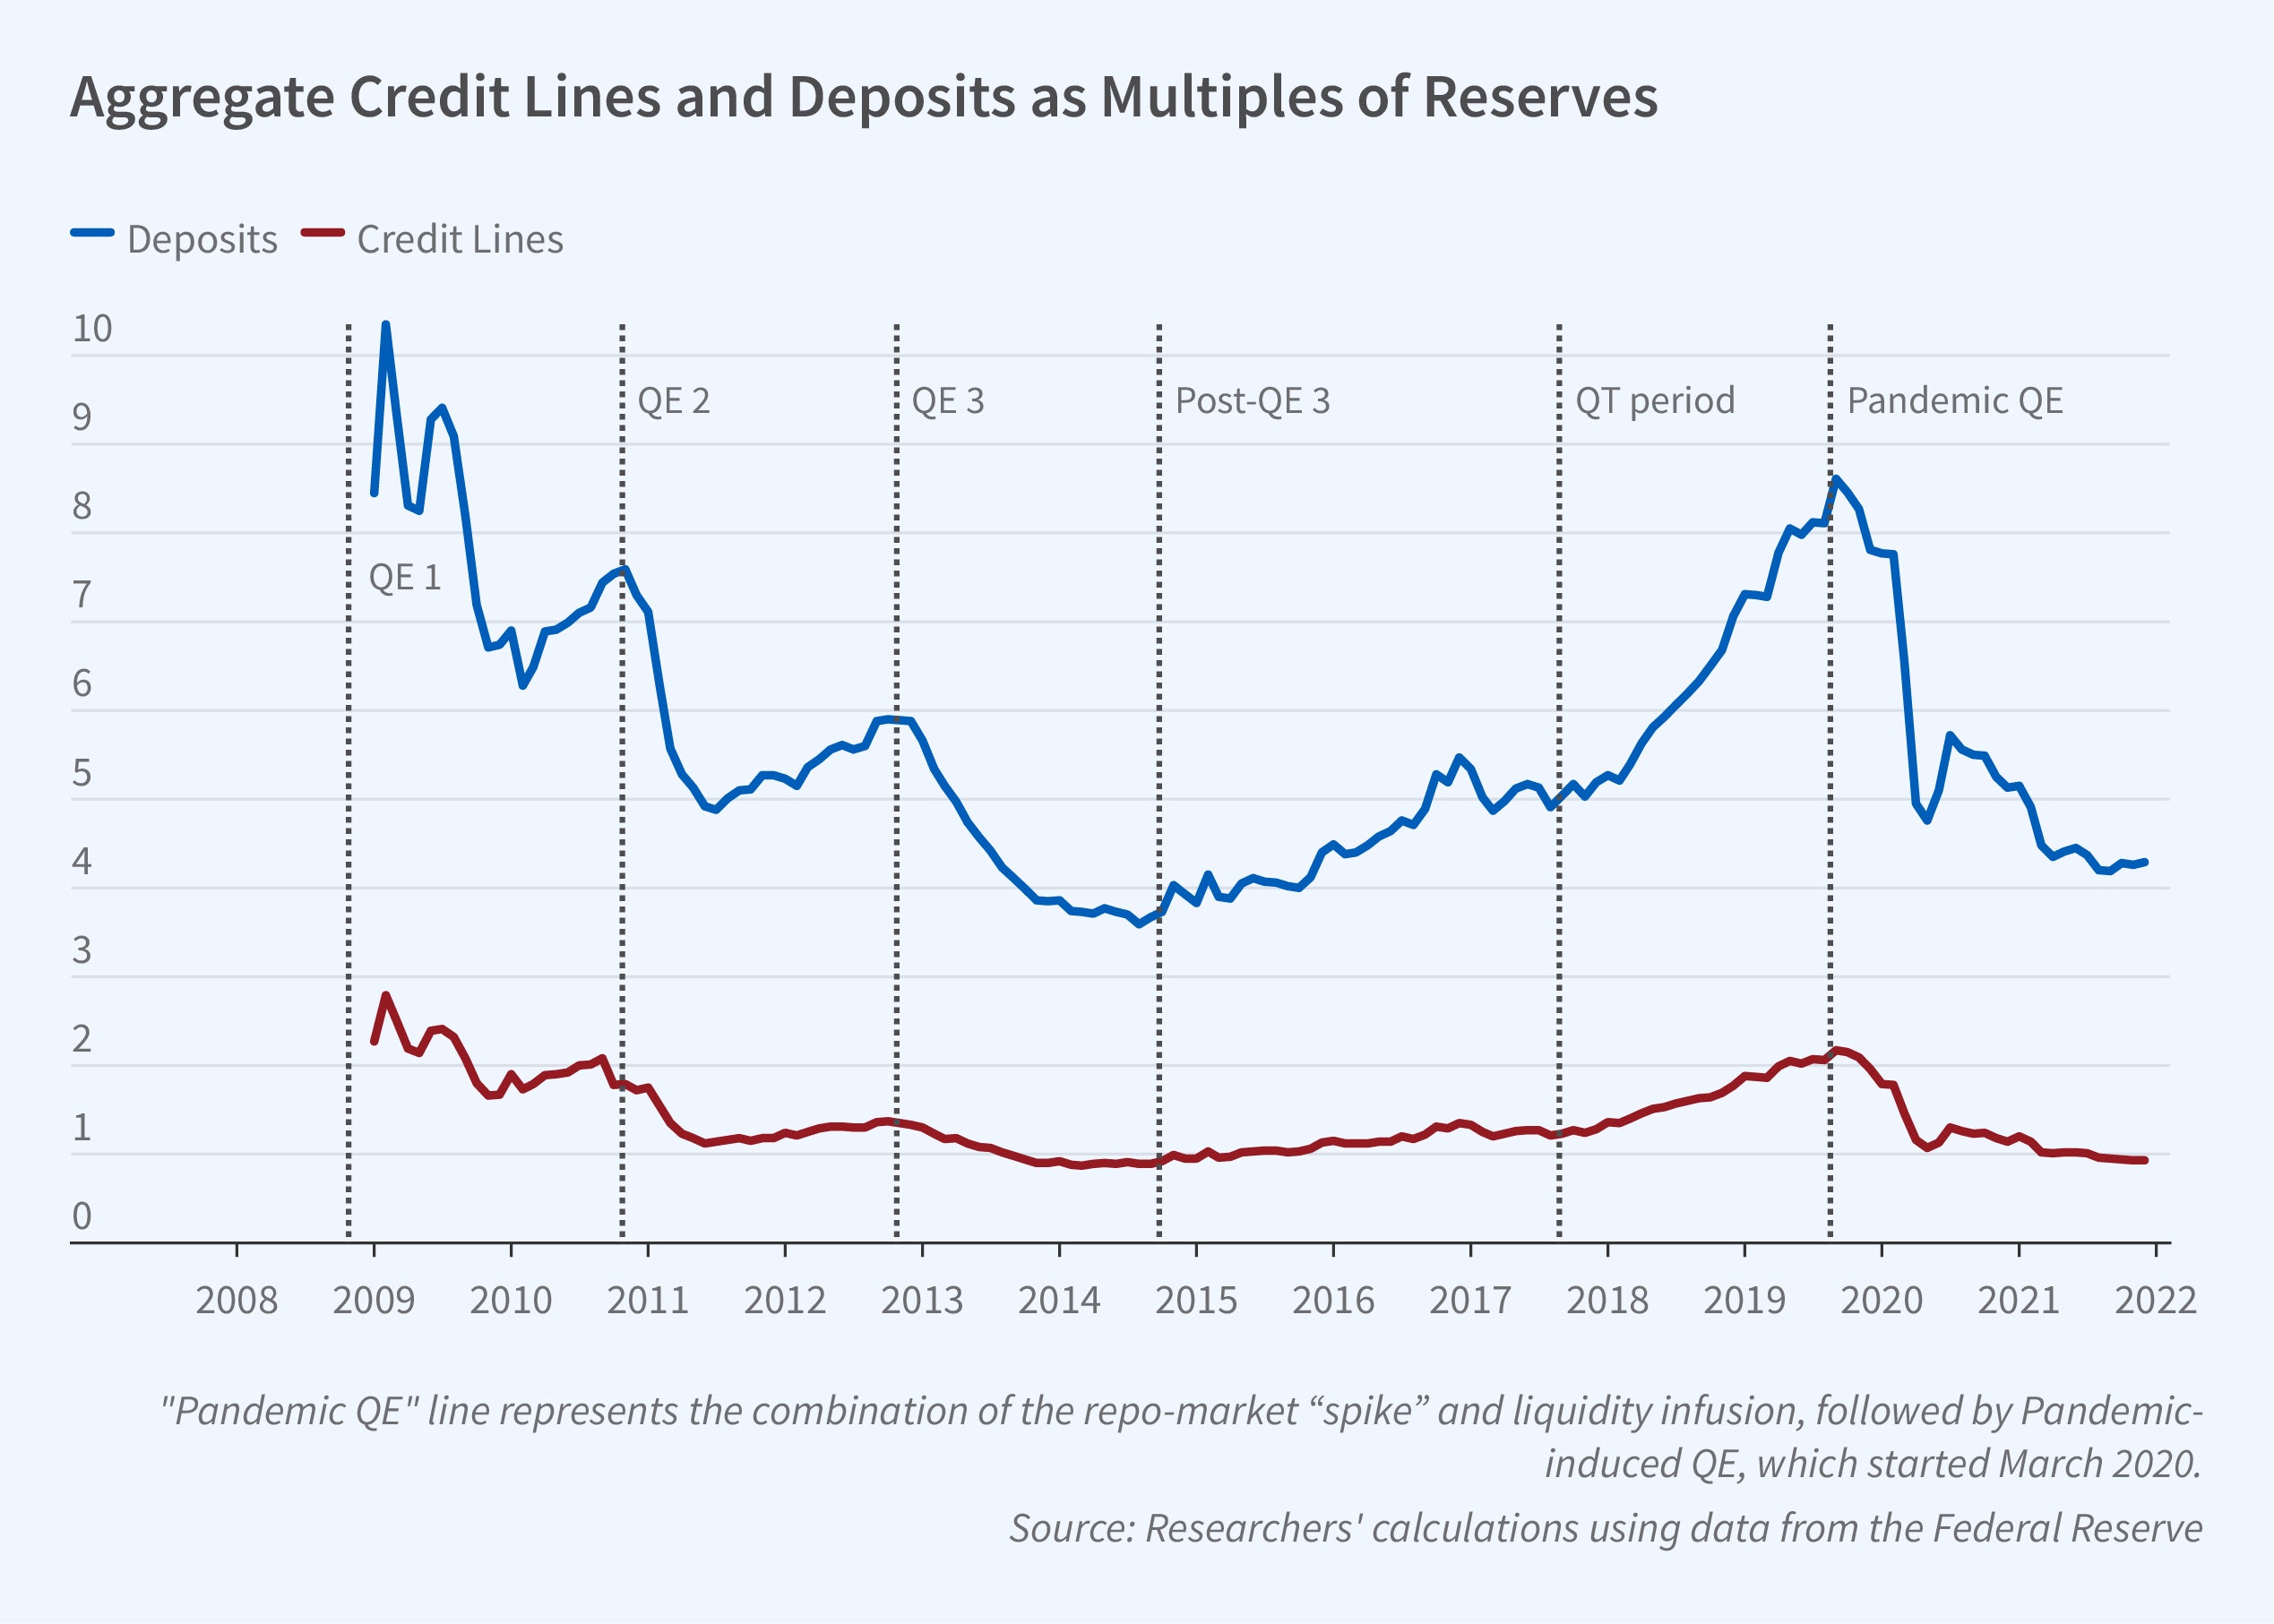
In the wake of the global financial crisis of 2007–09, the Federal Reserve embarked on an ambitious program of quantitative easing (QE), purchasing large quantities of bonds held by commercial banks and the rest of the economy. QE gave banks an infusion of liquidity by exchanging their longer-term assets for liquid reserves. On the liability side, however, there was an expansion of demand deposits at banks, especially uninsured deposits such as checking accounts that depositors can withdraw from at any time. Banks also responded by originating off-balance-sheet liabilities in the form of lines of credit, which allow businesses to draw funds, up to a limit, at their discretion. Both demand deposits and credit lines are claims on the bank’s liquidity, and providing them without placing the bank at risk requires an appropriate stock of bank liquidity.
As the Fed expanded its balance sheet, banks provided more liquidity to households and firms, but when the Fed retrenched, banks did not reduce their provision of liquidity and became vulnerable.
In 2017, the Fed reversed its QE policy and embarked on quantitative tightening (QT), shrinking its balance sheet by actively selling bonds for reserves, reducing Fed-provided liquidity in the banking system. While banks expanded their issuance of claims on liquidity during QE, they did not rein in such issuance when the Fed shifted to QT. Over time, as banks’ reserves diminished with QT, their ratio of outstanding claims on liquidity to reserves increased. In effect, the banks held constant the amount of withdrawals that depositors and firms could demand from them, even though their liquid reserves declined. This left the banks vulnerable to episodes of liquidity stress, in which many claimants demand their money at one time and banks have too little liquid cash to satisfy everyone’s claims. Indeed, two such episodes occurred during the QT period, in September 2019 and in March 2020. In both cases, the Fed intervened in financial markets to provide additional liquidity.
In Liquidity Dependence and the Waxing and Waning of Central Bank Balance Sheets (NBER Working Paper 31050), Viral Acharya, Rahul Chauhan, Raghuram Rajan, and Sascha Steffen chronicle the evolution of both central bank balance sheet policy and banking sector issuance of liquidity claims over the last 15 years and develop tests for the causal pathways between the two.
The researchers demonstrate, using bank-level data, that increases in banks’ central bank reserves during QE were associated with increases in the volume of demand deposits and credit lines. In contrast, they do not find that the banks that provided customers with more claims on liquidity during QE reduced those claims when QT kicked in. This dynamic was particularly driven by less-well-capitalized banks, which maintained their provision of liquidity claims to customers even as their reserves declined. These banks may have been less risk averse on account of their weaker balance sheet positions.
The researchers conclude that QE and QT are not mirror images of each other. The two policies change banks’ liquidity-seeking behavior in different ways, and differently for different banks. This asymmetry is also manifest in the recent failures of banks such as Silicon Valley Bank and Signature Bank that grew their uninsured deposit base during the pandemic QE but did not decrease it sufficiently during the monetary tightening phase of 2022. Such asymmetric bank behavior complicates the use of the Federal Reserve’s balance sheet as a tool for monetary stimulus.
—Shakked Noy


