The Pass-Through of US Tariffs
In September 2025, the US trade-weighted average statutory tariff rate stood at 27 percent, the highest in over a century. Tariffs applied to purchases from 176 countries that together accounted for more than 70 percent of total US imports. In The Incidence of Tariffs: Rates and Reality (NBER Working Paper 34620), Gita Gopinath and Brent Neiman analyze the 2025 US tariff episode as well as the 2018–19 experience to determine who bears the costs of tariffs and how they reshape American commerce.
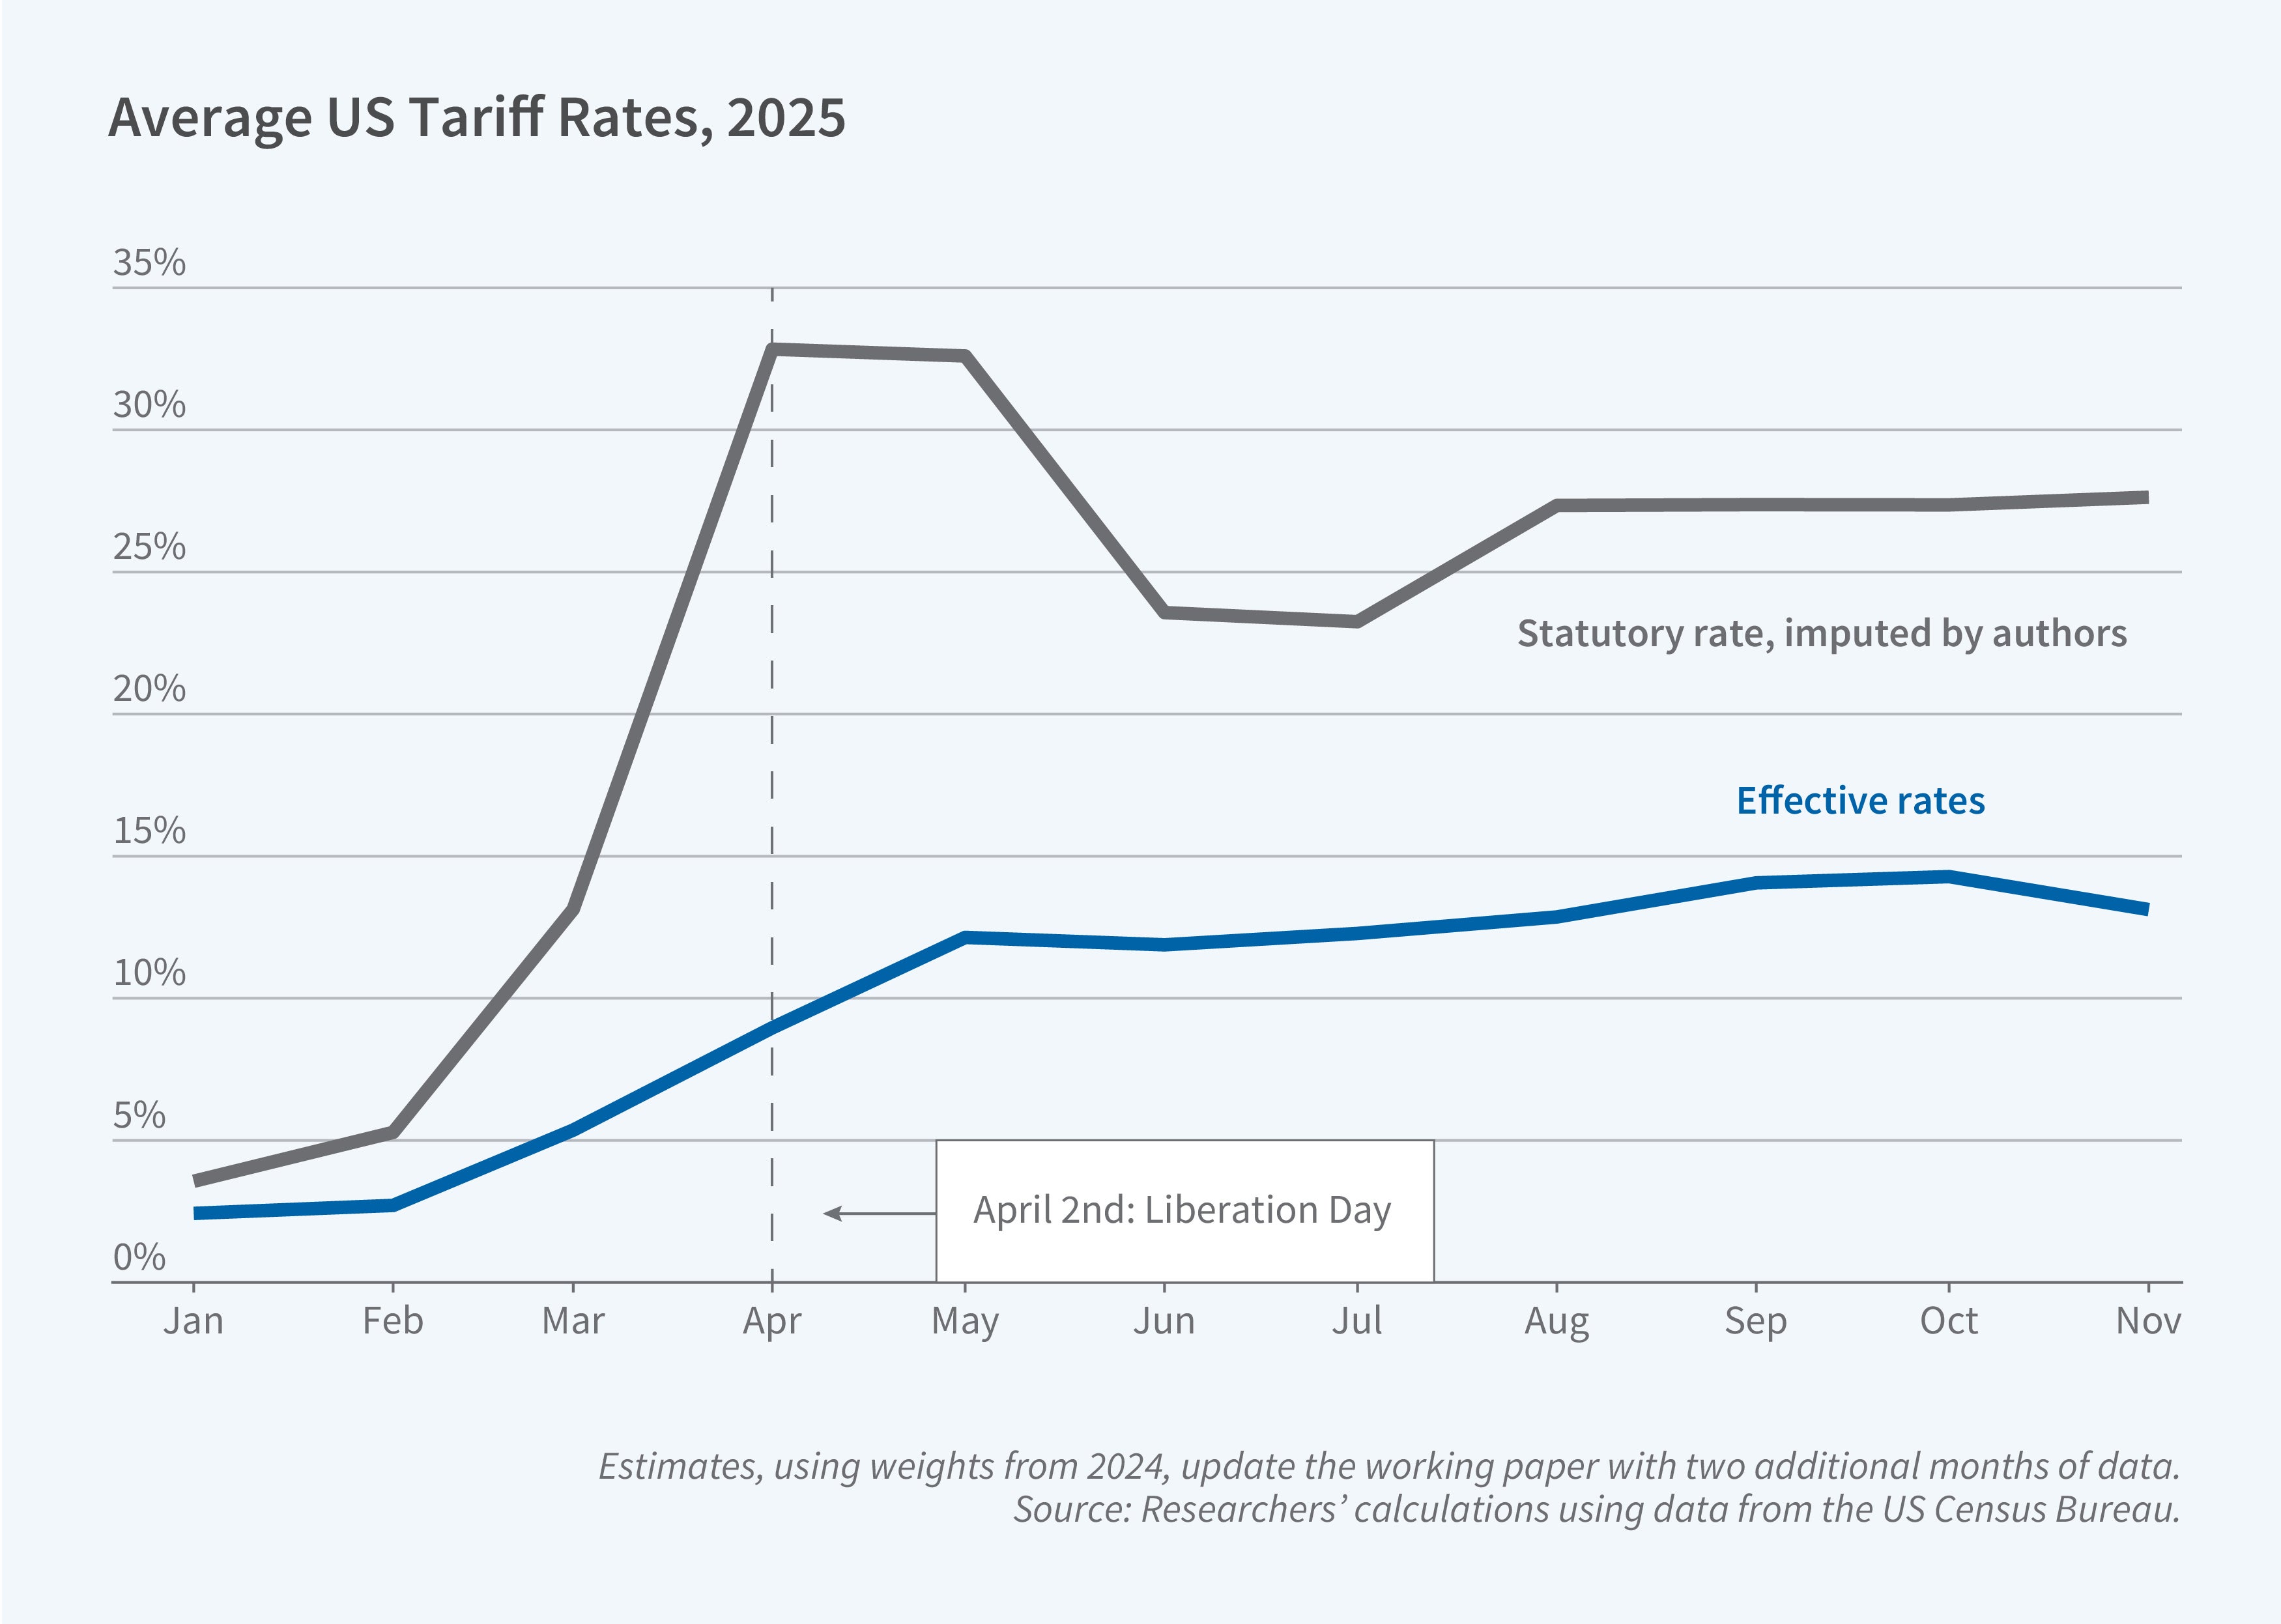
Actual 2025 tariffs were only about half as large as announced tariffs. They passed through almost entirely to the tariff-inclusive price of imports.
The researchers’ analysis of US Census Bureau data covering 19,000 product categories finds that in September 2025, the actual tariff rate paid was 14.1 percent, roughly half the statutory rate of 27.4 percent. This gap was the result of four factors: shipping lags and an "on-the-water exemption" that delayed the implementation of tariffs, product- and company-specific exemptions, increased utilization of the United States-Mexico-Canada Agreement (USMCA), and uneven enforcement or evasion. USMCA utilization rates jumped from below 50 percent in 2024 to nearly 90 percent in September 2025.
The researchers estimate pass-through rates of 80 percent for the 2018–19 tariffs and 94 percent for the 2025 tariffs, meaning US importers bore most of the tariff costs as foreign exporters generally did not reduce their prices. This finding of high pass-through held broadly across most countries and sectors.
China's share of US goods imports fell from 22 percent at the end of 2017 to 12 percent by late 2024, and dropped sharply to just 8 percent by September 2025. Countries like India and Vietnam gained market share, though the extent to which this represents genuine production shifts versus transshipment of Chinese goods remains an open question.
Using input-output data, the researchers calculate "production tariffs"—hypothetical tax rates on total production costs that would have equivalent impacts as the import tariffs. For US manufacturing overall, production tariffs increased by 1.06 percentage points in 2025. Some heavily affected sectors saw increases exceeding 2 percentage points, including heavy-duty trucks, which faced a 3.9 percentage point increase due to its reliance on imported steel and vehicle parts. The researchers find suggestive evidence that these production tariffs pass through to producer prices: 86 percent of manufacturing sectors with production tariff increases exceeding 2 percentage points exhibited above-trend price increases in 2025.


