The Decline of the US Treasury Premium
For decades, the US government’s reputation as a stable and reliable financial partner has meant that investors around the world have been willing to buy US Treasuries at low interest rates that in part reflect a so-called convenience yield. The rise in US public debt in the last 25 years has raised questions about the long-term sustainability of this situation. In Convenience Lost (NBER Working Paper 33940), Zhengyang Jiang, Robert J. Richmond, and Tony Zhang investigate whether the rising supply of US government debt has compressed convenience yields and how this relationship differs across Treasury maturities.
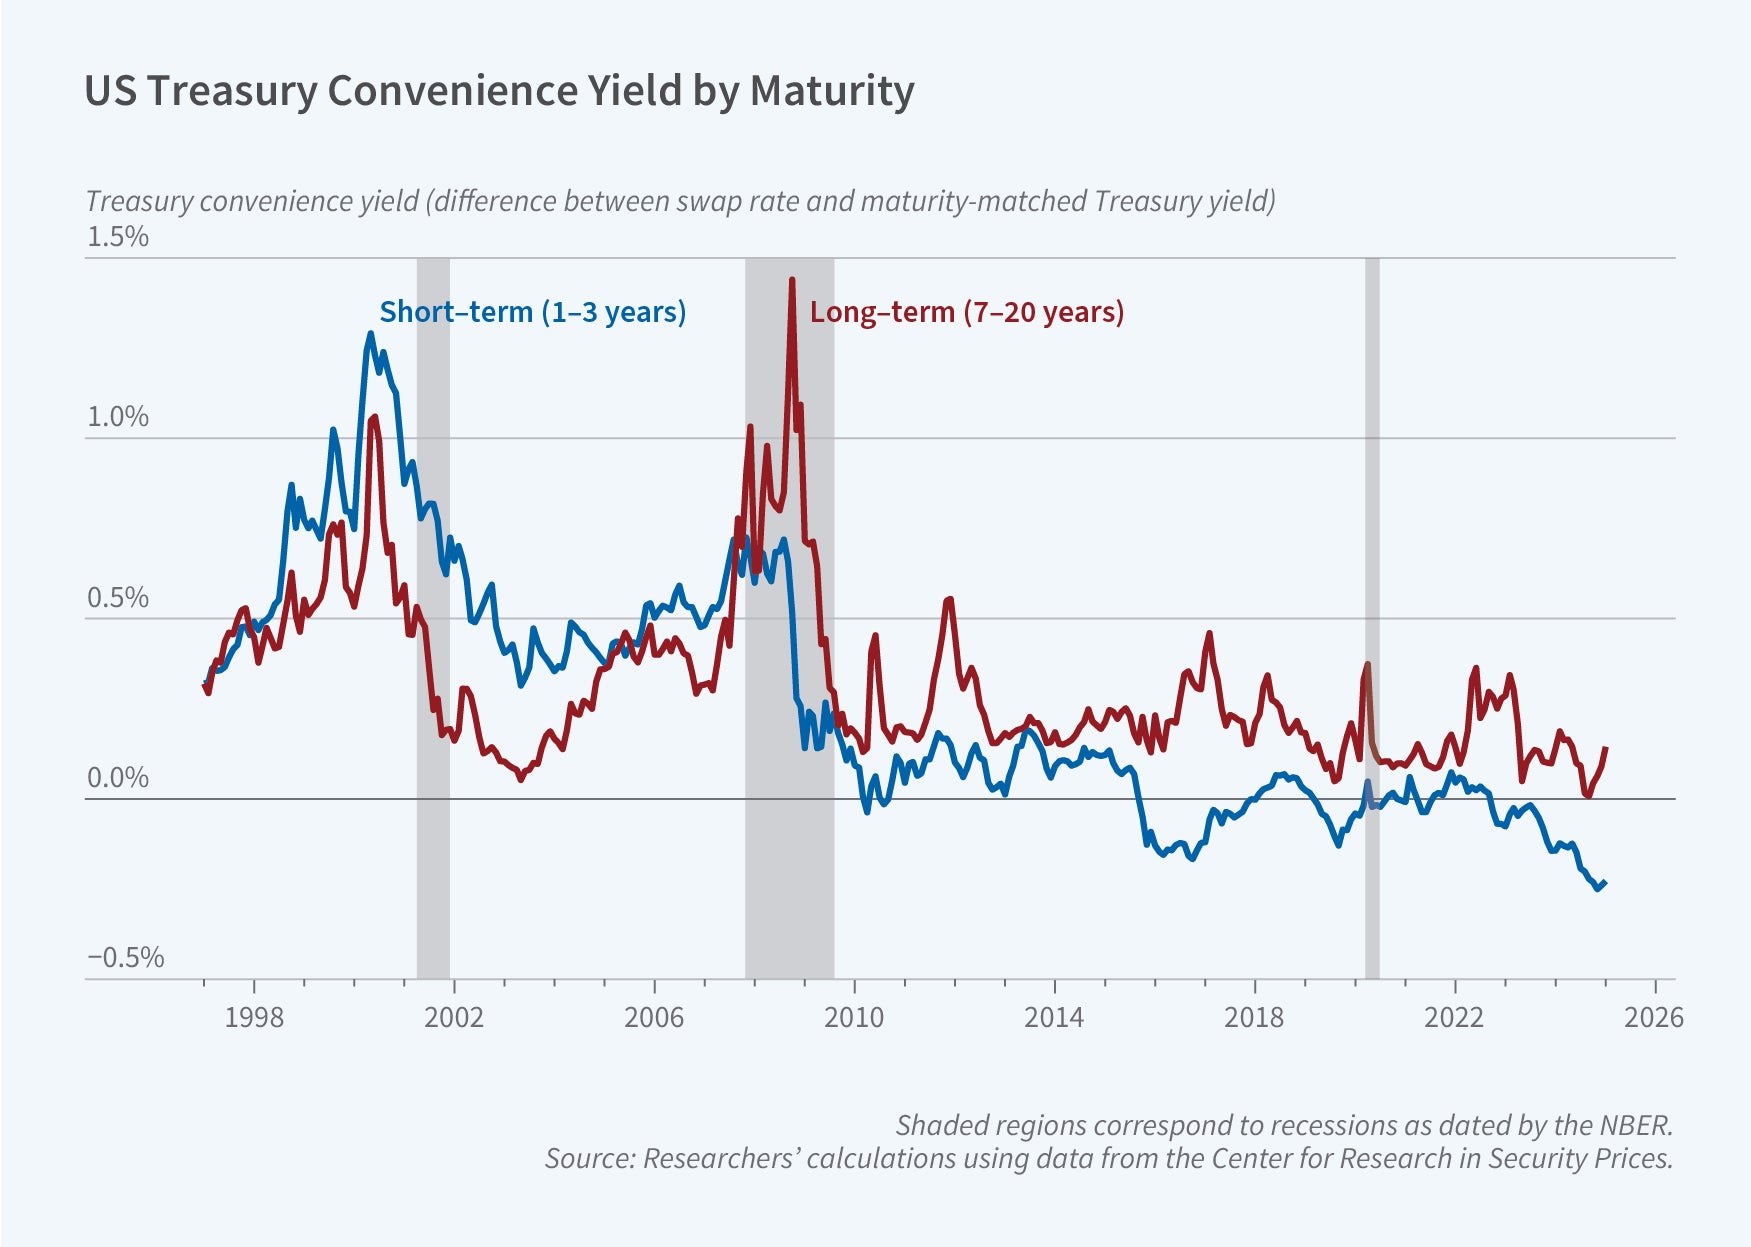
The “convenience yield” on US Treasury bonds has declined as the supply of these bonds has grown.
The researchers calculate government debt levels as the total market value of Treasury notes and bonds in three maturity buckets: short-term (1–3 years to maturity), medium-term (3–7 years), and long-term (7–20 years). They calculate the convenience yield as the gap between Treasury yields and a risk-free benchmark constructed from maturity-matched swap rates. They find that over the 1998–2023 period, convenience yields are strongly negatively correlated with the debt-to-GDP ratio. This negative correlation is strongest for long-term and weakest for short-term Treasuries.
This correlation is not, however, sufficient to establish a causal relationship between government debt issuance and falling convenience yields. Perhaps economic shocks both lower convenience yields and cause the US government to issue more debt. To circumvent this problem, the researchers identify federal tax changes motivated by long-run growth or philosophical considerations, not economic conditions, and treat them as exogenous shocks that can be used to isolate the causal effects of debt on convenience yields.
Their results suggest that a 5 percentage point increase in the Treasury debt-to-GDP ratio causes the convenience yield on long-term Treasuries to decrease by 0.94 percentage points while that on medium-term bonds falls by 0.41 percentage points. The researchers do not find any statistically significant effect of higher debt levels on the convenience yields of short-term Treasuries.
The researchers also consider an alternative measure of the premium investors place on holding US Treasuries: the gaps between the convenience yields of US Treasuries and those of other government bonds, or the “Treasury basis.” They find that a 5 percentage point increase in the debt-to-GDP ratio causes the Treasury basis for long-term Treasuries to decline by 0.74 percentage points while that for medium-term Treasuries declines by 0.35 percentage points. Once again, there is no statistically significant decline for short-term Treasuries.
In the aggregate, convenience yields on Treasuries contribute to the seigniorage revenue earned by the US government for providing a safe and liquid store of value. By summing up the effects of Treasury issuance on convenience yields over the supply of debt outstanding, the researchers find that the US government's seigniorage revenue has declined by around 5 to 10 percent of the annual federal interest expense over the past 20 years. This long-run decline in seigniorage revenue is largely explained by the rising supply of medium- and long-term Treasury bonds.
- Shakked Noy


