Energy Access and Industrial Specialization
How does access to energy resources shape regional industrial development? In Local Energy Access and Industry Specialization: Evidence from World War II Emergency Pipelines (NBER Working Paper 33721), Jacob Greenspon and Gordon H. Hanson examine this question by studying how emergency pipelines built during World War II influenced regional manufacturing specialization across American counties after the war.
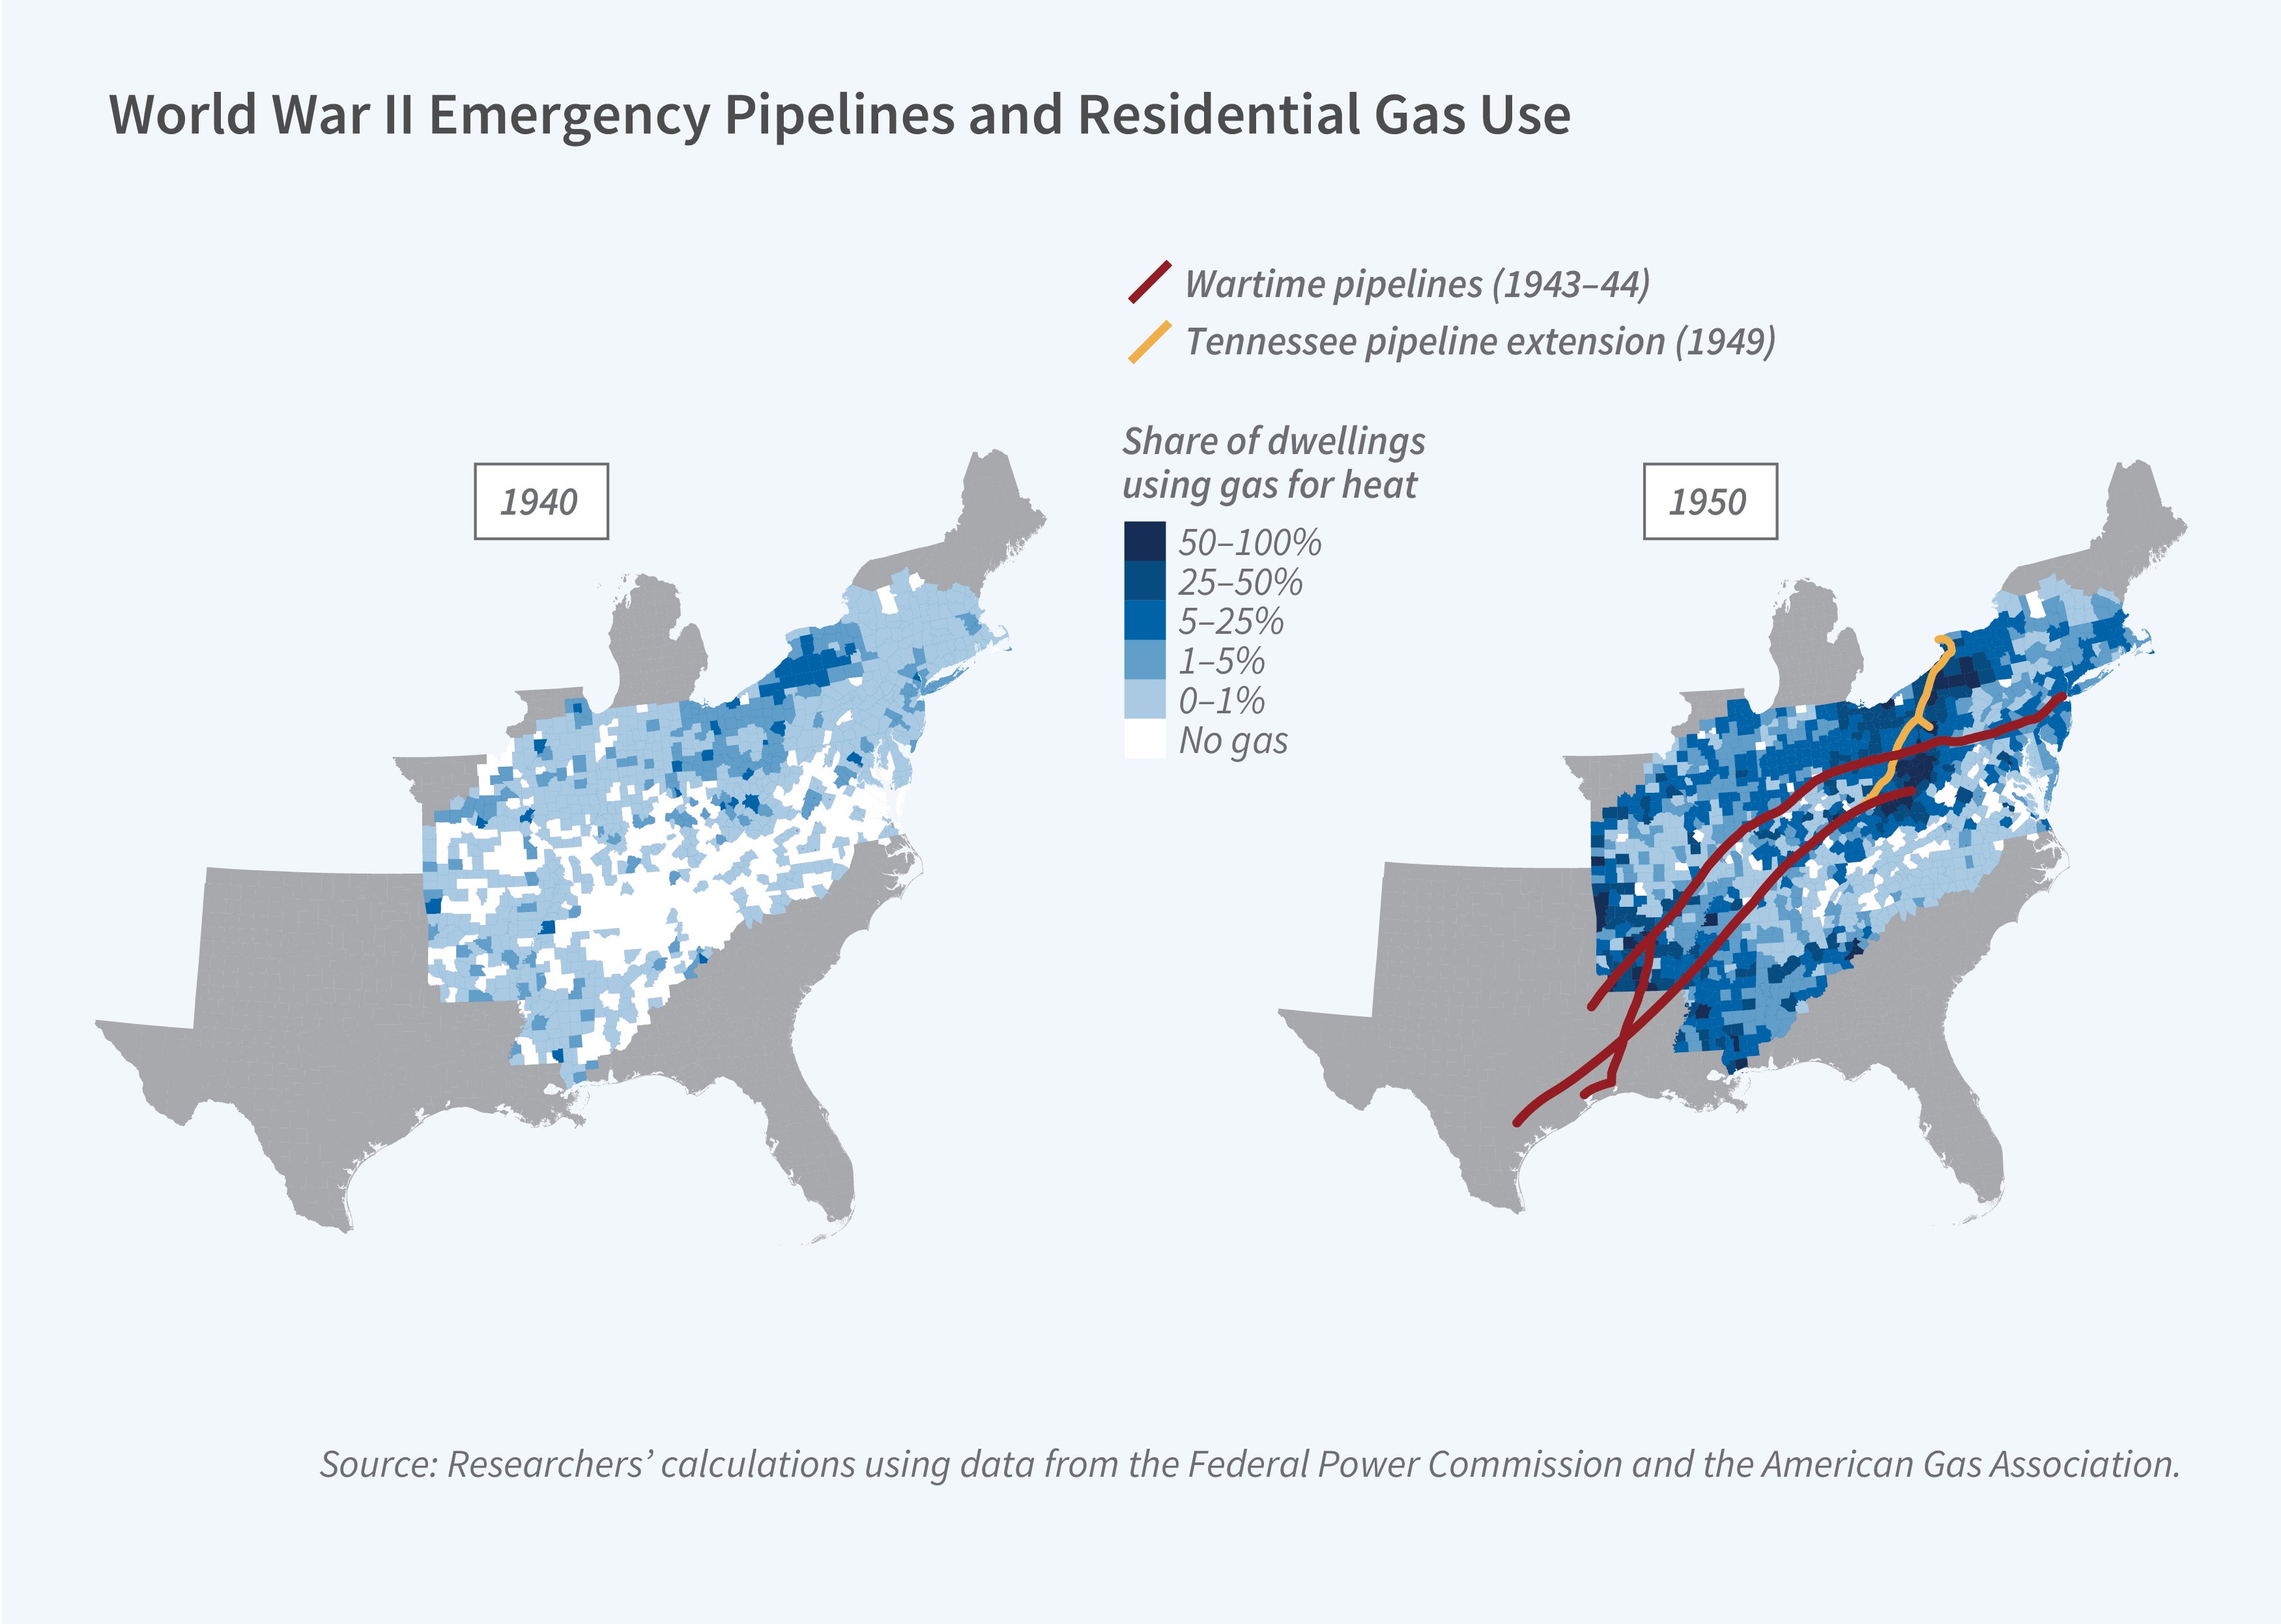
They analyze the impact of pipelines constructed by the US government to transport oil and gas from oil fields in the Southwest to wartime industrial producers in the Northeast. These pipelines were built rapidly along direct paths to minimize the use of scarce wartime construction materials. After the war, the pipelines were converted to supply natural gas to communities along their routes, providing counties close to the pipelines with access to cheaper and more plentiful energy. By 1950, among counties with prewar gas utilities, those located 1 standard deviation farther from the pipelines (71.2 miles) experienced a 3.6 percentage point smaller increase in the share of households using utility gas (relative to a mean of 16 percent), compared to counties situated directly on the pipeline.
The study examines counties within 250 miles of pipeline routes, excluding those in major gas-producing states (Texas, Louisiana, and Oklahoma). Using data on county employment from 1940 to 1997, the researchers measure whether counties that had gas utilities before the pipelines were built, which facilitated local distribution within counties near the pipeline routes, experienced larger increases in energy-intensive manufacturing than similar counties further from these pipelines.
Counties with preexisting gas utilities had significantly different characteristics in 1940 compared to those without such utilities. On average, they had larger populations (approximately 42,000 versus 15,000), lower agricultural employment (28.0 percent versus 51.8 percent), and higher manufacturing employment (20.1 percent versus 11.2 percent). These baseline differences are controlled for to account for any potential confounding effects on postwar growth in energy-intensive manufacturing.
Between 1940 and 1950, counties with better access to pipeline gas saw larger increases in employment within energy-intensive industries. A county located 1 standard deviation closer to a pipeline experienced a 0.5 percentage point increase in its gas-intensive manufacturing employment share (relative to a mean of 4 percent), and a 0.9 percentage point increase in its electricity-intensive manufacturing employment share (relative to a mean of 5.3 percent). These effects intensified over time, reaching 2.6 and 4.0 percentage points, respectively, by the late 1960s. The researchers explain that the growth in electricity-intensive employment likely resulted from pipeline access enabling increased local electricity generation at low costs by gas-fired power plants.
These impacts persisted for decades but at different rates by industry type. For industries intensive in direct gas use, the effects lasted until the mid-1980s. For electricity-intensive industries, the employment advantages endured through at least the late 1990s. The difference is a result of federal price regulations on interstate gas shipments during the energy crisis of the 1970s. These regulations led producers to divert supplies from national to local markets, disrupting gas-intensive industries in gas-importing states. Electric utilities could more easily substitute coal for natural gas, leaving electricity-intensive industries relatively insulated from these regulatory shocks.
Researcher Gordon H. Hanson acknowledges research support from the Generation Foundation.


