Patterns of Inventor Employment and Creative Output
Many analyses of economic growth have focused on presumably relevant ratios in the innovation pipeline, such as research and development spending as a share of GDP and the proportion of the labor force employed in the research sector. Recent data from the US raise questions, however, about the links. Total factor productivity growth has slowed markedly since 2005 even though the share of inventors in the labor force has grown by over 70 percent.
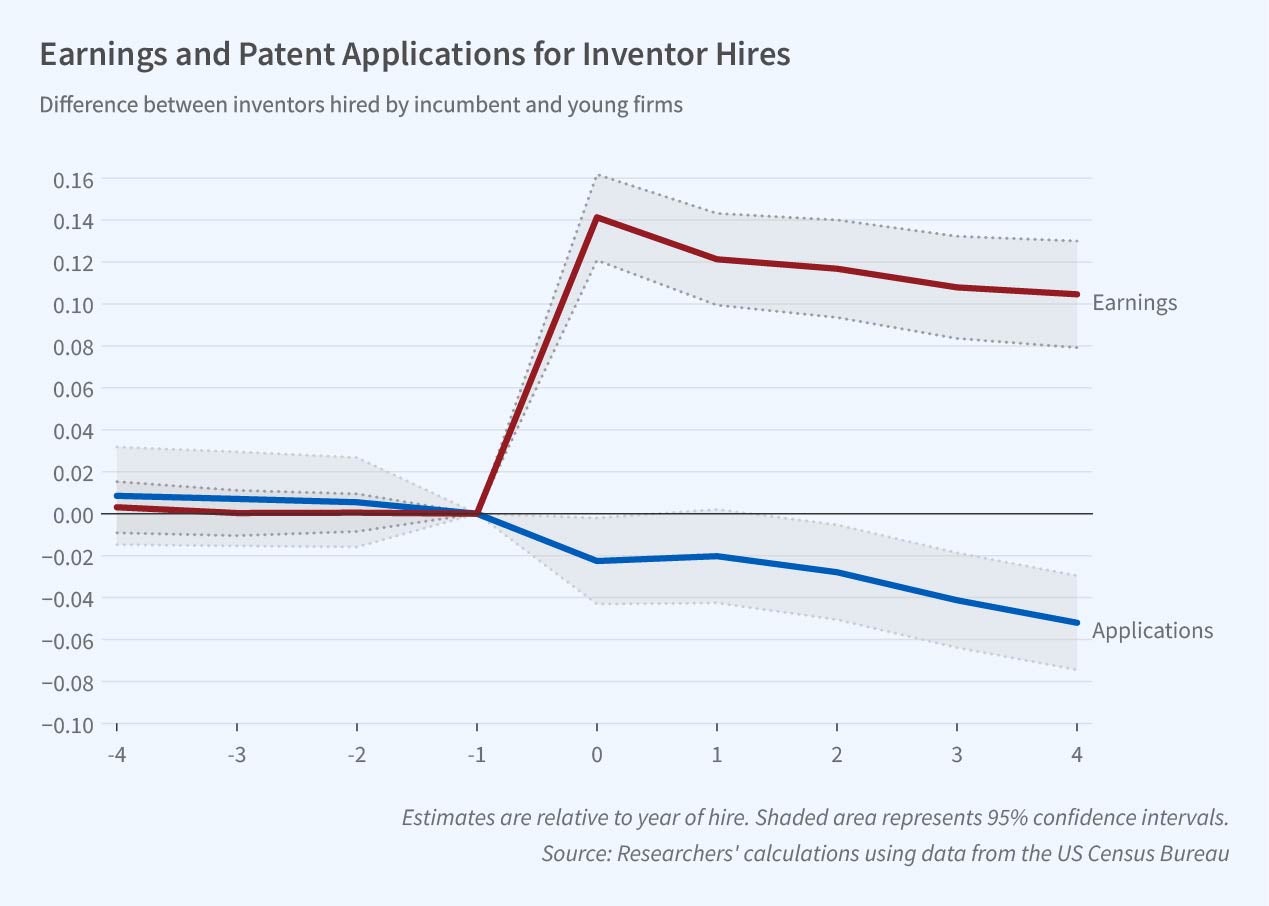
In Where Have All the “Creative Talents” Gone? Employment Dynamics of US Inventors (NBER Working Paper 31085), Ufuk Akcigit and Nathan Goldschlag find that innovative capacity also depends upon the distribution of inventors across firm types. Incumbent firms, defined as those over 21 years old with at least 1,000 employees, may shift their inventors from searching for breakthroughs to pursuing discoveries that will defend their competitive position. The researchers find that since 2000, the share of US inventors working for incumbent firms has increased. Comparing inventors hired by young firms, those five years or younger, to inventors hired by incumbents, the researchers find that incumbent hires experience 12.6 percent higher earnings, while innovative output, measured by patents granted, is more than 6 percent lower. Those patterns do not appear to be driven by older inventors moving to incumbent firms, occupational differences in young and incumbent firms, systematic age or life-cycle differences between young and incumbent firm hires, or differences in hiring during the Great Recession.
Since 2000, the share of US inventors working for older, larger firms has increased. Inventors hired by those firms have higher earnings and less inventive output than those hired by young firms.
The results come from data on more than 760,000 US inventors named on 3.6 million patents issued by the US Patent and Trademark Office between 2000 and 2019. A measure of inventive productivity was developed using the number of patents granted to an inventor weighted by the number of citations of the patent in the first five years after it was granted.
To create their inventor employment history database, the researchers linked the patent office’s data to the US Census Bureau’s anonymized individual-level identifiers. Individual employment and quarterly earnings information was then drawn from the quarterly job-level observations in the unemployment insurance records of the 45 states covered by the Census Bureau’s Longitudinal Employer-Household Dynamics program. Firm age, size, and inventor entrepreneurship were added by linking to the Longitudinal Business Database, the Census Bureau’s frame of all nonfarm employer businesses. The occupations of over 100,000 inventor jobs were determined by matching detailed inventor records with survey responses from the American Community Survey.
Over 60 percent of the inventors in the sample were aged 36 to 55. About 55 percent of those in the sample held jobs at incumbent firms. Just 10 percent of inventors worked at firms less than six years old, and 9 percent started a business during the sample period. Roughly 12 percent of inventors were women, and 27 percent were born outside the United States.
The share of inventors employed by incumbent firms rose from 48.9 percent in 2000 to 57.3 percent in 2016. Inventor hire and separation rates fell from about 7 percent in 2000 to less than 4 percent in 2016, while the comparable rates for noninventors were stable.
The data also suggest that inventors became less entrepreneurial. The share of inventors at young firms was 14 percent in 2000 and 7.5 percent in 2016. In addition, the share of inventors starting new firms also fell by roughly 44 percent, or nearly 0.3 percentage points, during the sample period.
On average, inventors working for incumbent firms had more patent applications, but fewer citations. The researchers calculate that the shift in inventor share from young to incumbent firms is associated with almost 6 percent more patent applications but 5.3 percent fewer patent citations.
— Linda Gorman


