The Risks and Rewards of Homeownership
The US government has long promoted homeownership through subsidies and tax incentives, viewing it as both socially beneficial and a primary pathway to individual wealth accumulation. For the middle class—those in roughly the middle three-fifths of the wealth distribution—housing wealth remains the most important source of financial security and net worth. Homeownership is also widely believed to provide access to better neighborhoods and higher-quality schools. Yet despite these advantages, homeownership entails significant risks. Homeowners are exposed to housing market downturns that can rapidly erode equity, as well as to income and employment shocks that can compromise their ability to meet mortgage obligations. Such disruptions can lead to delinquency and, in severe cases, the loss of one’s home. Although these downside risks are well recognized, empirical evidence on their long-term magnitude and consequences remains limited.
Our collective research agenda has sought to understand the barriers to homeownership and to quantify the risks that accompany it. Households must weigh numerous factors when deciding whether to buy a home, and there are constraints that may limit the choices of many low-income families. For instance, saving for a mortgage down payment may require substantial sacrifices in current consumption, while also limiting both the size of the home purchased and the quality of the neighborhood. After purchasing a home, even modest declines in local house prices can erode accumulated equity and reduce both wealth and financial flexibility. Employment or income shocks can lead to missed mortgage payments, sharp declines in credit scores, and, in the most severe cases, foreclosure. The potential consequences of foreclosure extend far beyond the immediate loss of housing and equity, damaging credit, constraining access to future borrowing, and undermining long-term financial stability.
The housing cycle can further amplify homeowner vulnerability during economic downturns. In 2016, we investigated this issue using a large sample of credit data on individual homeowners who purchased or refinanced during the 2000s housing boom.1 The findings suggest that higher-risk borrowers entered the owner-occupied housing market in greater numbers as credit availability expanded. Borrowers who purchased homes at the 2006 market peak subsequently experienced the highest foreclosure rates. Figure 1 presents estimates of the probability of receiving a foreclosure notice by mortgage origination year, (relative to 2008). The top line presents unconditional estimates, the middle line controls for detailed mortgage, borrower, and housing characteristics, and the bottom line further accounts for changing economic conditions during the foreclosure crisis. Notably, foreclosure risk was highest for mortgages originated in 2006. While negative equity, as captured by our controls for economic conditions, explains part of this risk, it accounts for only a small part. The remaining variation largely reflects observable pre-origination borrower risk and unobserved factors that are difficult for lenders to identify or mitigate at origination, such as risk of future job loss.
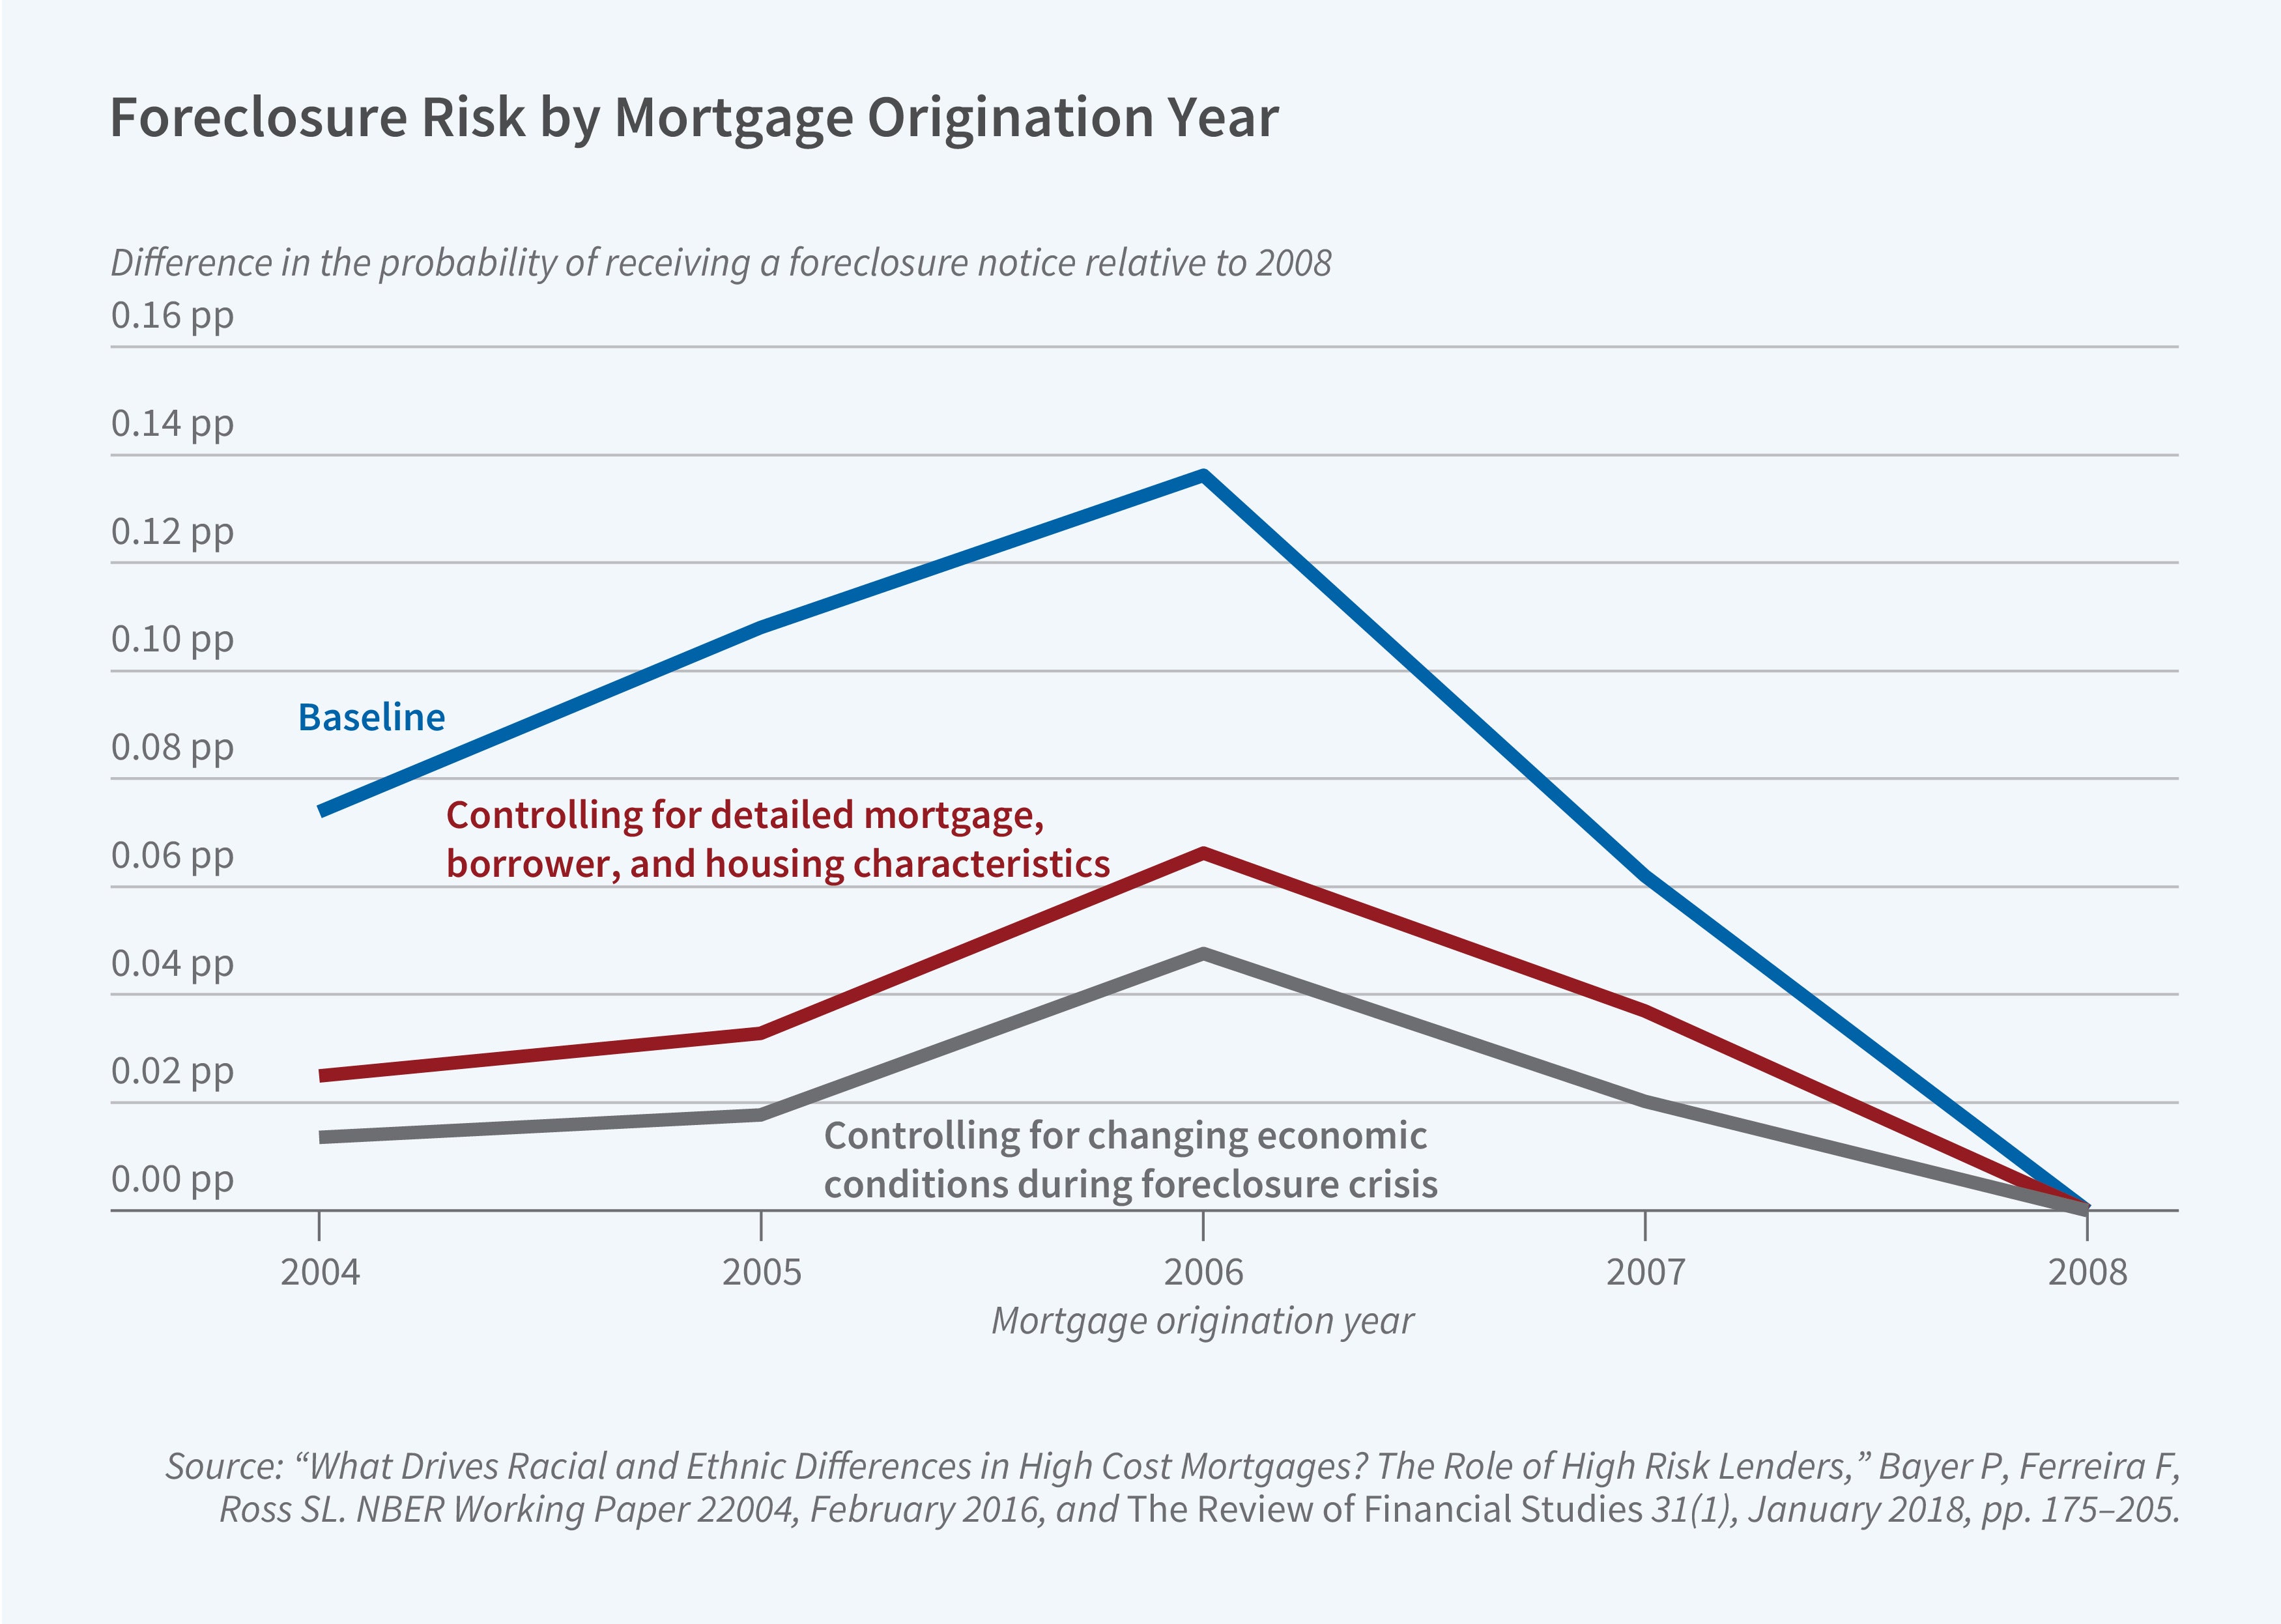
Our analysis suggests that the worse foreclosure outcomes for those who purchased at the market peak were driven primarily by underlying borrower risk rather than by exposure to negative equity during the downturn. This led us to "call into question the idea of encouraging homeownership as a general mechanism for reducing racial disparities in wealth," noting that "to the extent that increases in homeownership are driven by the entry of especially vulnerable households into the owner-occupied market, such a push may backfire, leaving vulnerable households in a difficult financial situation and adversely affecting their wealth and creditworthiness for years."
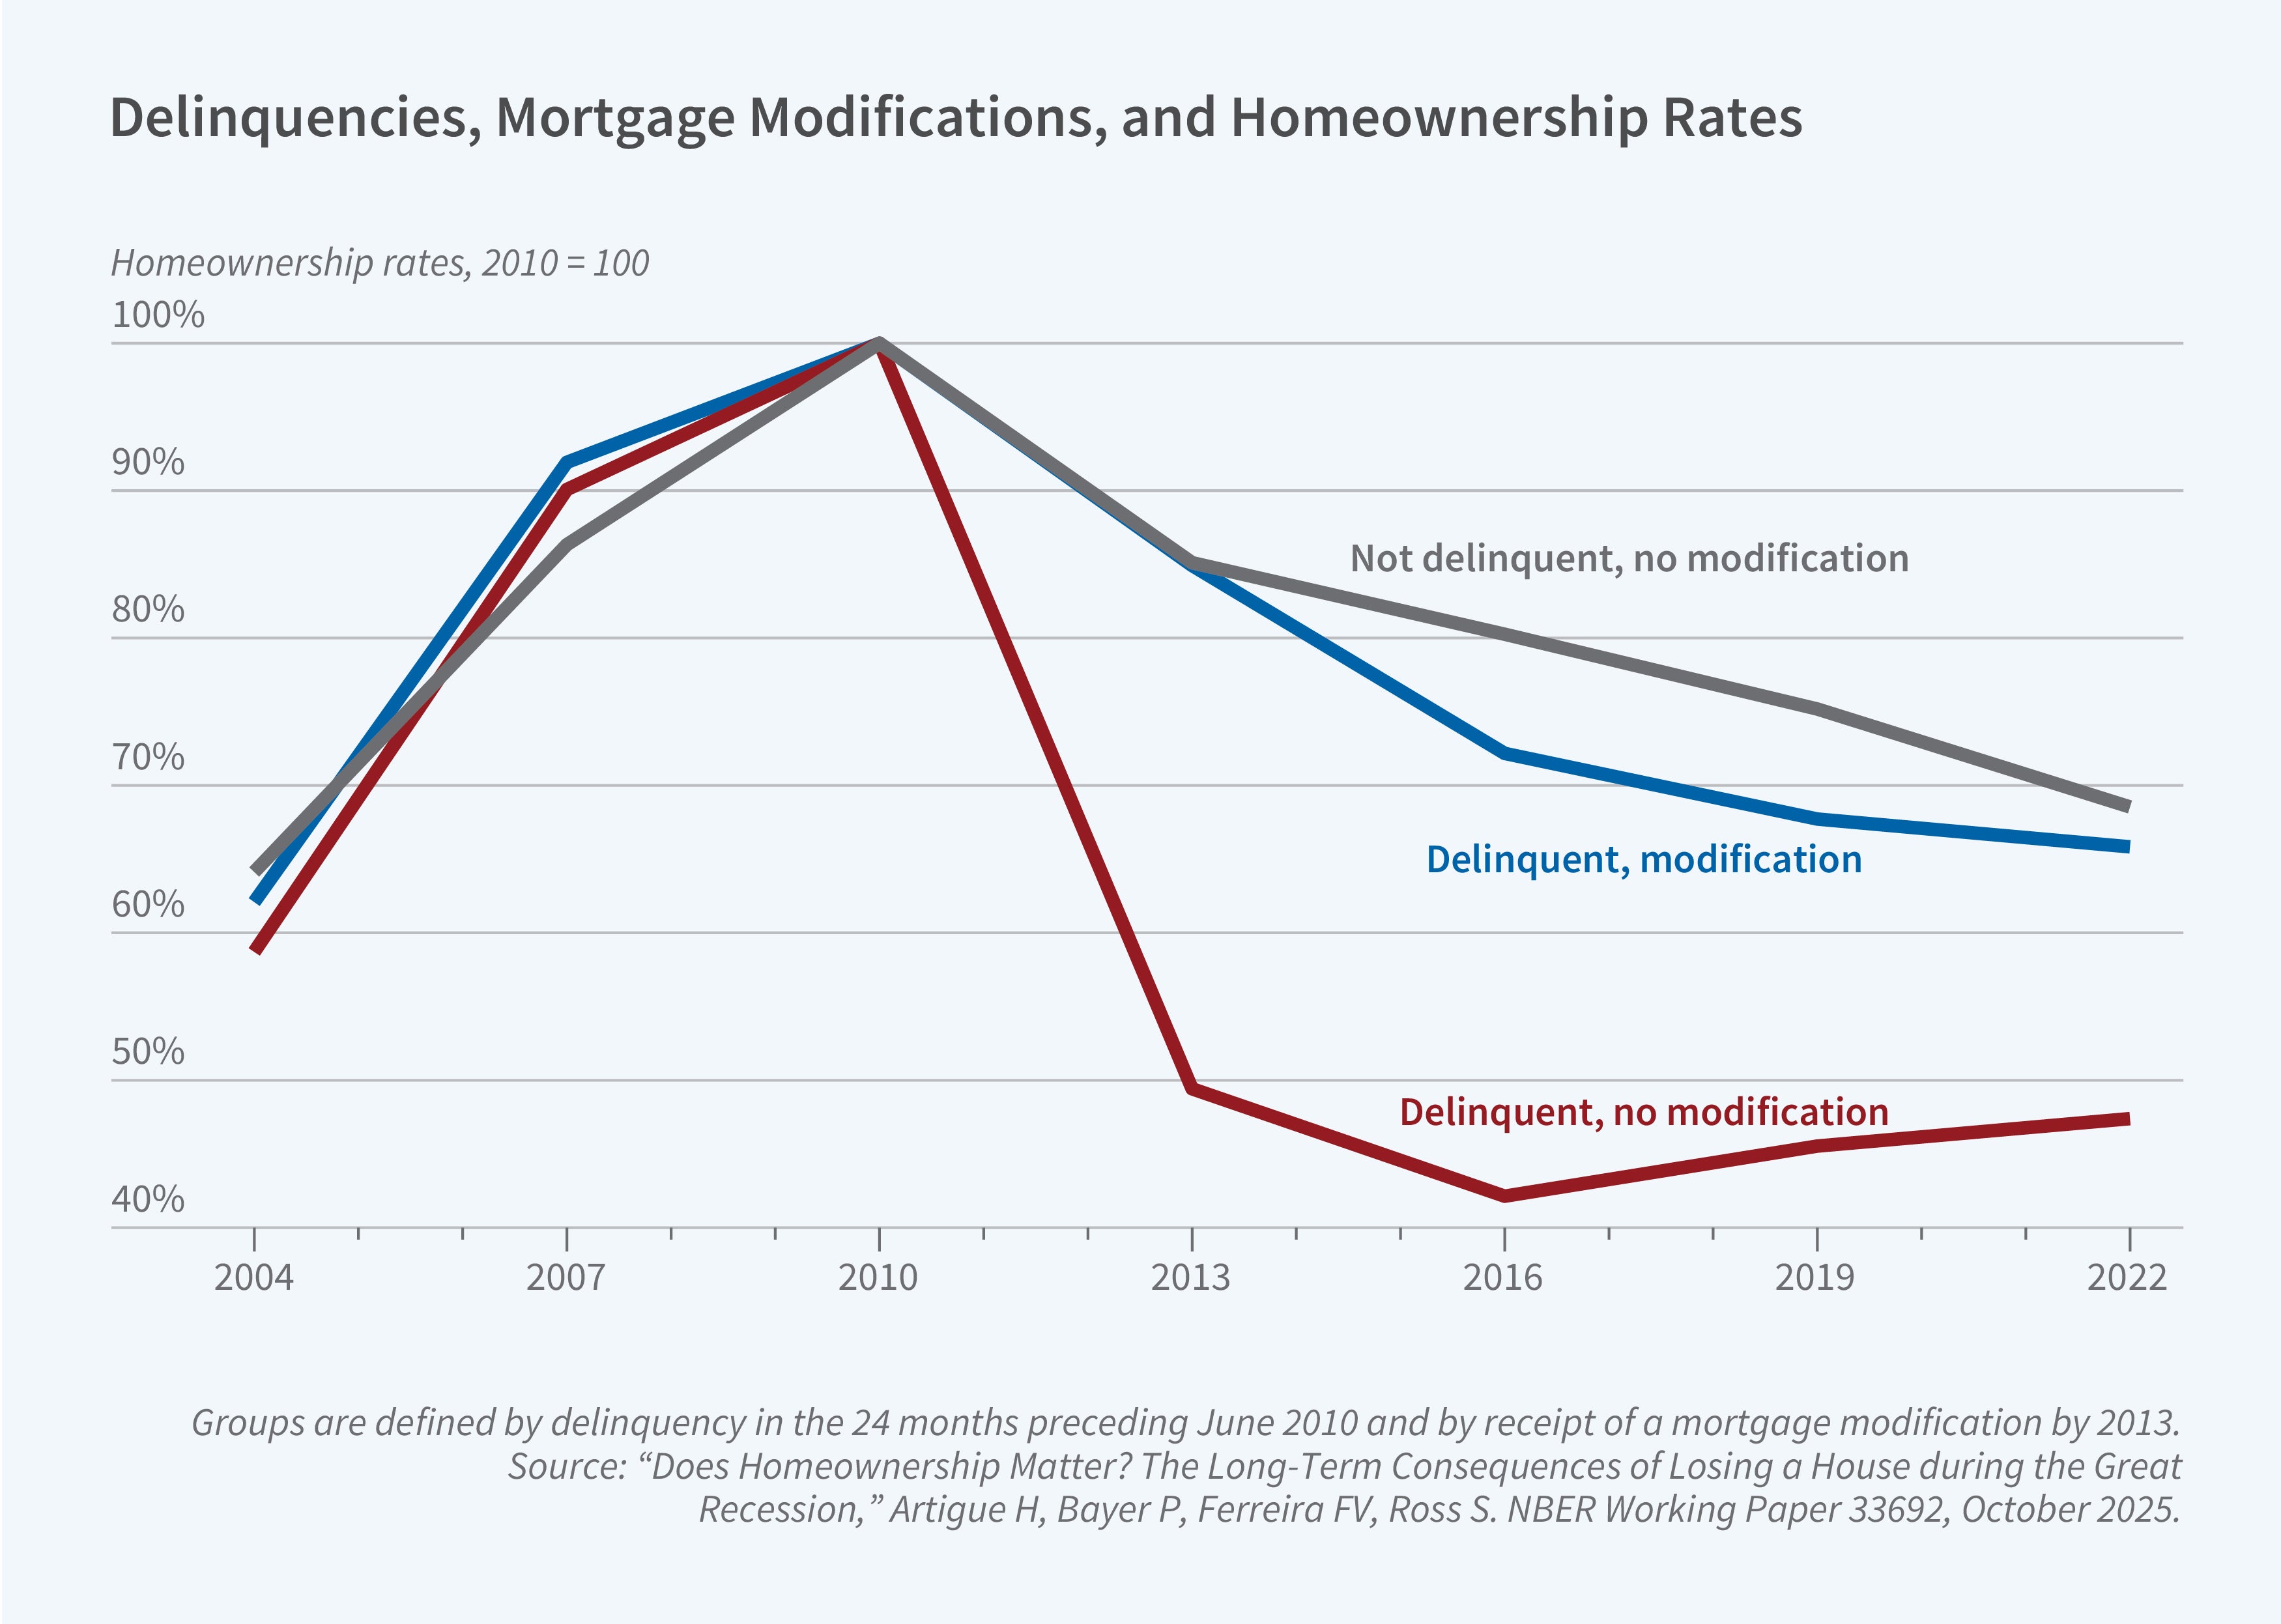
However, these concerns were based on limited evidence about the longer-term effects of income shocks and home loss. In recent work with Heidi Artigue, we examine the long-run consequences of losing one’s home during the Great Recession. Building on prior studies, we extend linked mortgage–credit report data to track outcomes through 2022.2 Our analysis focuses on households that experienced severe mortgage delinquencies between 2008 and 2010 as a proxy for those experiencing financial distress due to income shocks. We use receipt of a mortgage modification (i.e., a reduction in payments or balances and a reset of the payment schedule) as the treatment variable. By comparing delinquent borrowers who received a modification with similar borrowers who did not, our design isolates the effect of home loss from the broader effects of income shocks. We validate this approach by demonstrating parallel pre-trends across a wide range of credit outcomes between the two groups.
Figure 2 shows that between 2010 and 2013, a 35-percentage-point gap emerged in home retention between borrowers who received a modification and those who did not. Borrowers who received a modification quickly returned to homeownership rates that were similar to those of borrowers who avoided severe delinquency altogether. These differences persisted over the next decade, with an 18-percentage-point gap still present in 2022. Consistent with our earlier speculation, households experiencing significant negative shocks during downturns face a substantial risk of losing their homes and lasting barriers to re-entering homeownership.
Beyond homeownership, however, other long-term financial consequences were less visible than we expected. Figure 3 shows that credit scores for both subsamples followed parallel paths before 2010, declined sharply during the crisis, and recovered by 2022, with minimal differences between the treatment and control groups over the entire period. Figure 4 presents similar evidence for consumption, measured by credit card payments. Both groups experienced significant declines in credit card payments during the recession, bottoming out around 2013 and recovering by 2022. Similar patterns are found for credit card balances, auto loans, and other measures. Thus, households experiencing severe delinquencies largely recovered in both credit and consumption measures, regardless of whether they lost their homes. We also find no long-term differences in neighborhood quality among those who lost homes versus those who retained them.
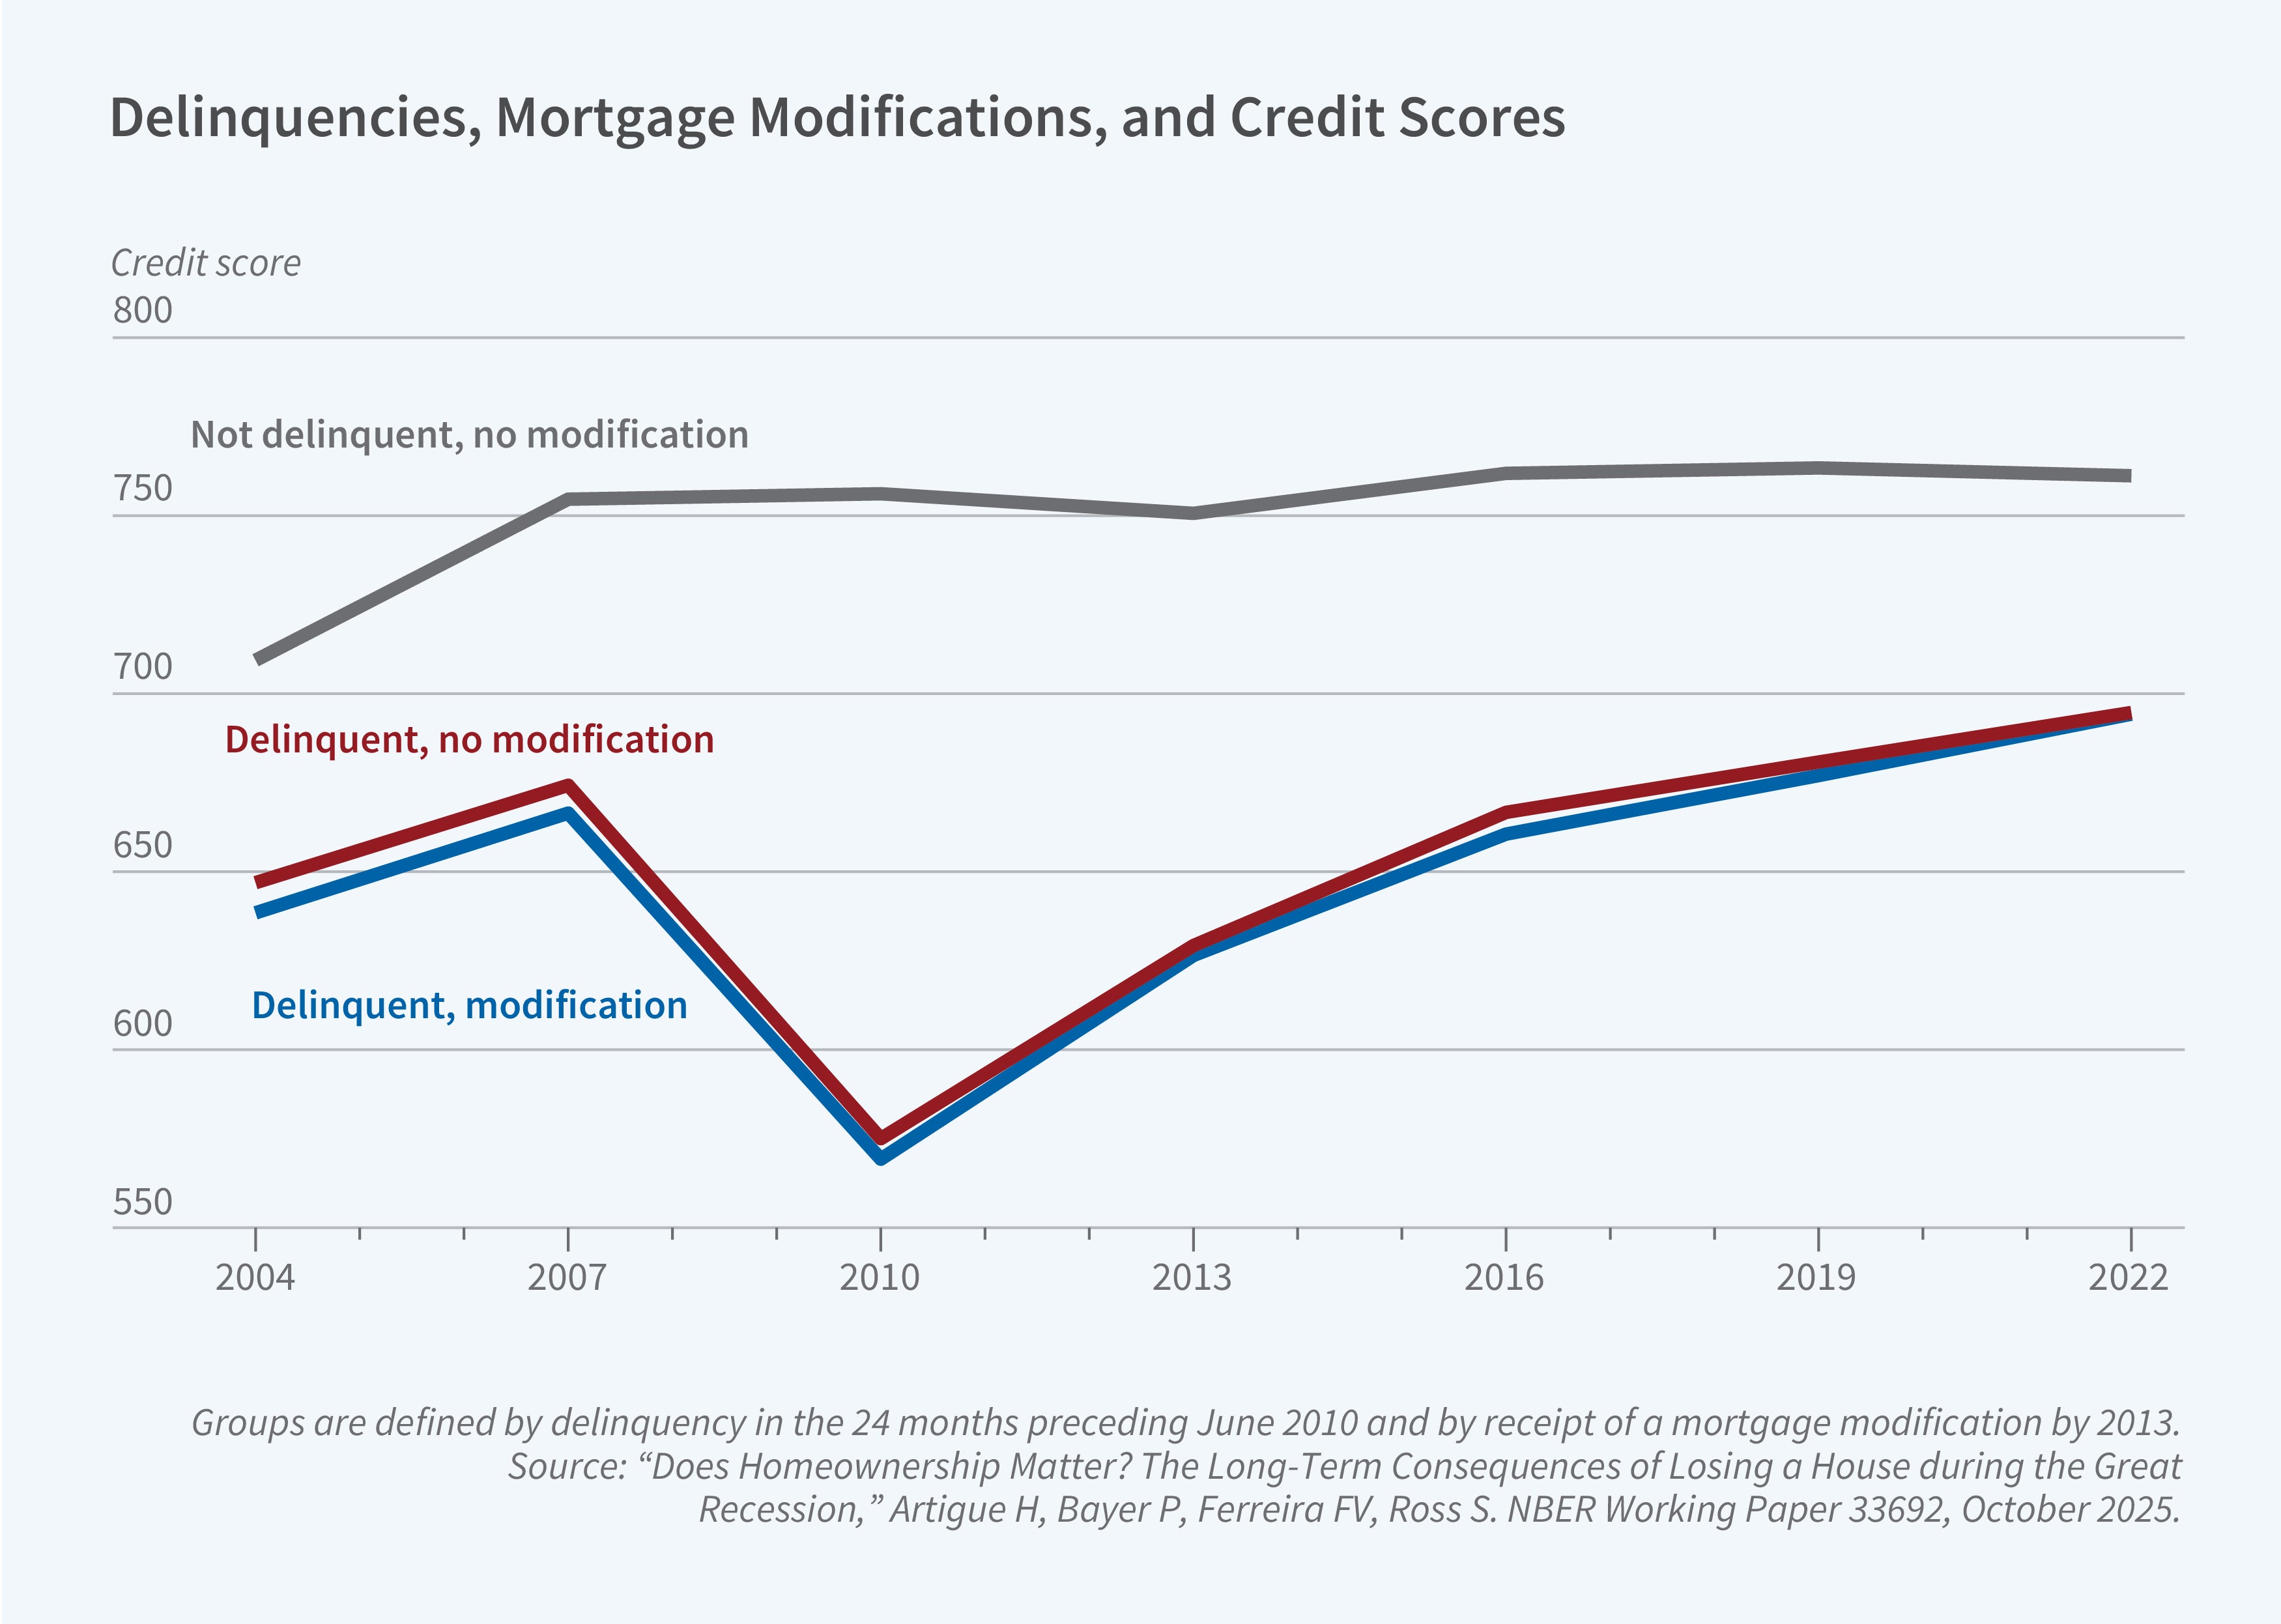
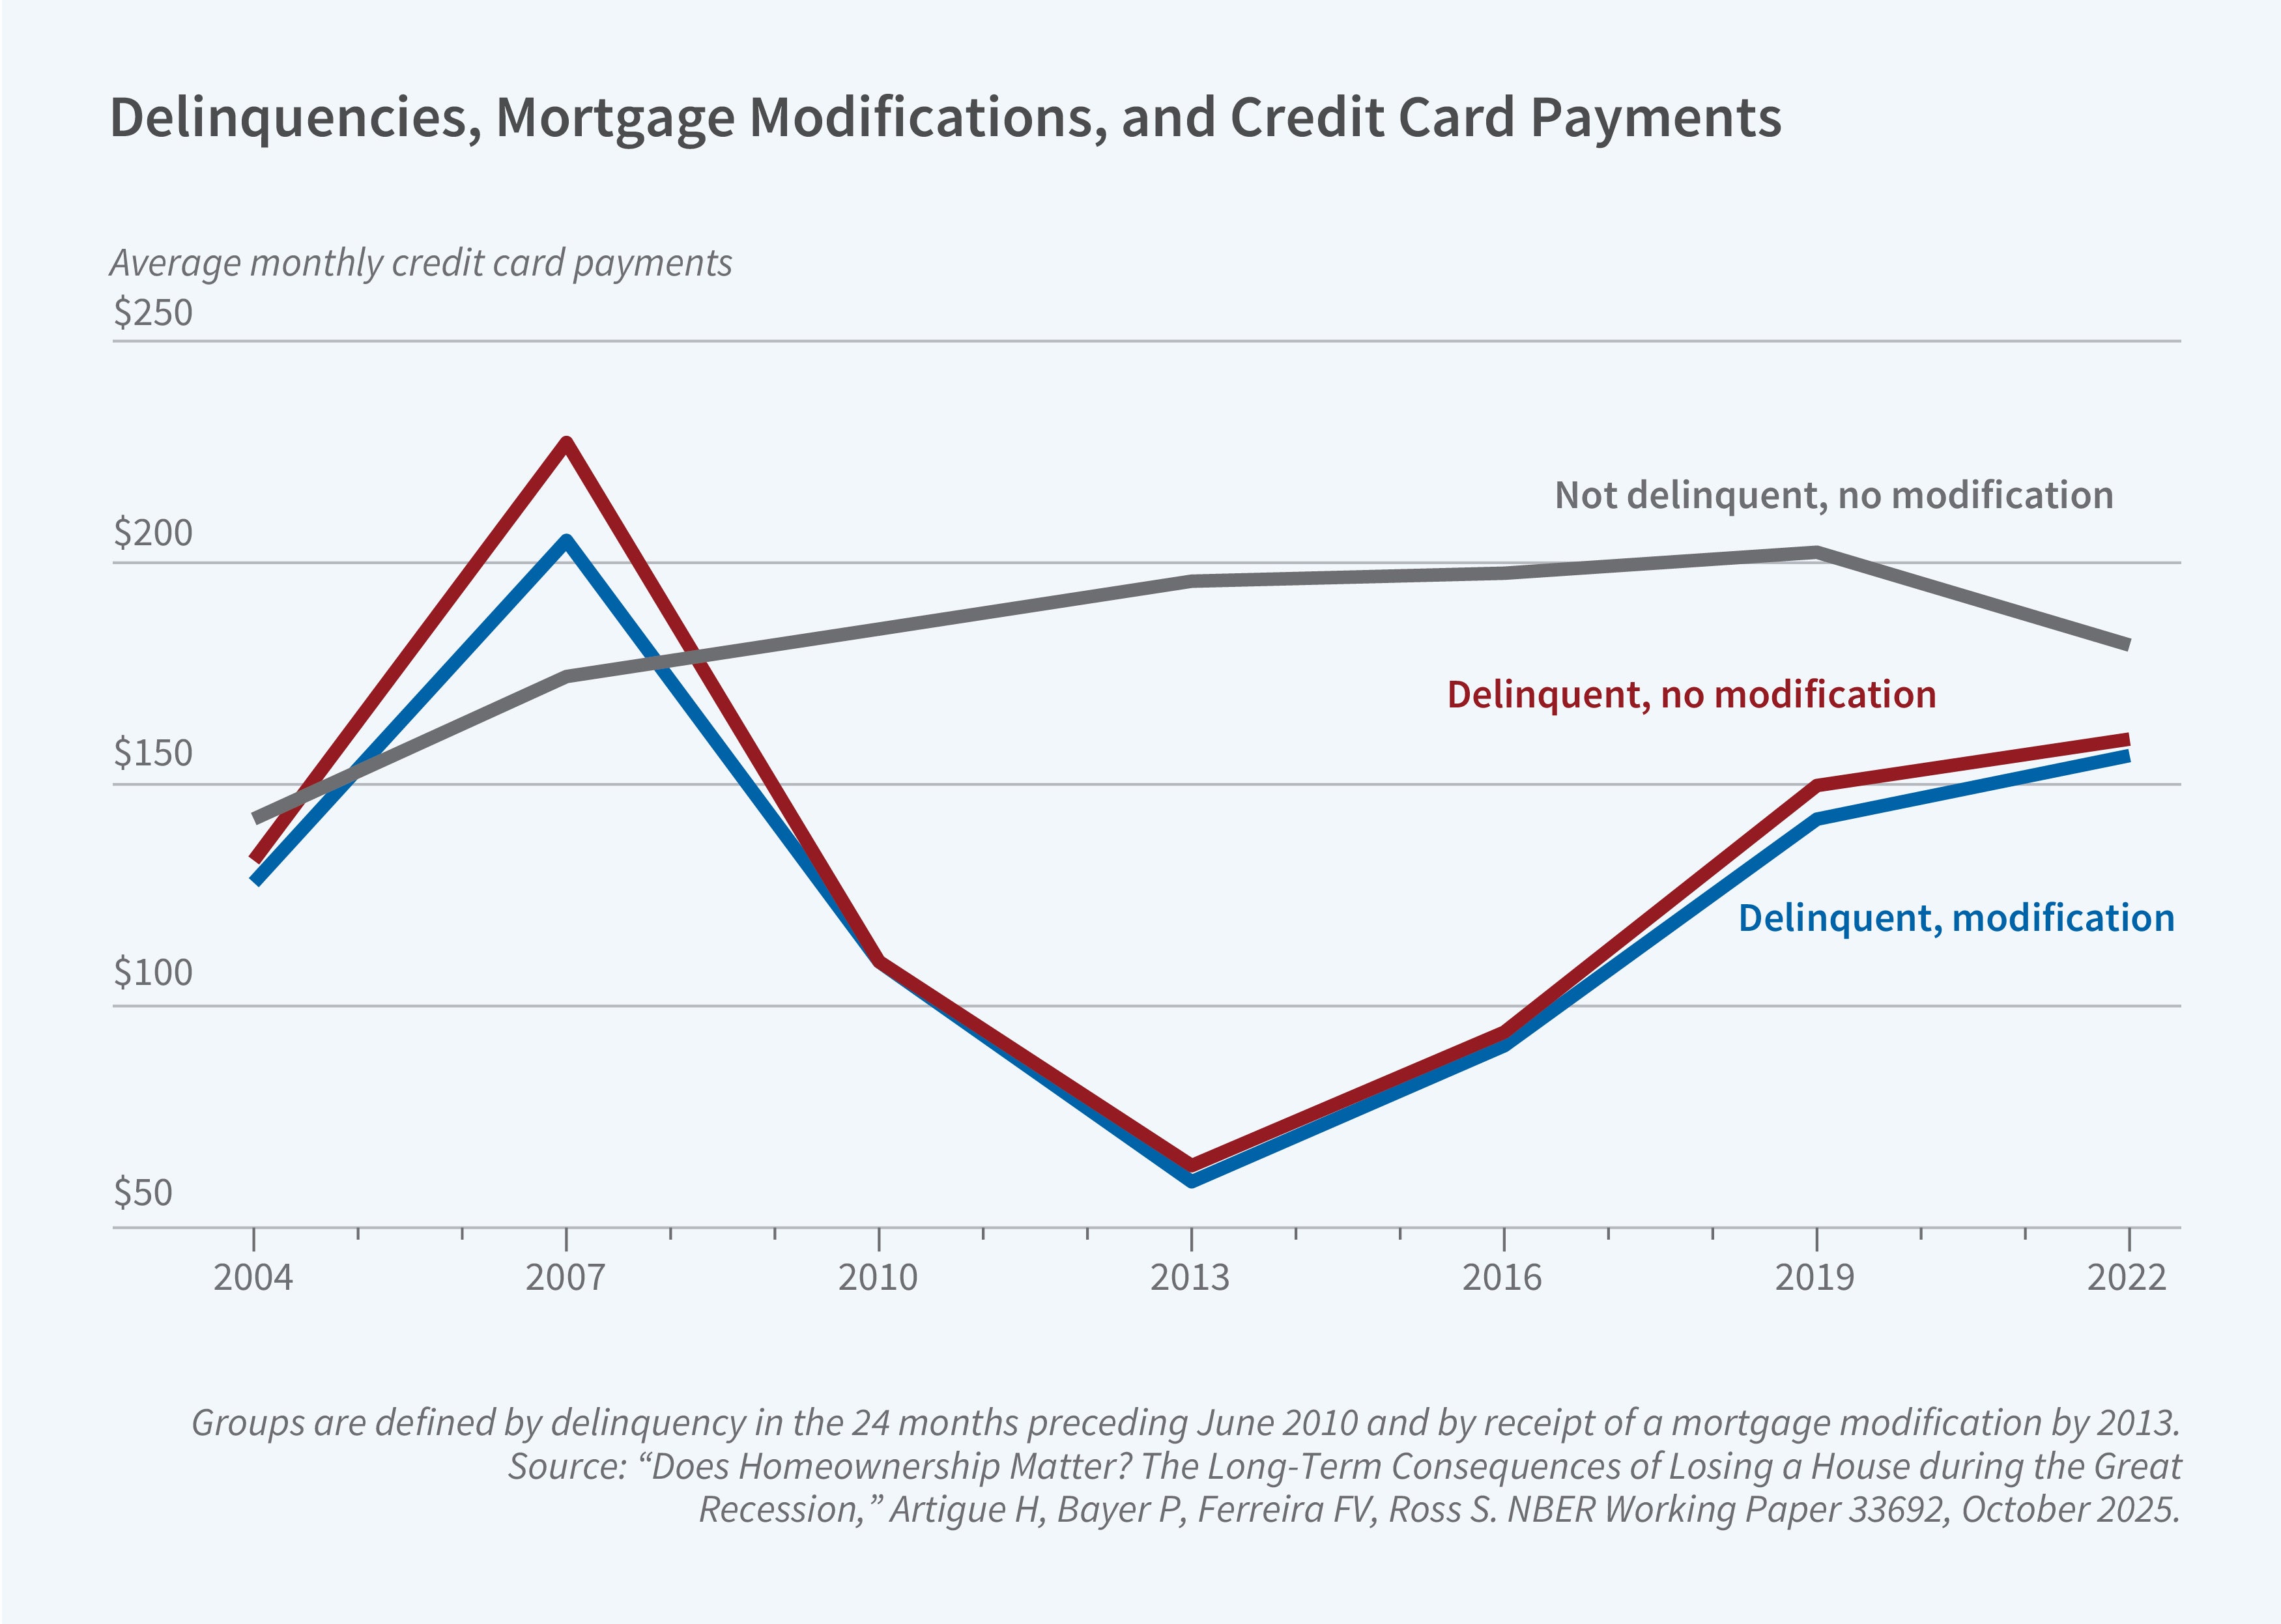
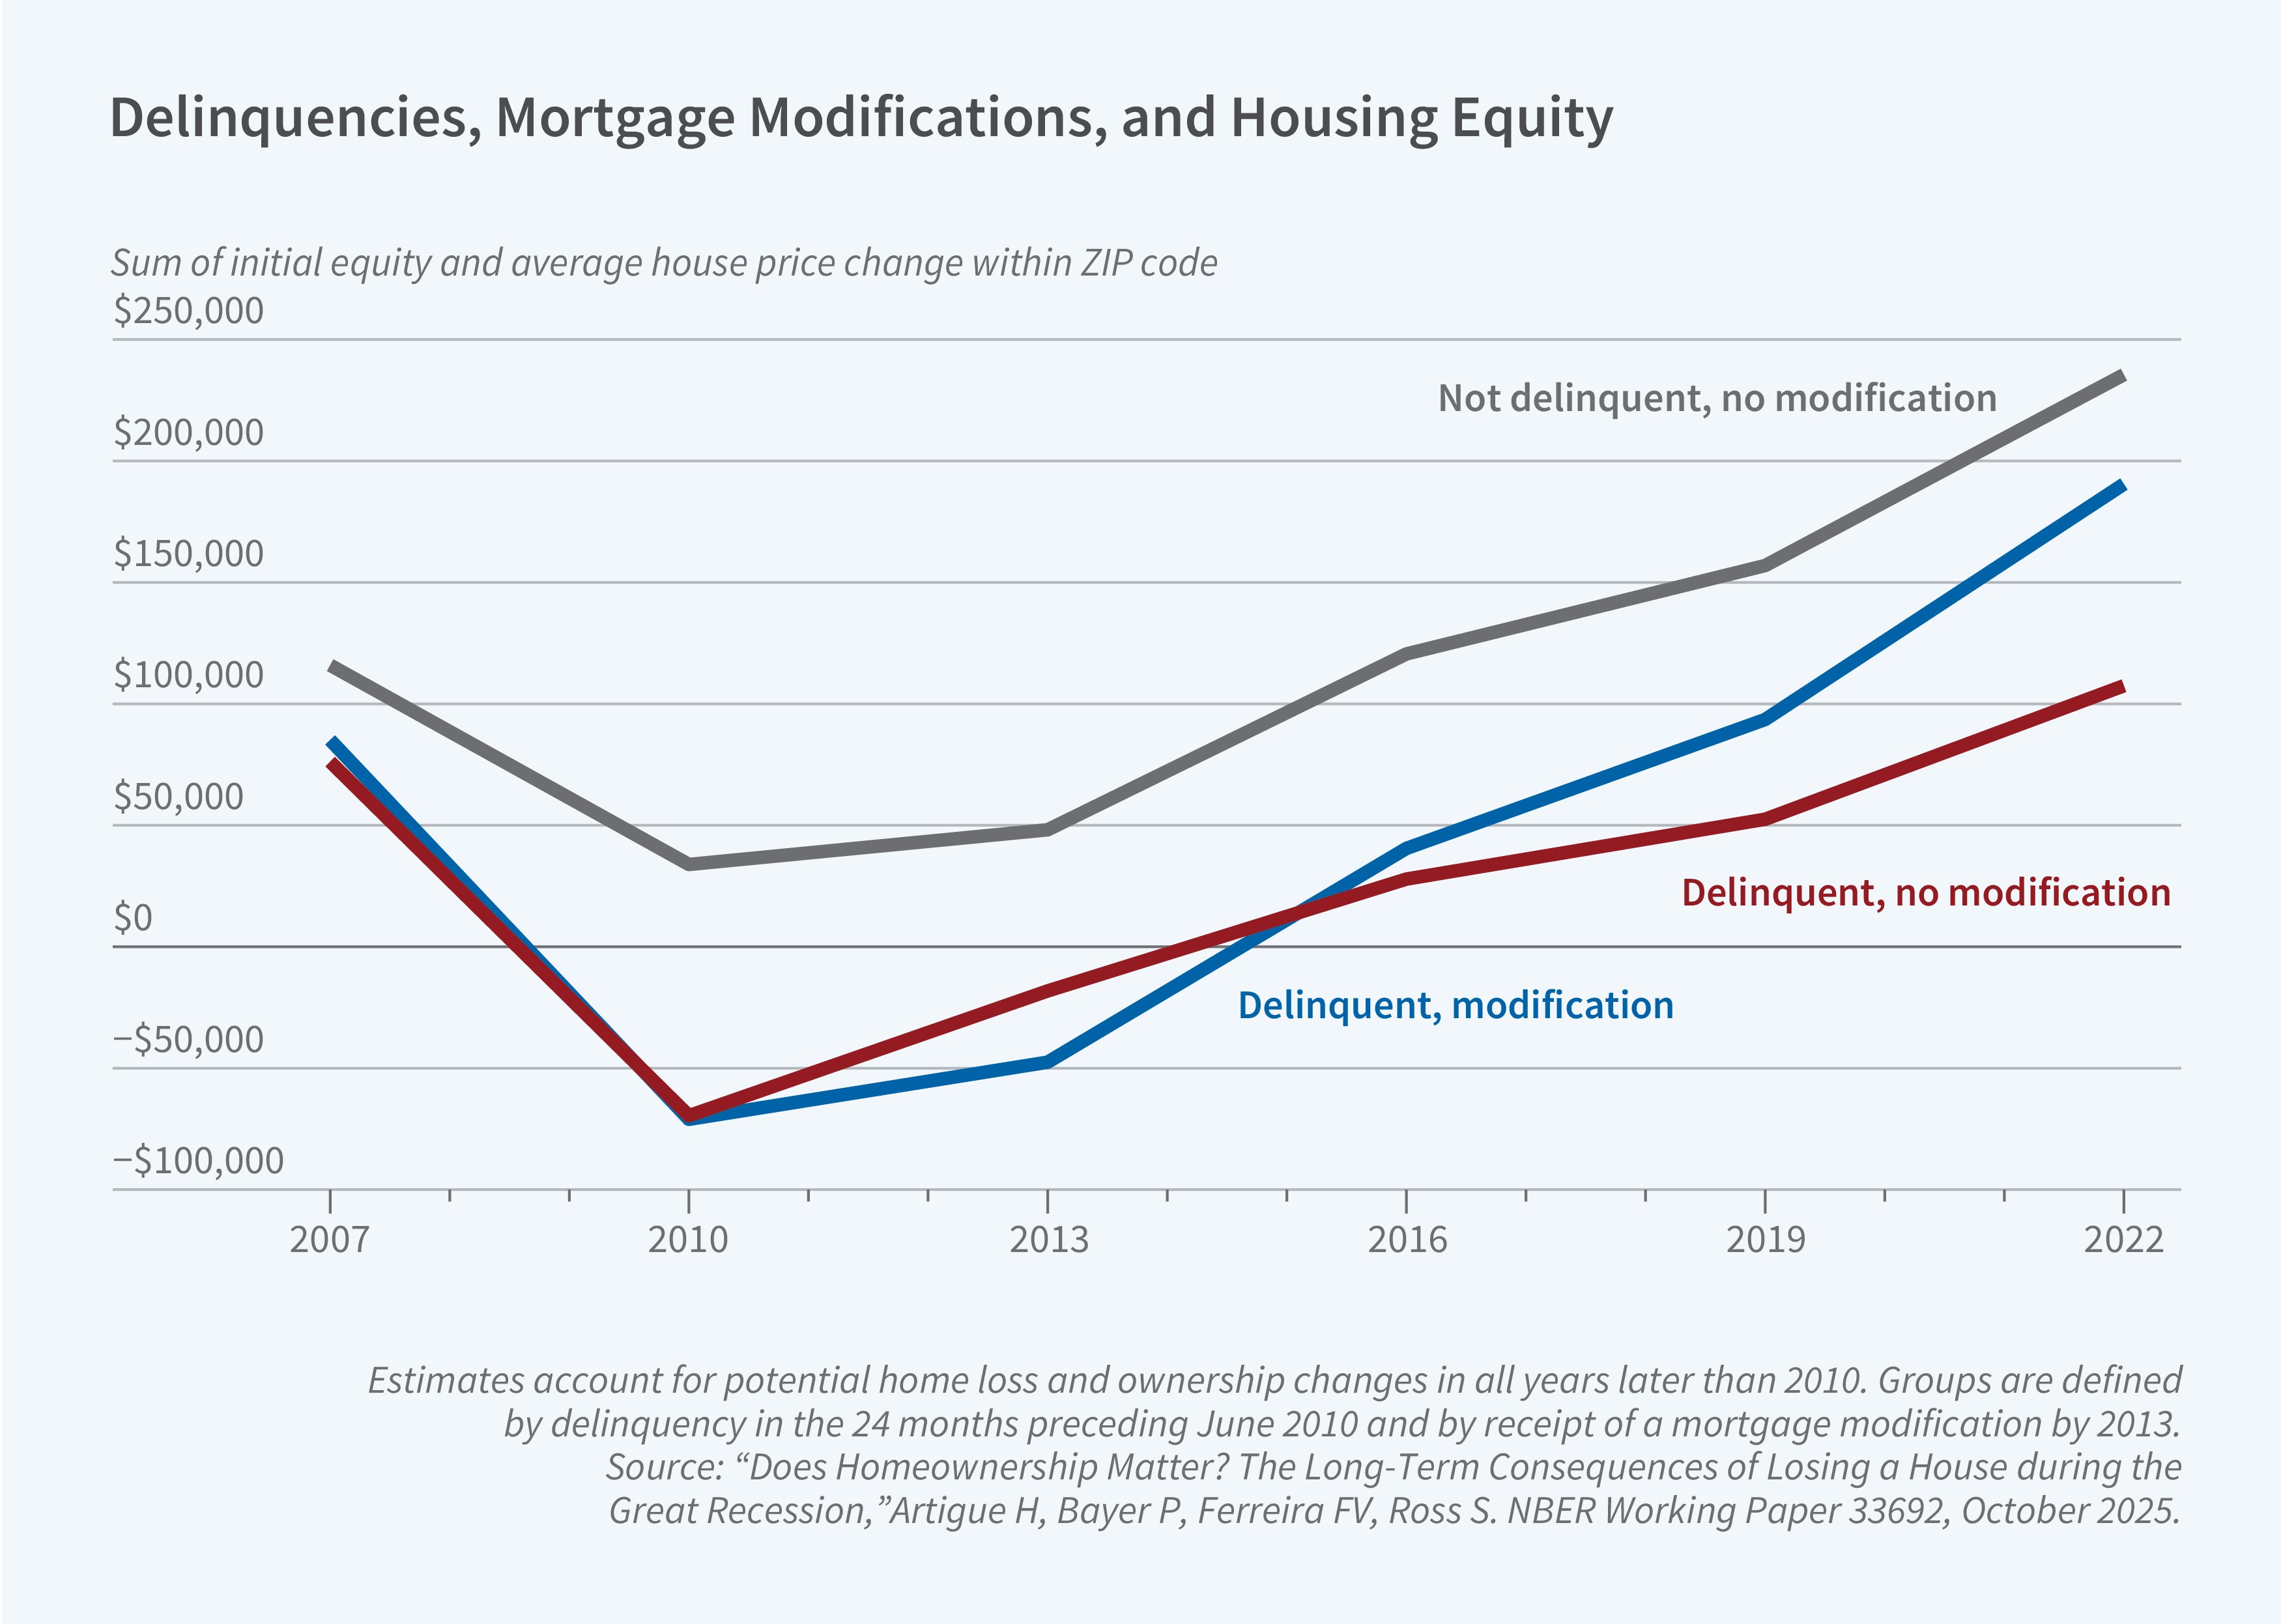
Figure 5 presents our estimates of changes in housing wealth. On average, delinquent borrowers held about $70,000 in equity in 2007, all of which was lost by 2013 among those who lost their homes. This pattern underscores the substantial risk that negative income shocks pose to homeowners through the erosion of both down payments and accumulated equity. Although part of these losses likely reflect temporary, bubble-driven price gains, the average down payment among homebuyers who later became severely delinquent was $43,000, suggesting that a meaningful share of the lost equity represented real assets contributed at purchase. By 2022, however, housing equity had rebounded substantially: borrowers without a modification held more than $100,000 in equity on average, while those with a modification held close to $200,000. Thus, despite their earlier vulnerability, these delinquent borrowers were, on average, financially better off in the long run than comparable individuals who never entered homeownership, given the strong recovery in housing prices over the subsequent decade.
Our findings to date offer a nuanced view of the risks and rewards of homeownership during economic downturns. Vulnerable households face substantial short-term risks, including exposure to income shocks, loss of equity, and financial stress, but these losses can be offset by the potential for long-term capital gains. Importantly, even households that lost their homes during the Great Recession did not experience persistent deterioration in broader financial outcomes, suggesting a degree of resilience that tempers the conventional view of homeownership risk.
In current research with Stephanie Grove that has not yet been released, we examine the effects of the post–Great Recession tightening of mortgage credit.3 Preliminary analysis suggests that this contraction may have contributed to sharply reduced homeownership rates for many individuals in their twenties and thirties, delaying the natural transition into homeownership relative to earlier cohorts. The observed decline in homeownership has been especially pronounced among households in the middle of the income and education distributions (i.e., those with high school rather than college degrees). As a result, many young Americans may have experienced a lasting reduction in wealth accumulation, with significant implications for their long-term economic wellbeing and inequality within and across cohorts.
Taken together, our results underscore the importance of striking a careful balance between expanding access to mortgage credit and maintaining financial stability. Excessive credit restriction can exclude younger and middle-income households from the primary channel of wealth building in the United States, while overly permissive lending can expose vulnerable borrowers to unsustainable risks. Ensuring that mortgage markets remain both accessible and prudent is essential to preserving homeownership as a cornerstone of economic opportunity rather than a source of financial vulnerability.
Endnotes
“The Vulnerability of Minority Homeowners in the Housing Boom and Bust,” Bayer P, Ferreira FV, Ross SL. NBER Working Paper 19020, February 2015, and American Economic Journal: Economic Policy 8(1), February 2016, pp. 1–27.
“Does Homeownership Matter? The Long-Term Consequences of Losing a House during the Great Recession,” Artigue H, Bayer P, Ferreira FV, Ross SL. NBER Working Paper 33692, October 2025.


