Firms’ Discount Rates and Investment
Discount rates play a key role in firms’ investment decisions. In standard theory and in practice, firms undertake an investment project if the expected return of the project exceeds a required return, which is known as the “discount rate” or “hurdle rate.” A large body of research has studied how firms should set discount rates, but relatively little work has explored how real-world discount rates change over time and whether discount rate dynamics shed light on the behavior of firms and the aggregate economy.
In a recent set of papers, we analyze new hand-collected data on the discount rates used by large corporations. The data confirm that discount rates determine investment. But the real-world behavior of discount rates deviates substantially from standard theory. Discount rate dynamics help us understand several economic phenomena, including long-run “missing investment,” monetary non-neutrality, business cycle comovement, capital misallocation, and the real impact of sustainable investing.
Standard Theory
The standard view is that firms should base their discount rates on the cost of capital. This approach is widely taught to business practitioners since, in standard models, one-to-one incorporation ensures that firms maximize their value. The assumption of one-to-one incorporation is prevalent among policymakers (including those at central banks and treasuries) and in academic fields studying firm behavior, such as finance, macro, labor, and industrial organization. In all these fields, shocks to the cost of capital—such as shocks to stock prices, monetary policy, and credit supply—directly change firms’ discount rates and thereby investment.
However, there are conceptual reasons why discount rates may deviate from the cost of capital. First, the cost of capital is unobserved, depends on complex risk adjustments, and needs to be estimated using financial market models and subjective estimation choices. Hence, the “perceived cost of capital,” as determined by firms, may deviate substantially from the true cost of capital. Second, firms have full discretion over their discount rate. They may consciously not equate their cost of capital and discount rate. For instance, firms may keep their discount rate constant for long periods to maintain clear and stable investment rules.
Seminal surveys, including those cited in Poterba and Summers, Jagannathan et al., and Graham, suggest that the practical behavior of firms diverges from that of standard models.1 However, these surveys do not reveal whether discount rates move with the cost of capital or whether they determine investment. To understand how firms make decisions—in particular, why firm investment often appears puzzling through the lens of standard theory—we needed to remeasure discount rate dynamics and link them to investment.
New Data
Firms sometimes discuss discount rates on their conference calls, which are quarterly conversations with analysts. By manually reading call transcripts with a team of research assistants, we have been recording firms’ discount rates and perceived cost of capital over the past five years. So far, we have recorded 7,000 observations of discount rates and the perceived cost of capital for 3,000 distinct firms. The current database covers 20 countries going back to 2001, as detailed on costofcapital.org. We continue to collect new data.
We verify the reported data. When a firm increases its discount rate, its investment rate in the subsequent year falls. The magnitude is quantitatively consistent with a standard model. In addition, we find that a firm with a higher discount rate achieves higher realized returns on its future projects. These findings corroborate the idea that the measured discount rates and wedges capture required returns and shape investment demand.
Roughly 90 percent of large firms use discount rates to make investment decisions.2 However, we do not observe every firm because an explicit mention of the discount rate is just one way firms can communicate their investment strategy. Firms with at least one reported discount rate or perceived cost of capital account for roughly 50 percent of the total assets of firms in Compustat. Included firms are larger but otherwise similar to other listed firms in observable characteristics, including investment rates, bankruptcy risk, and profitability.
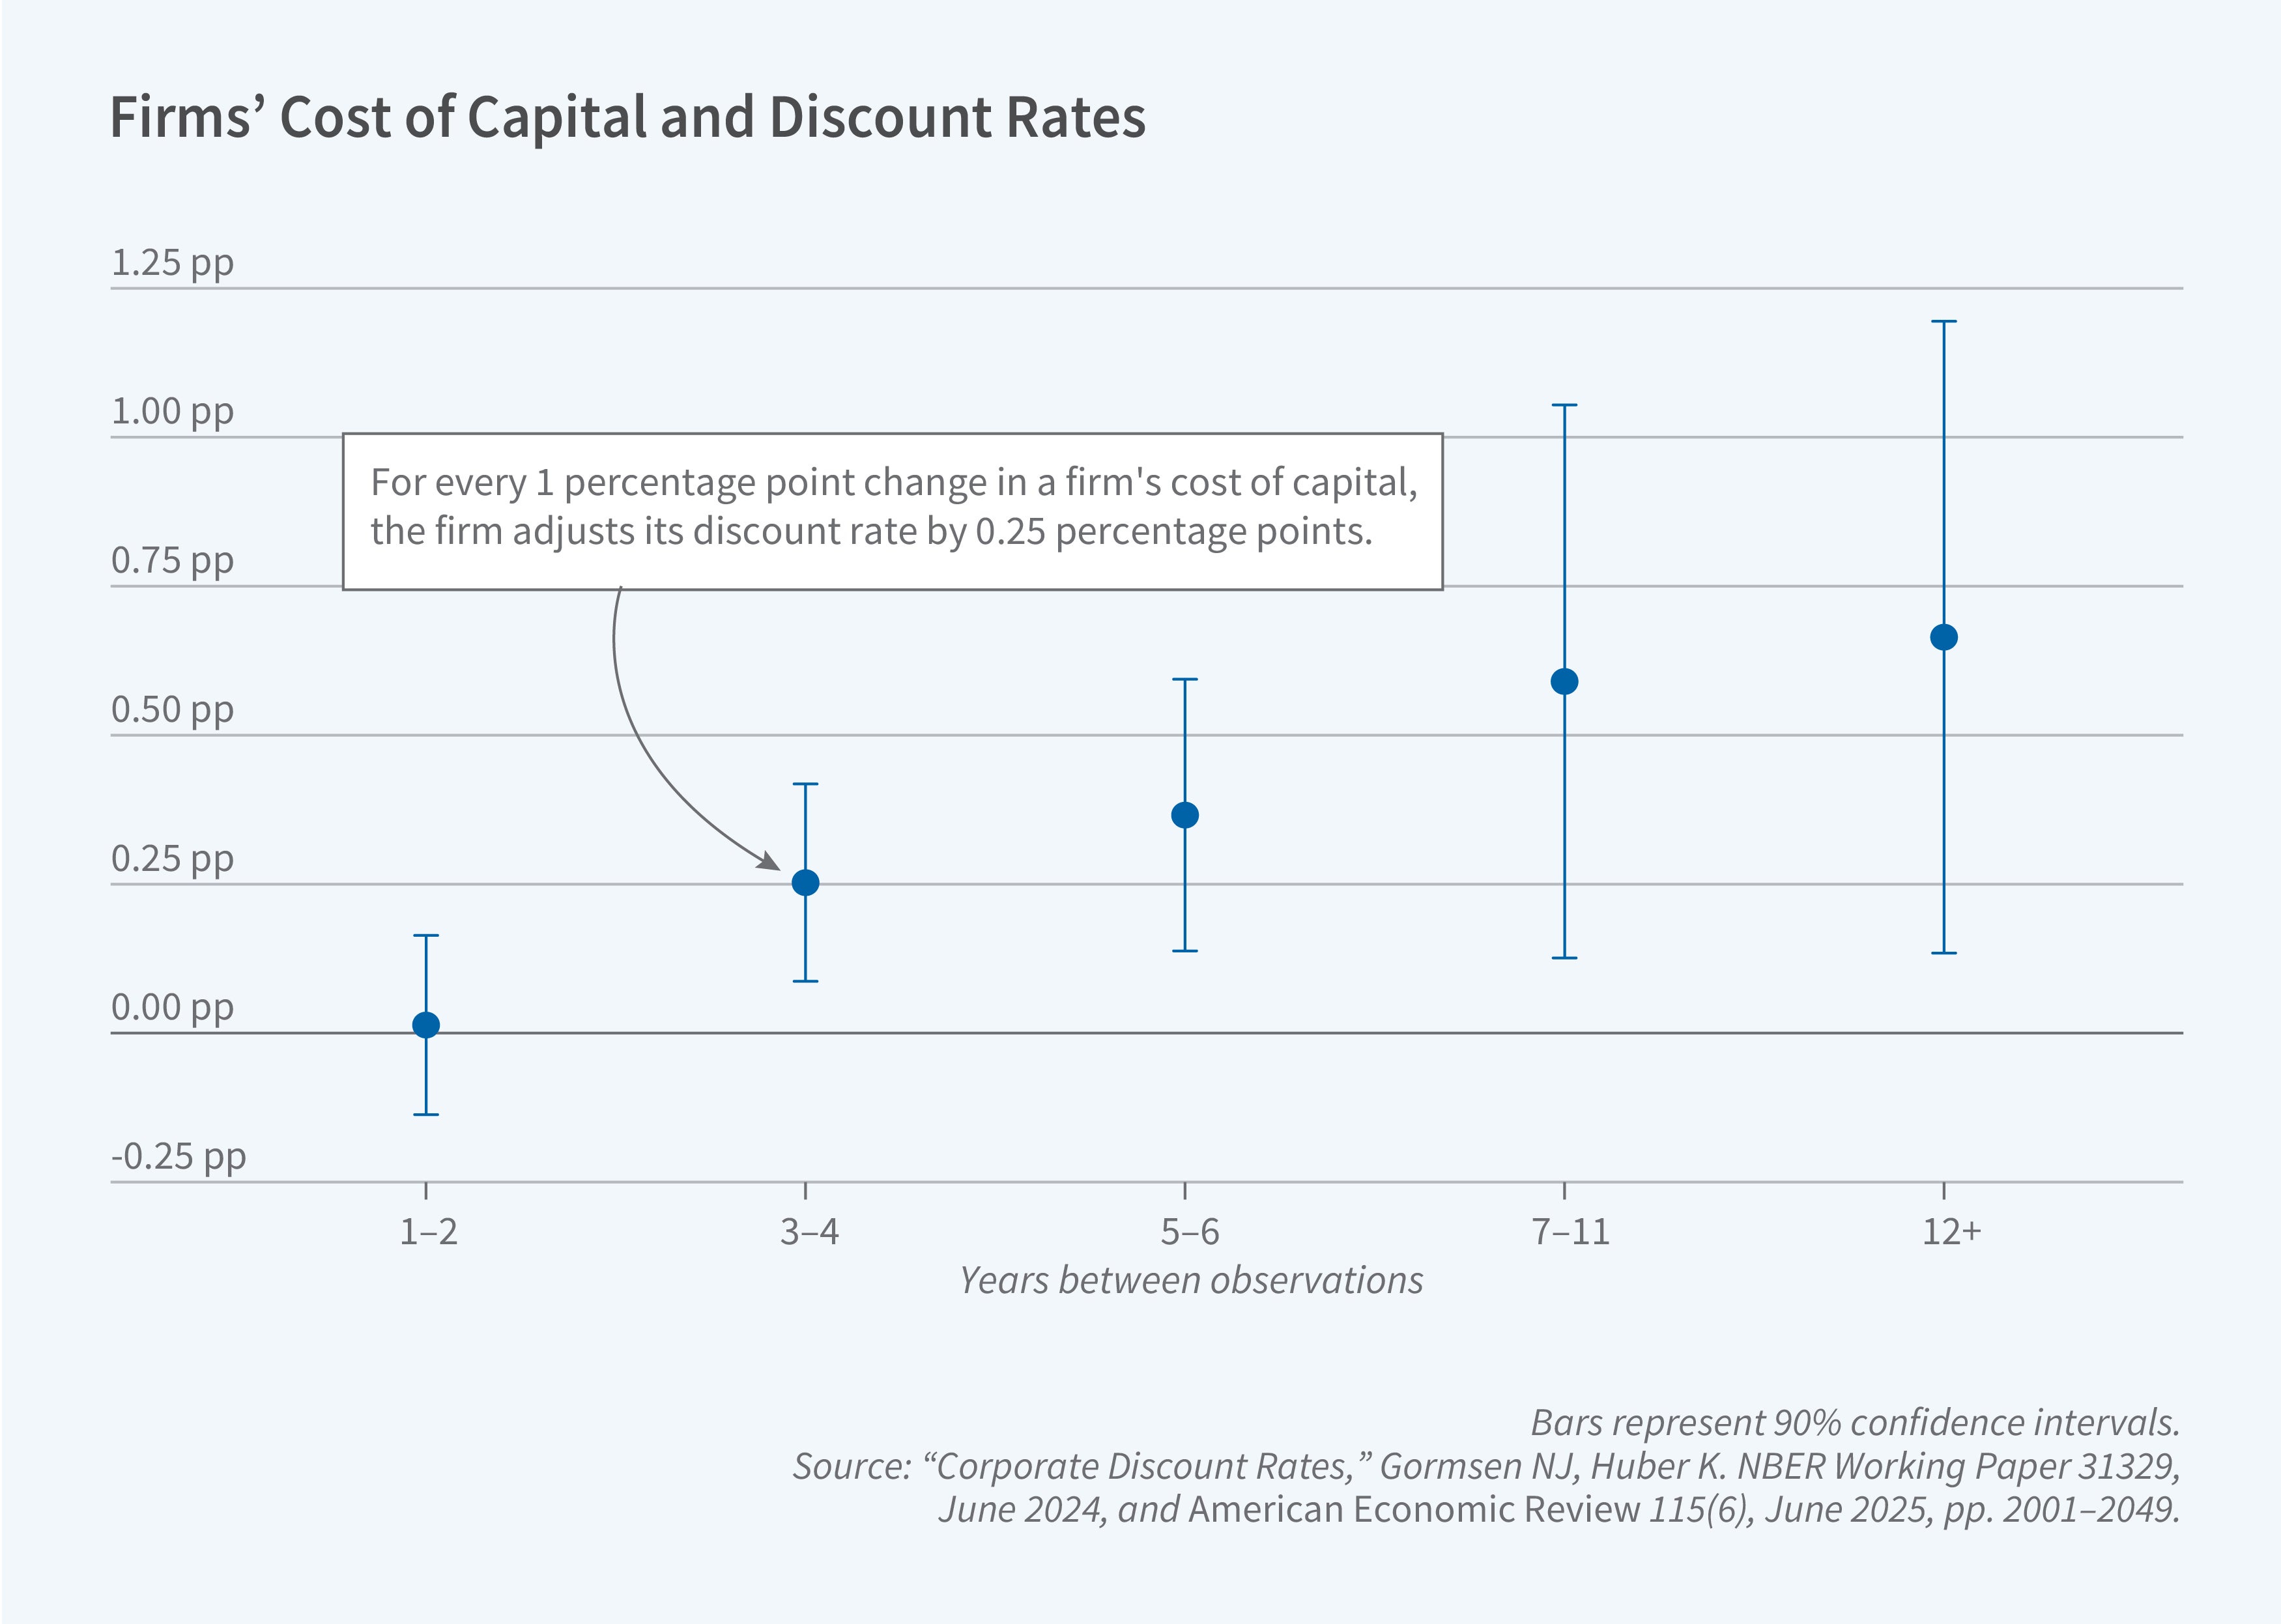
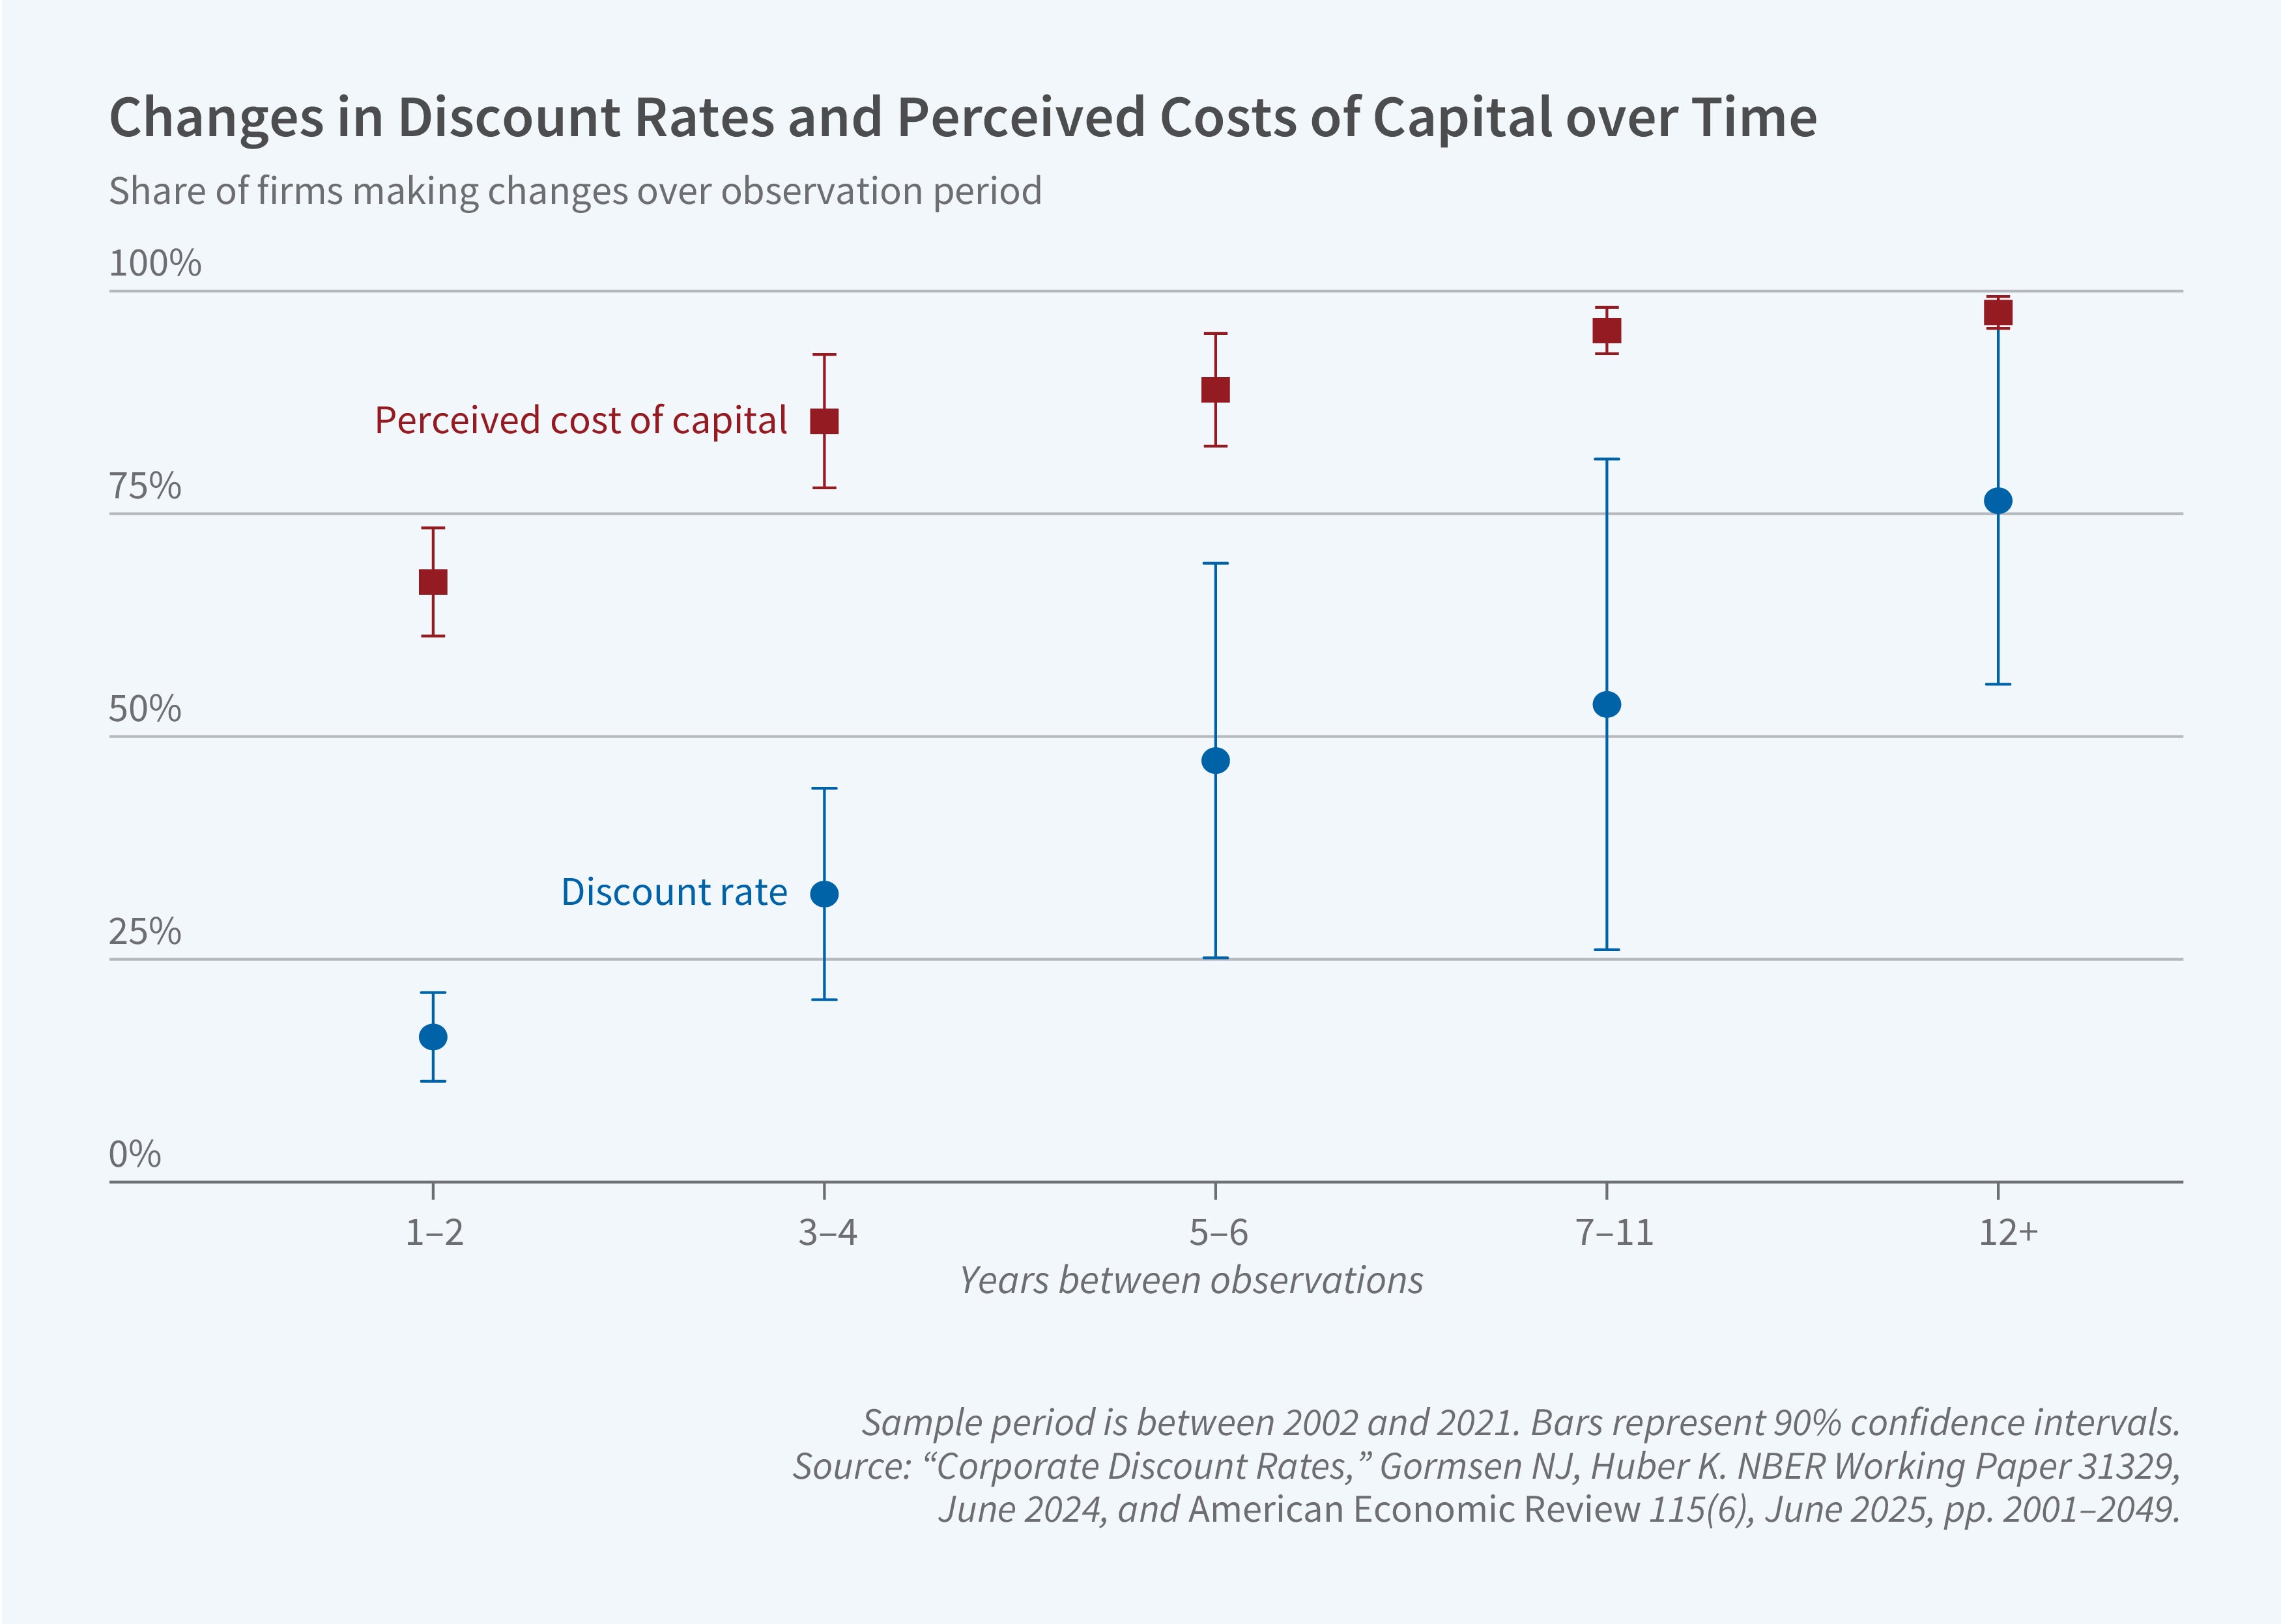
Discount rates behave differently from the standard view in four dimensions. First, discount rates are sticky with respect to the cost of capital. Over horizons within two years, changes in the cost of capital are hardly transmitted into discount rates. Over horizons beyond five years, changes in the cost of capital are transmitted close to one-to-one (see Figure 1). Most firms update their discount rates less than once every five years (see Figure 2). Second, firms’ perceptions of their cost of capital change more regularly, with most firms adjusting every year. Revisions in firms’ perceived cost of capital incorporate changes in interest rates and risk premia. The stickiness of discount rates is thus the result of a conscious decision of firms and not driven by ignorance about the cost of capital. Third, discount rates are, on average, 3 percentage points higher than the cost of capital. The gap is higher for firms facing little competition, financial and organizational constraints, and idiosyncratic risk. Finally, although in textbooks a firm’s true cost of capital is defined as the expected return on the firm’s outstanding debt and equity in financial markets, in practice, the level of firms’ perceived cost of capital deviates substantially from this standard definition. These persistent firm-level deviations ultimately influence discount rates and capital allocation.
Economic Consequences
Discount rates are at the heart of firm behavior, so their nonstandard behavior shapes firm growth and aggregate dynamics. We summarize a few of the implications we have explored so far.
Rising Discount Rate Wedges and “Missing Investment”
The average wedge between US firms’ discount rates and their perceived cost of capital has increased from 3 percent in 2002 to 5 percent in 2020. This increase is large relative to typical fluctuations in the cost of capital, for example, the secular decline in the cost of capital between 2002 and 2020.3 The rising wedge implies that firms have been holding back investment relative to what standard theory would predict. Over the same period, US investment has indeed been puzzlingly low even when accounting for intangibles and mismeasurement.4 In 2019, the shortfall in investment amounted to 20 percent of the US capital stock through the lens of a standard Tobin’s q model (see Figure 3).
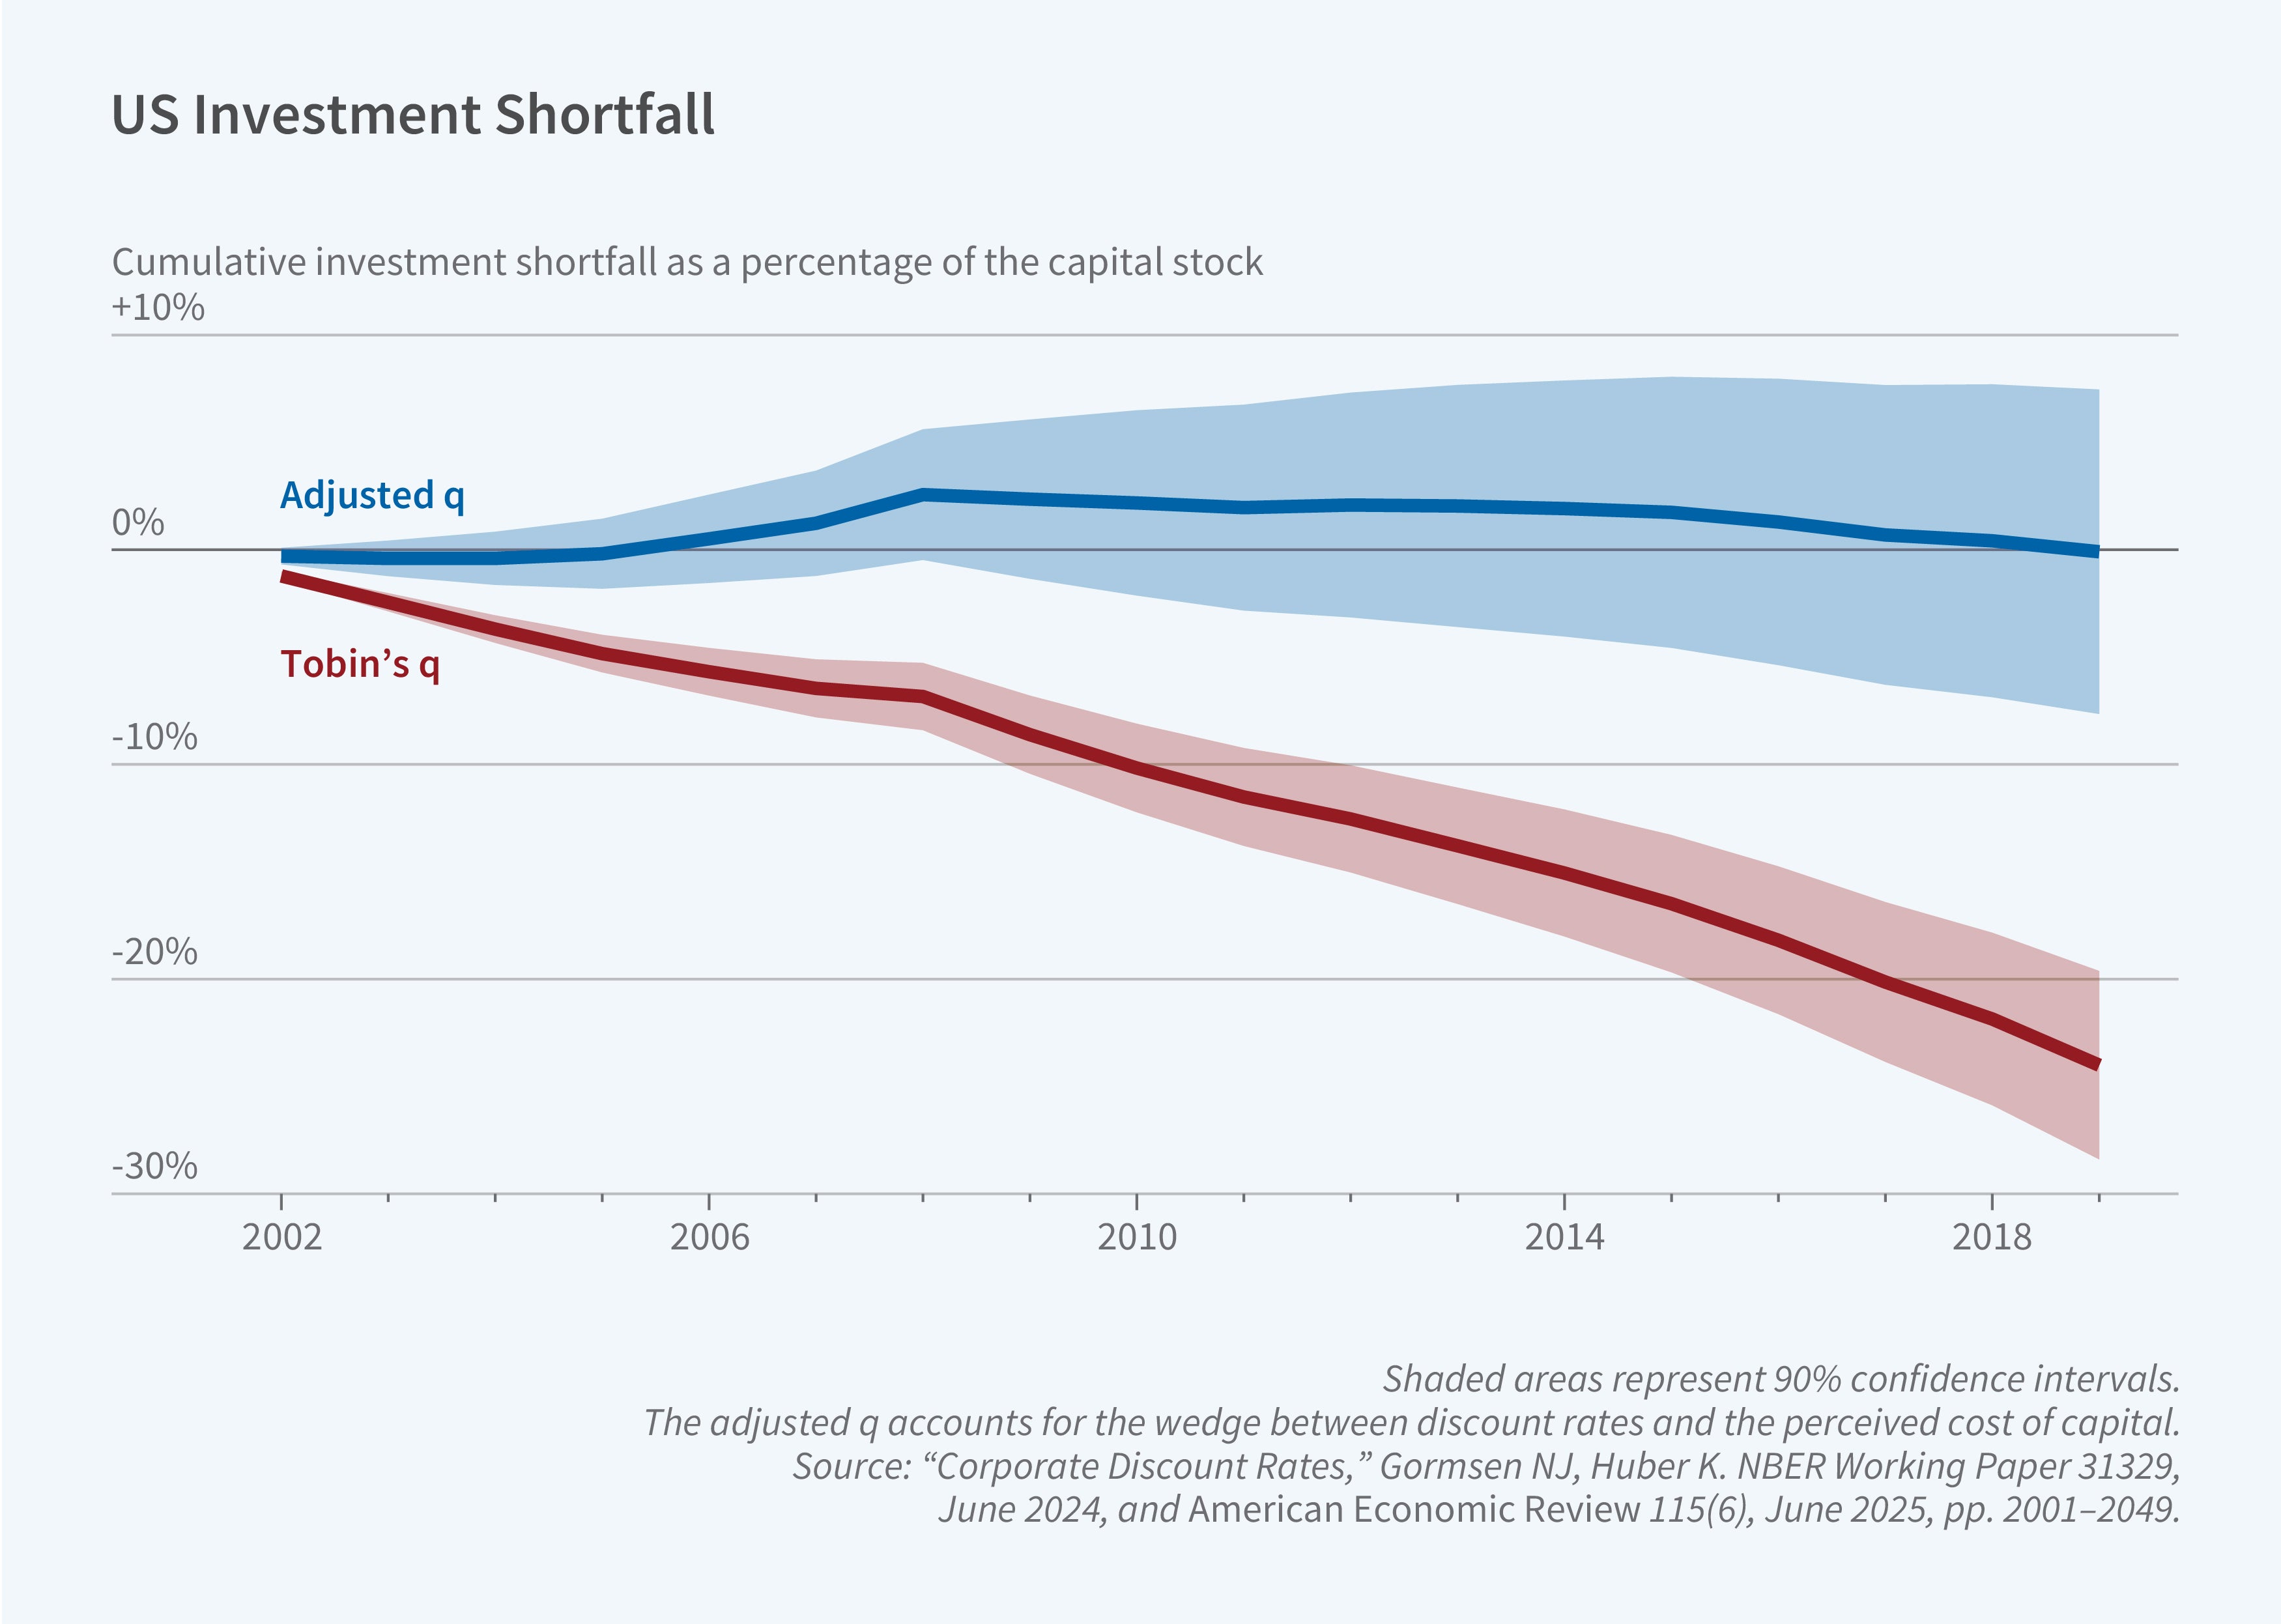
The new data reveal that larger discount rate wedges account for much of the missing investment. An adjusted q model—incorporating the observed wedges—implies little missing investment (see Figure 3). The increase in the wedge is thus large enough to materially influence capital formation. Why has the discount rate wedge increased so dramatically? The increase can be explained, in part, by stickiness with respect to changes in the cost of capital: the cost of capital dropped substantially from 2002 to 2020 while discount rates were more stable, generating rising wedges. In addition to stickiness, market power and risk contributed to the rising wedge.
Business Cycles, Monetary Non-Neutrality, and Sticky Discount Rates
Stickiness in discount rates influences how firm investment responds to shocks. First, the stickiness dampens investment responses to changes in the cost of capital. In the data, short-run investment is relatively insensitive to the cost of capital, which is often rationalized with high adjustment costs or inattention. Sticky discount rates mitigate the need for high adjustment costs, although the two are not isomorphic. Under sticky discount rates, investment responds identically to cash flow shocks, more strongly to expected inflation, and less strongly to the cost of capital, relative to the textbook example. Under high adjustment costs or inattention, investment responds weakly in general.
Firms’ discount rates are sticky with respect to expected inflation, causing investment to directly respond to changes in expected inflation.5 In standard models, real investment depends only on the real cost of capital and investment opportunities, not directly on inflation. In contrast, under sticky discount rates, increases in expected inflation raise investment by effectively lowering firms’ real discount rates. The data support this mechanism, as firms with stickier discount rates invest more when expected inflation increases.
We develop a general equilibrium model with sticky discount rates and study the impact on business cycle dynamics. Sticky discount rates generate unique predictions for business cycles. The new mechanisms operate when other prices are sticky, as in the textbook New Keynesian model, and in otherwise frictionless models, as in the neoclassical benchmark. We find that sticky discount rates represent a novel source of monetary non-neutrality, generate positive comovement between consumption and investment (addressing the long-standing challenge of explaining the investment-consumption comovement observed in the data), and change optimal monetary policy.
Capital Misallocation and the Perceived Cost of Capital
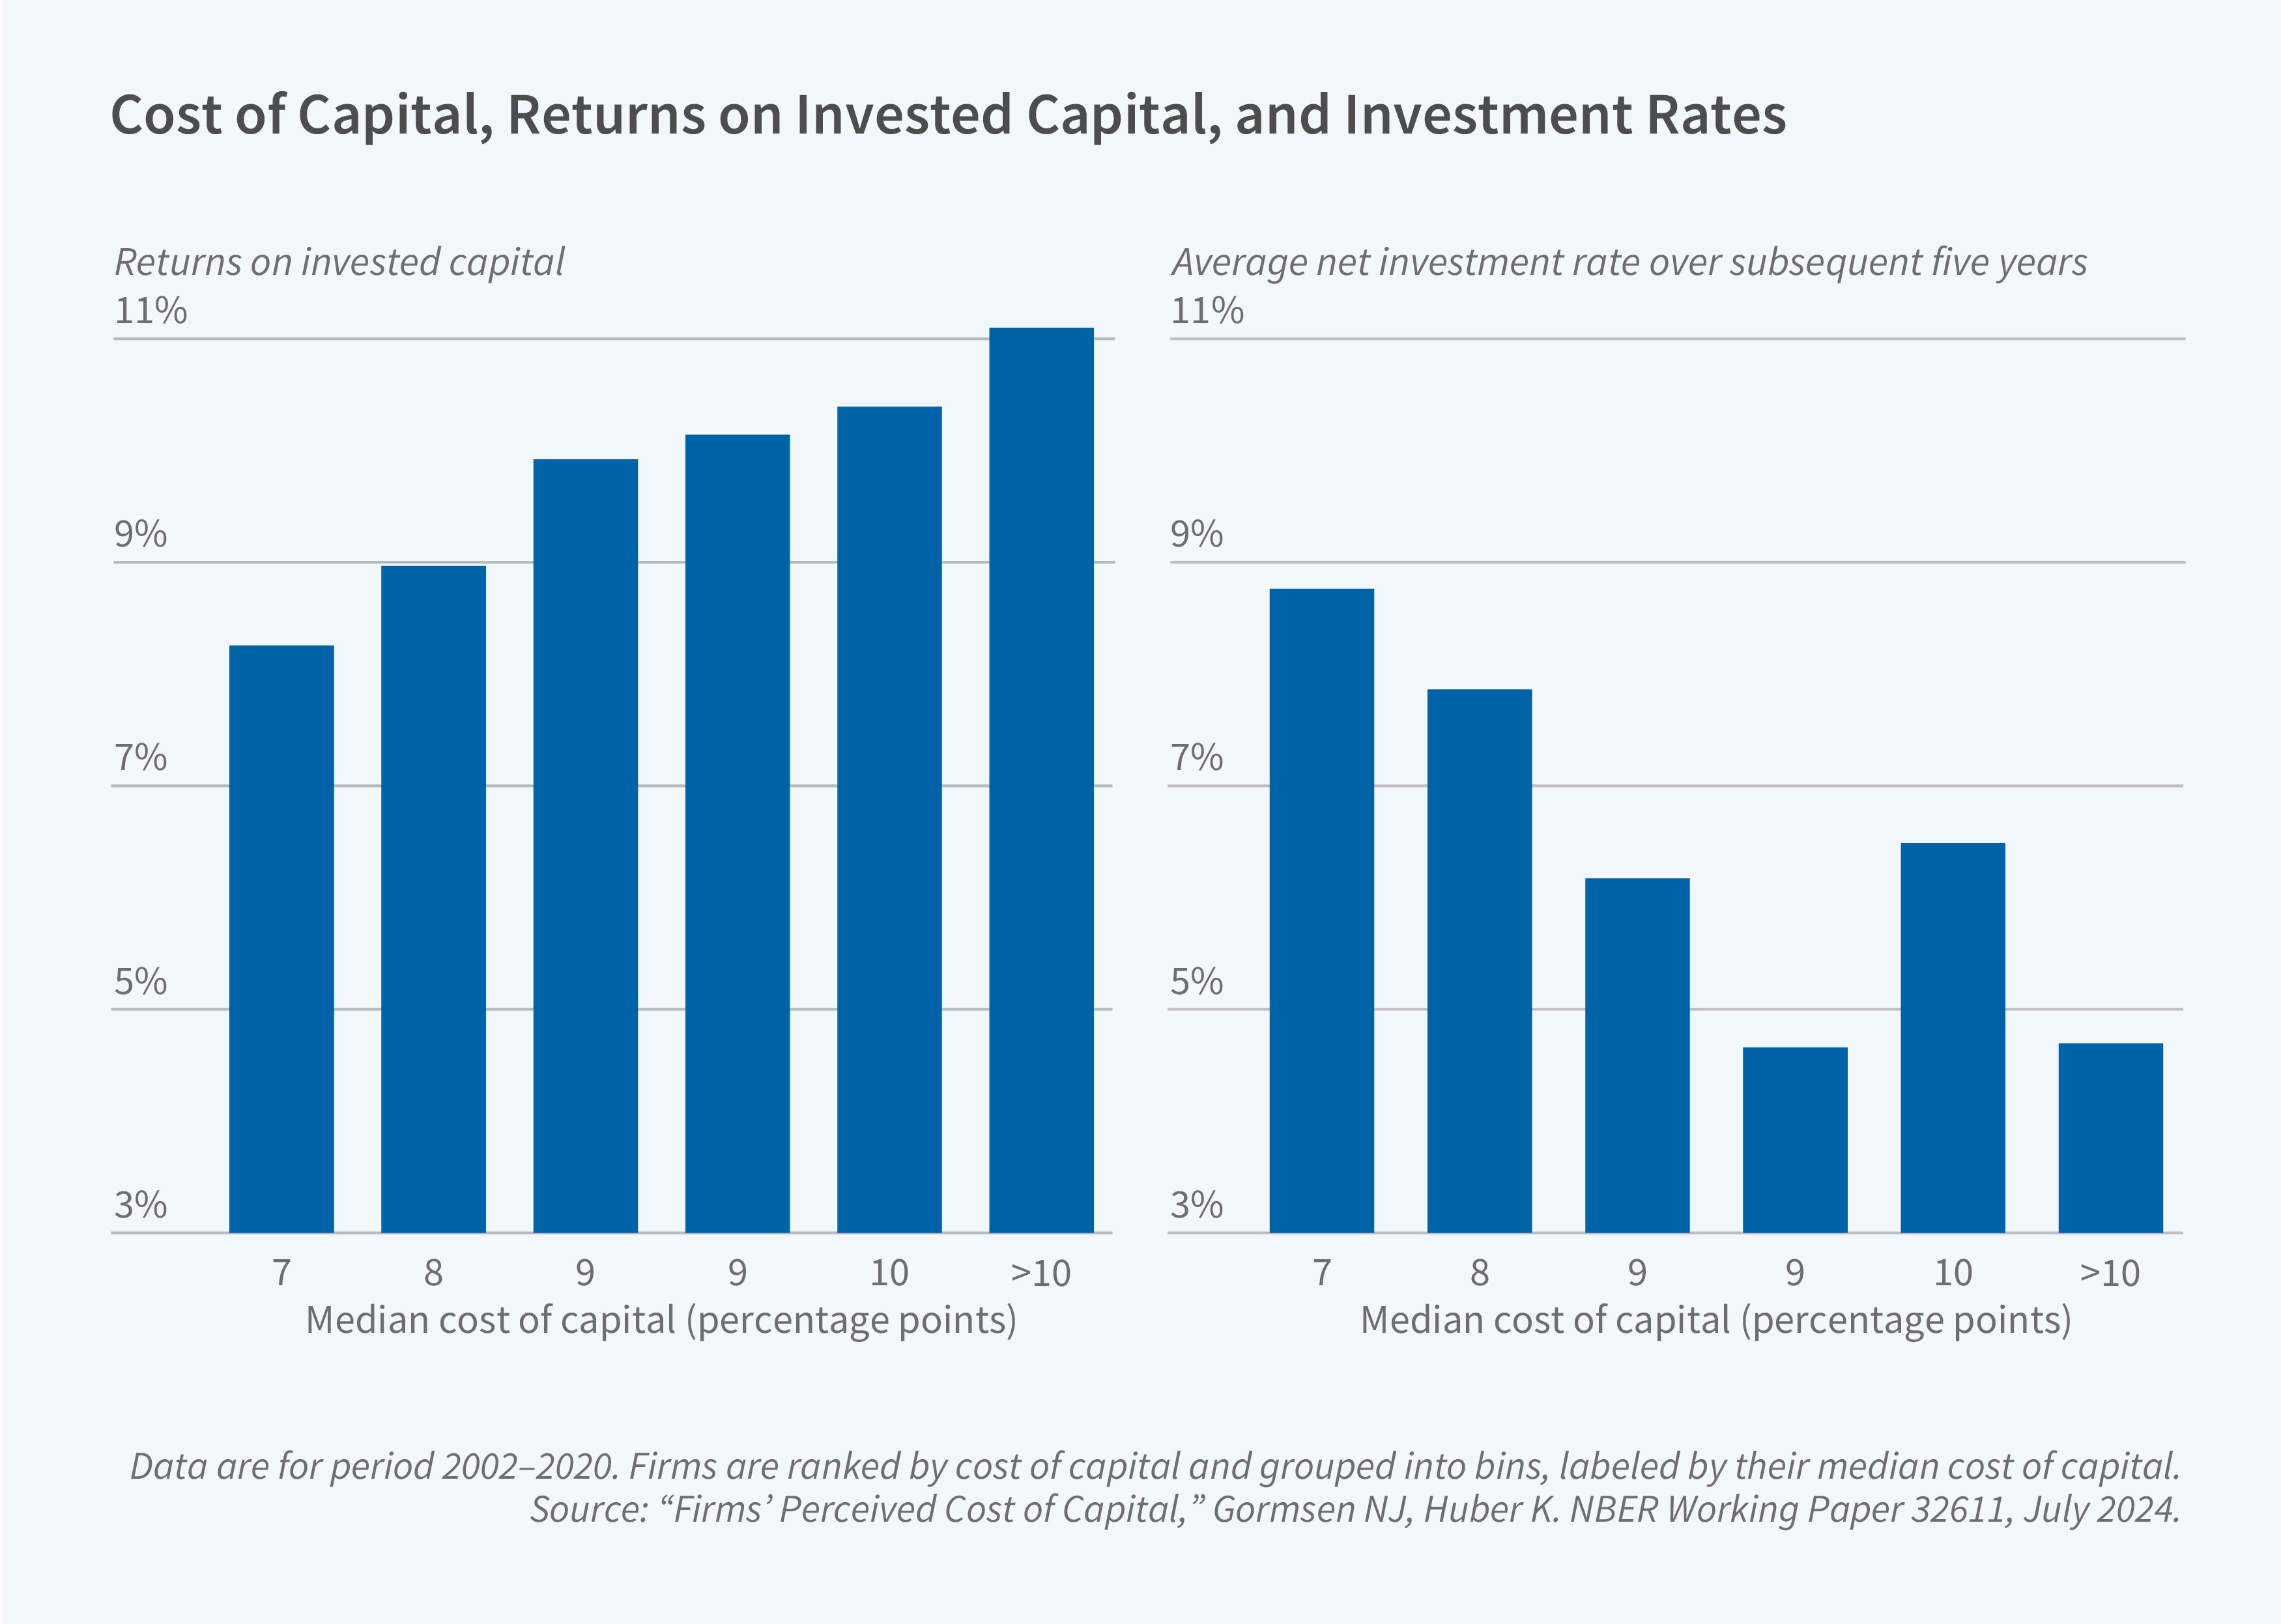
In the long run, firms’ discount rates move almost one-to-one with the cost of capital (see Figure 1). Indeed, firms with a higher perceived cost of capital have a higher return on invested capital and a lower investment rate in the long run (see Figure 4).6 To understand the allocation of capital across firms, we therefore need to understand firms’ perceived cost of capital.
A bedrock assumption throughout economics is that firms perfectly know their cost of capital. The new data allow us to explore this assumption because we observe how firms perceive their cost of capital. We find that firms’ perceived cost of capital deviates substantially from the standard assumption: the perceived cost of capital incorporates interest rates in line with standard theory, but there are large firm-level deviations in the perceived cost of equity not justified by standard theory. The deviations can partly be explained by firms using the capital asset pricing model (CAPM), but not fully. A key takeaway is that firms incorporate idiosyncratic terms not explained by standard finance models, potentially driven by the biased views of analysts or managers.
These results have first-order implications for aggregate efficiency. Firms with a distorted perceived cost of capital invest too much or too little relative to the optimum. Through the lens of a standard capital allocation model, aggregate productivity is 5 percent lower as a result.7 The results imply that either economists have been making entirely the wrong assumptions about firms’ objectives or that economists can substantially improve aggregate efficiency by changing firms’ perceived cost of capital.
Climate-Friendly Investments and the Cost of Capital
Climate change has generated a controversial debate about how to incentivize green investment by firms. Economists have suggested a “cost of capital channel”: financial investors could provide capital to green projects, for example, by purchasing green stocks and bonds, thereby lowering the cost of green capital and facilitating green investments.
A key question is whether this cost-of-capital approach can work in practice. Ideally, it requires (1) across firms, that the cost of capital perceived by greener firms be lower and (2) within firms, that they apply a lower cost of capital to greener divisions.
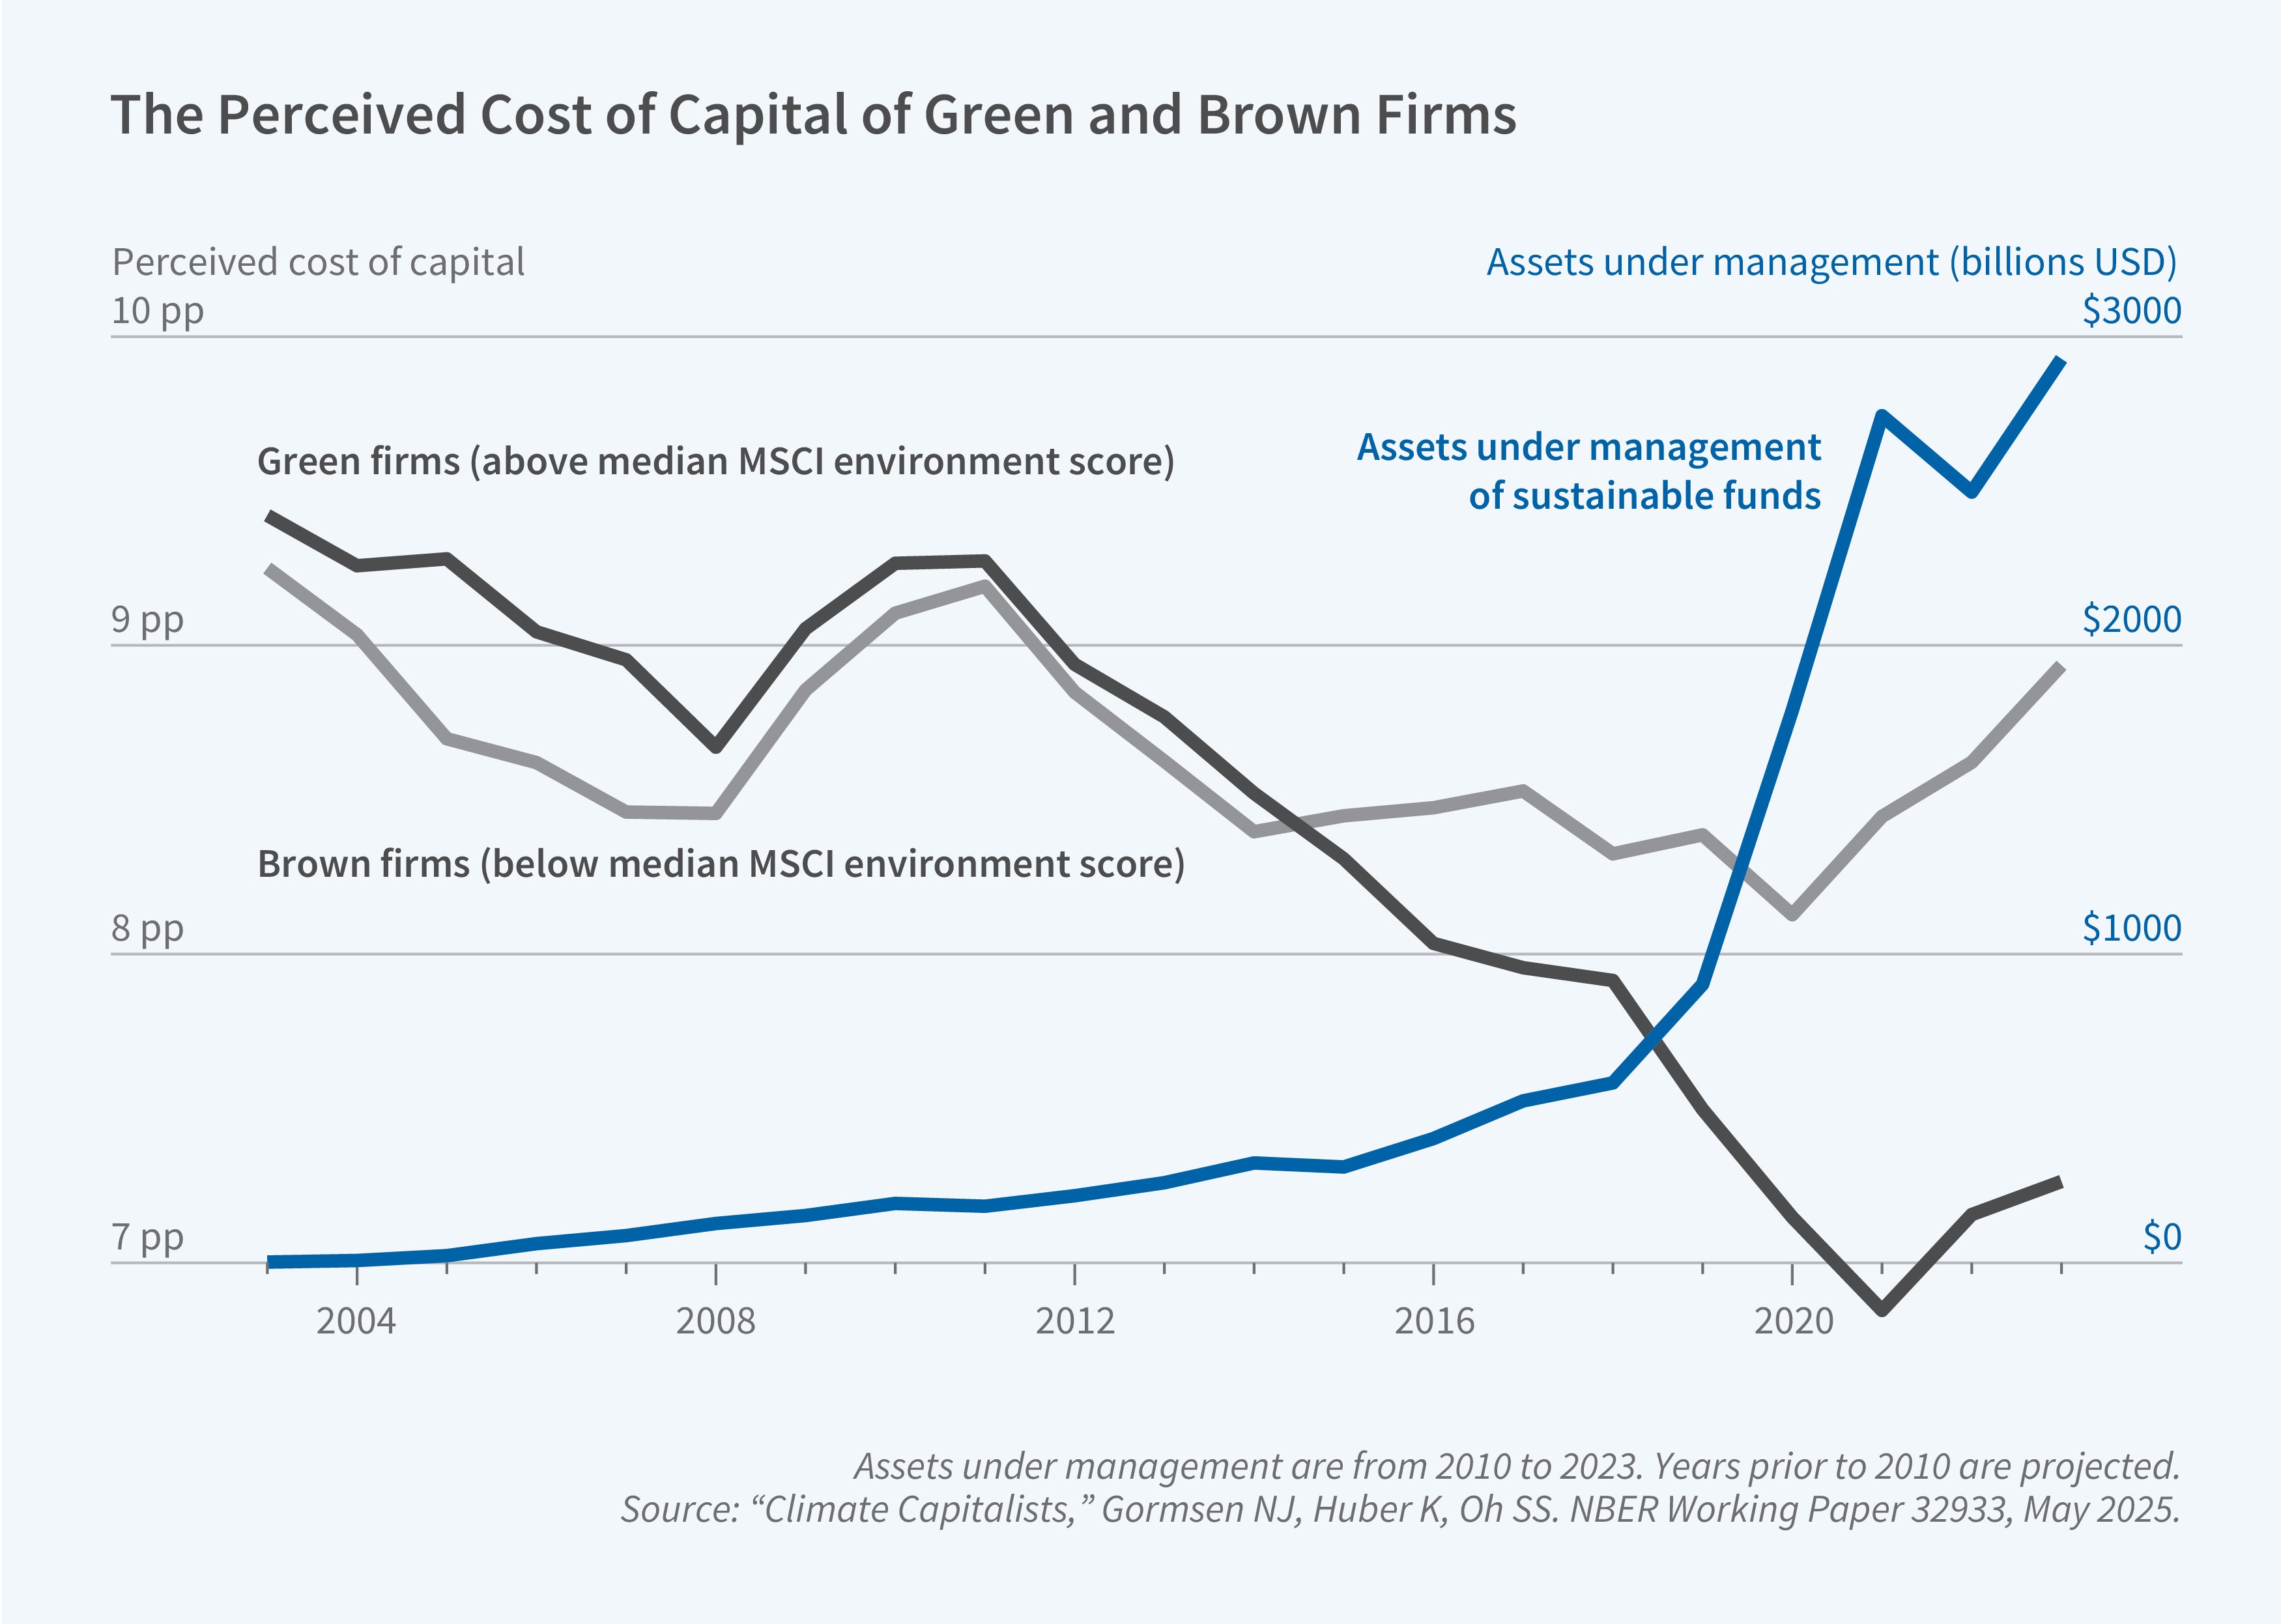
We find that the perceived cost of capital of green firms fell substantially relative to that of brown firms (see Figure 5).8 The difference opened up after 2016, as climate concerns of investors and governments surged and sustainable funds in financial markets experienced strong inflows (indicated by assets under management). Within firms, some of the largest energy firms have started applying a lower perceived cost of capital and discount rate to their greener divisions, such as renewable energy, since 2016.
Together, the results suggest that a cost-of-capital channel can incentivize the reallocation of capital to green firms. Firms are willing to adjust the relative cost of green capital over time, implying that large-scale changes in financial markets impact firm behavior. Moreover, a few key firms use within-firm variation, so firms are in principle sophisticated enough to become greener through within-firm adjustments.
Endnotes
“A CEO Survey of US Companies’ Time Horizons and Hurdle Rates,” Poterba JM, Summers LH. MIT Sloan Management Review 37(1), October 1995. “Why Do Firms Use High Discount Rates?” Jagannathan R, Matsa DA, Meier I, Tarhan V. Journal of Financial Economics 120(3), June 2016, pp. 445–463.
“Presidential Address: Corporate Finance and Reality,” Graham J. NBER Working Paper 29841, March 2022, and The Journal of Finance 77(4), August 2022, pp. 1975–2049.
“Corporate Discount Rates,” Gormsen NJ, Huber K. NBER Working Paper 31329, June 2024, and American Economic Review 115(6), June 2025, pp. 2001–2049.
“Investment-less Growth: An Empirical Investigation,” Gutiérrez G, Philippon T. NBER Working Paper 22897, January 2017, and Brookings Papers on Economic Activity 48(2), Fall 2017, pp. 89–190.
“Sticky Discount Rates,” Fukui M, Gormsen NJ, Huber K. NBER Working Paper 32238, July 2025.
“Firms’ Perceived Cost of Capital,” Gormsen NJ, Huber K. NBER Working Paper 32611, July 2024.
“Misallocation and Manufacturing TFP in China and India,” Hsieh CT, Klenow PJ. The Quarterly Journal of Economics 124(4), November 2009, pp. 1403–1448.
“Climate Capitalists,” Gormsen NJ, Huber K, Oh SS. NBER Working Paper 32933, May 2025.


