The Role of Women’s Employment in Recent Recessions
The pandemic recession of 2020 was unusual not only for its cause and severity, but also for the disproportional impact that it had on women’s employment.
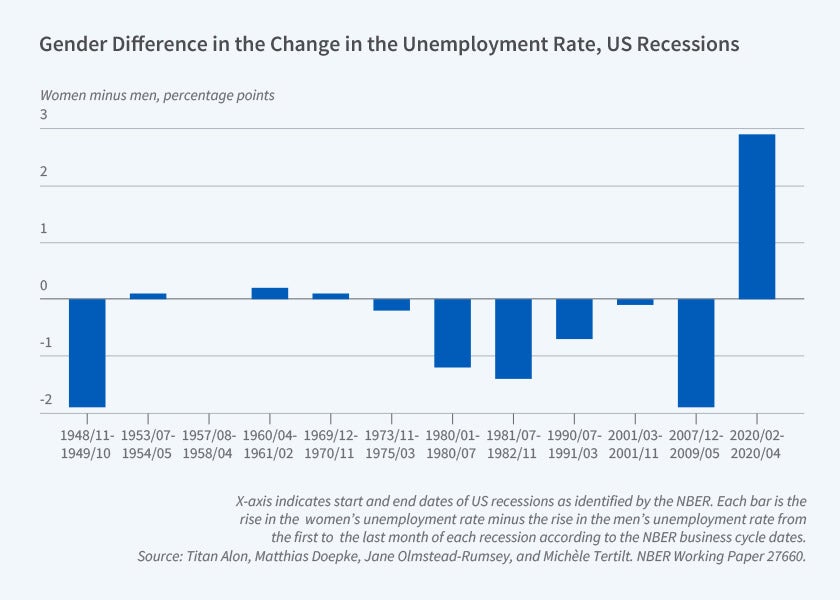
Figure 1 displays the difference between the increases in women’s and men’s unemployment for all US recessions since 1949. In most recessions, this difference is either close to zero or negative, indicating that men experienced a sharper rise in unemployment than women. In the Great Recession of 2007–09, for example, men’s unemployment increased by about 2 percentage points more than women’s. In contrast, in the pandemic recession of 2020 women experienced a sharper rise in unemployment. The gap between the increase in women’s and men’s unemployment is almost 3 percentage points, which is larger in absolute value than the gap in all other recessions. At the height of the recession, hundreds of thousands more women than men were unemployed, even though 10 million fewer women than men were in the labor force.
The pattern displayed in Figure 1 gives rise to a number of questions that my coauthors and I address in recent work. The first challenge is to understand exactly why recessions affect women and men differently, and which factors account for the extraordinarily large impact of the pandemic recession on women’s employment. A related question is whether the gendered impact of recessions is specific to the US economy or a generic feature of many countries. Lastly, there is the question of the wider impact of the gendered dimension of recessions. Specifically, is a “female” recession just a “male” recession with the signs reversed, or are there qualitative differences in the transmission, amplification, and persistence of macroeconomic shocks depending on which gender is more affected?
Looking for Causes: Industry Composition and Childcare
Regarding the causes of the differential impact of recessions on women and men, one key factor is the industry composition of employment. The share of male and female workers varies widely across sectors, and likewise there are large differences in how much employment in each sector is affected by recessions. In recent recessions before 2020, the sectors with the largest employment losses included manufacturing and construction; sectors such as education and healthcare saw little or no employment losses. As it happens, the sectors that decline the most in typical recessions also have high male employment shares, whereas many women work in sectors that exhibit stable employment over the cycle. Hence, the industry composition of employment contributes to the larger impact of recent pre-pandemic recessions on men’s employment.
The industry composition of employment also plays a central role in the large impact of the pandemic recession on women’s employment. Employment losses were in large part driven by shutdown orders and social distancing. Consequently, the largest employment reductions in the pandemic recession were in contact-intensive services such as restaurants, and in the hospitality sector. These are sectors with high female employment shares.
Figure 2, Panel A illustrates the role of the sectoral composition of employment by comparing employment declines across sectors between the Great Recession of 2007–09 and the pandemic recession of 2020. The figure plots the cyclical volatility of each sector — the extent to which employment varies with overall output over the cycle, averaged over the pre-pandemic period — versus the actual change in employment in the last two recessions. In the Great Recession we observe the typical pattern, with large employment losses of up to 20 log points in the cyclical sectors of construction and manufacturing, which have high male employment shares. In contrast, the sectors with the highest female employment shares saw little change in employment. In the pandemic recession of 2020 the pattern is completely different. Two sectors stand out — leisure and hospitality with an employment loss of 50 log points and other services with a loss of 20 log points. Both of these sectors have high female employment shares. Employment losses are substantially smaller in the other sectors, and display no correlation with cyclical volatility in earlier economic cycles.
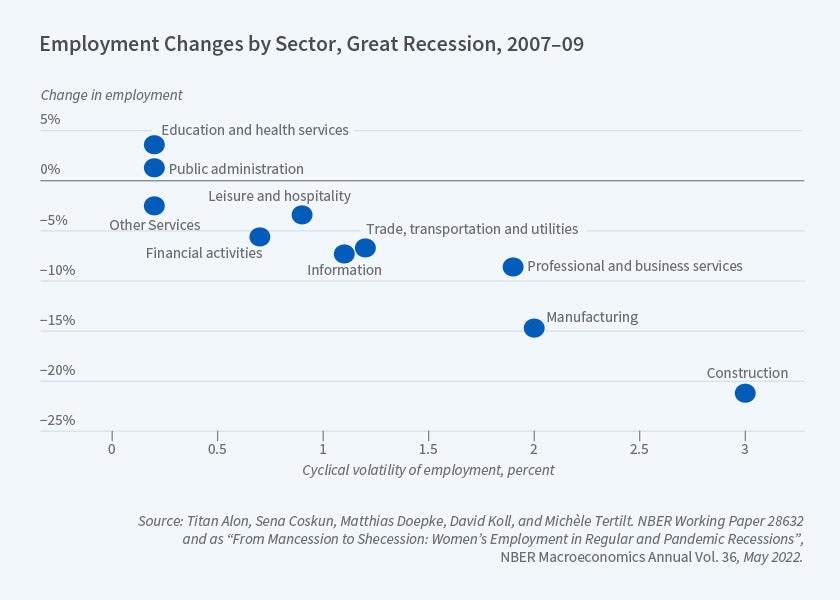
Figure 2, Panel B suggests that the industry composition of employment plays a central role in the gendered impact of recessions, but it turns out that there is more to the story. A second factor specific to the pandemic recession is changing childcare needs. At the height of the pandemic, daycare centers and schools were closed in most US states and in other countries, implying that parents had to care for their children and organize their learning at home. And while in some places schools reopened after a few months, in large parts of the United States school closures lasted for more than a year and extended throughout the 2020–21 school year. The resulting rise in childcare needs may have impacted parents’ ability to work. If mothers bear the majority of the extra burden of childcare, the rise in childcare needs could have reduced their labor supply.
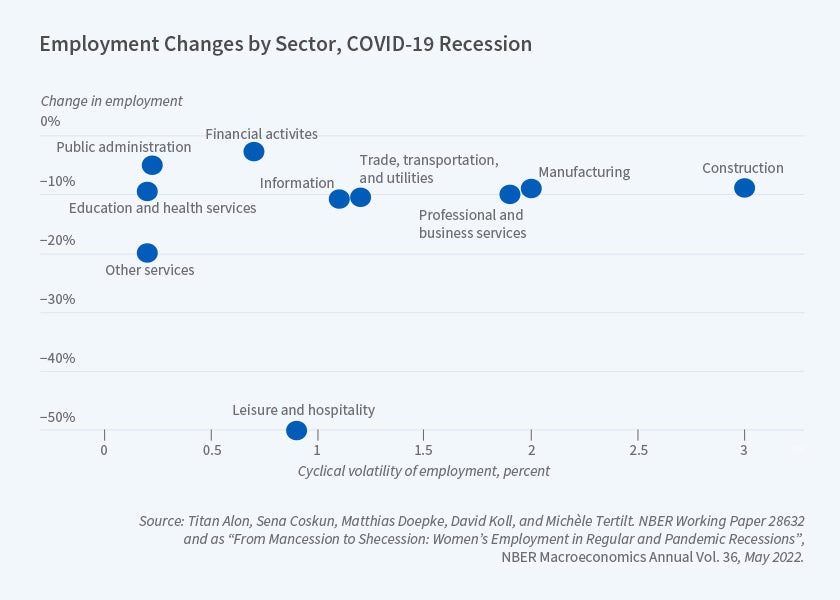
Figure 3 illustrates the potential role of the childcare channel by showing how women’s and men’s employment evolved in the Great Recession versus the pandemic recession depending on whether they had minor children in the household. Each line displays the change in the gap between women’s and men’s employment from the beginning of each recession; hence, a flat line would indicate that women’s and men’s employment moved in parallel. The blue lines display the data for the Great Recession of 2007–09. Here we see that women gradually gained employment relative to men, in line with a larger impact of the recession on men. Having children made little difference to this finding: the employment gap evolves roughly in parallel among parents and nonparents.
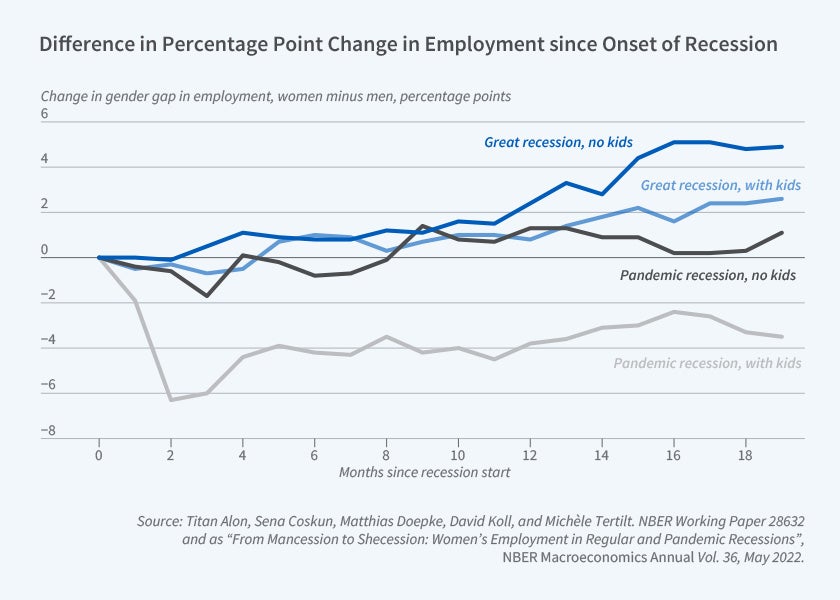
The results for the pandemic recession are starkly different. There is little change over time in the employment gap among women and men without children; overall, in this group the relative impact is similar to that in the Great Recession. In sharp contrast, among parents, women with minor children experienced a rapid decline in employment of more than 5 percentage points relative to men in the first two months of the recession. This employment gap specifically for mothers of minor children remained large through the following one and a half years, which covers the period of widespread school closures in the United States. These results strongly suggest that women’s disproportionate share in meeting childcare responsibilities was a key factor in the large impact of the pandemic recession on women’s employment.
Disentangling the Channels
The empirical patterns documented above do not provide final answers on the causes of the gendered impact of the pandemic recession. For example, the sectoral composition of employment differs between parents and nonparents, suggesting possible interactions between the channels. Titan Alon, Sena Coskun, David Koll, Michèle Tertilt, and I use microdata on individual changes in employment and hourly labor supply to get a more detailed picture.1 Specifically, we regress changes in labor supply during the COVID recession on gender and the presence of children, along with a large set of occupation and industry fixed effects. These fixed effects filter out the change in employment common to all workers in a specific industry-occupation combination during the recession. The effects of gender and childcare that we measure therefore do not arise because, say, mothers are more likely to be employed in contact-intensive service sectors.
In the case of the United States, this analysis confirms that both sectoral effects and childcare contributed to women’s employment decline during the pandemic recession. However, the effects of childcare were substantially smaller than what is suggested by the raw data, which indicate that mothers are more likely to work in sectors and occupations that were more affected by the crisis. Among parents of young children up to preschool age, once we control for industry and occupation effects there are no significant differences in the employment impact on women and men. Among parents of school-age children, in contrast, mothers’ employment declines by close to 2 percentage points more than fathers’ even after controlling for other factors. When we look at hours worked instead of employment, the effects are substantially larger: the labor supply of mothers of school-age children declines by close to 9 percentage points more than that of fathers after controlling for industry and occupation effects. These patterns suggest that many women reduced hours or switched to part-time work to make more time to take care of their children at home.
Another compelling finding from this analysis is that the disproportionate impact of the pandemic on women’s employment is entirely concentrated on women who cannot work from home. Workers who were able to telecommute and continue working from home experienced fewer layoffs to begin with, and the added flexibility of being at home evidently facilitated meeting childcare needs while continuing to work. Among telecommuting workers, there were no significant gender differences or childcare effects in the employment impact of the pandemic.
Lastly, we also find that sector and childcare effects do not account for all of the large impact of the pandemic recession on women’s employment. Specifically, we find that even after controlling for industry and occupation effects and focusing only on workers with no minor children at home, women’s employment still declined by a percentage point more than men’s, and their hours worked declined by an additional 4 log points. An analogous regression for the Great Recession shows the opposite pattern of smaller employment declines for women after controlling for industry, occupation, and childcare effects. A decomposition exercise shows that depending on whether we consider employment or hours, industry and occupation effects account for between 12 and 20 percent of the gender gap in the impact of the recession, and childcare effects make up 14 to 18 percent of the total. In either case, the residual accounts for more than 50 percent of the gap.
Little is known so far about what accounts for this additional impact on women’s employment. One possibility is that the decline reflects care work not related to minor children. For example, some women may have left employment or reduced hours to care for older relatives. Another possibility is that the decline reflects precautionary behavior. Some workers may have voluntarily reduced employment to avoid the possibility of getting infected at work. If women in general adjust their behavior more strongly in response to possible infection, this would generate an additional decline beyond that attributed to sector and childcare effects.
Macro Repercussions
The gendered impact of recessions has usually been ignored in formal economic models of the business cycle. Classic real business cycle models rely on a representative household that splits time between leisure and labor supply, without any gender dimension or indeed any heterogeneity within or across households. More recently, models often allow for a range of household types distinguished by their preferences and their income processes, but gender is still largely left aside. Does this omission matter for the onset, propagation, and persistence of macroeconomic shocks?
Jane Olmstead-Rumsey, Alon, Tertilt, and I address this question by including multimember households and gender distinctions in an otherwise standard representation of the household sector in a business cycle model.2 The model accounts for childcare needs, productivity differences in market production, home production, and childcare, and also for a potential role of social norms in generating the division of labor within households that is observed in the data. We calibrate the model to reproduce the structure of labor supply and time allocation for US households, including a higher share of part-time work among women and a disproportionate female contribution to home production and childcare.
Using this model, we compare the overall economic impact of economic shocks of a similar overall magnitude that either affect women or men more, such as industry-specific shocks that take place in industries with high female versus male employment shares. We think of this comparison as a stylized comparison of a Great Recession shock that takes place primarily in manufacturing and construction with a pandemic recession shock that takes place primarily in services, while holding constant the magnitude and persistence of the initial shock. We find that these shocks differ not just in terms of who is most affected, but also in the overall response of the economy.
Both in the model and in the data, the overall labor market behavior of women is sharply different from that of men. Most prime-age male workers are strongly attached to the labor force; the vast majority of them either work full time or are unemployed and looking for full-time work. Hence, when a shock hits and men are laid off, they usually do not leave the labor force, but enter unemployment until they find a new job. In recent decades there has been a moderate decline in prime-age men’s labor force participation, but overall these patterns persist.
Among women, there is much greater variation in labor market behavior. Some women, such as young single women without children, behave similarly to men of the same age. In contrast, among married women and women with children we observe much greater variation, with some working full time, a substantial fraction part time, and others out of the labor force. Greater variation in labor supply can also be observed for individual women over time. For example, many women leave the labor force temporarily when they have children and later return to part- or full-time work. Women’s labor supply also reacts more flexibly to new economic circumstances, such as changes in their own wages or career opportunities and changes to their partners’ income and employment.
We find that this added flexibility of women’s labor supply matters for macroeconomic outcomes in two ways. First, spouses can provide implicit insurance for each other by each adjusting their labor supply in response to shocks that affect the other. One example is the “added worker effect” whereby nonworking spouses enter the labor force in response to their partners’ job losses. We find that this insurance channel is stronger when business cycle shocks affect primarily men. Many men have female partners who work part-time or are out of the labor force, and thus can potentially offset some of the income reduction for the household by increasing their labor supply. In contrast, given that most men already work full time, there is less scope for reacting to shocks that affect their female partners.
A second channel concerns the persistence of a shock’s impact. When women lose employment in a recession, they are more likely to transition temporarily out of the labor force or to part-time work, whereas men are more likely to continue seeking full-time work. As a result, when women lose employment they experience a more persistent decline in labor supply and in earnings, amplified by the loss of work experience when out of the labor force and by forgone career opportunities. As a result, all else equal, economic shocks that put more women out of work result in a more persistent decline in overall labor supply and also put upward pressure on the gender wage gap.
The results of our modeling exercise, along with the experience of the pandemic recession of 2020, highlight the once-neglected role of gender in aggregate economic fluctuations. Macro shocks differ in their impact on women and men in the labor market, and who is most affected matters for the propagation and persistence of economic downturns. The underlying features that give rise to these effects, in particular women’s and men’s labor force participation, childcare needs, and the intrahousehold division of labor, have changed rapidly in recent decades. Accounting for the role of gender in economic fluctuations, and understanding how it has shifted in response to the changing roles of women and men in families and in society more generally, represents an important research challenge.
Endnotes
“From Mancession to Shecession: Women’s Employment in Regular and Pandemic Recessions,” Alon T, Coskun S, Doepke M, Koll D, Tertilt M. NBER Macroeconomics Annual 36, 2022, pp. 83–151.
“This Time It’s Different: The Role of Women’s Employment in a Pandemic Recession,” Alon T, Doepke M, Olmstead-Rumsey J, Tertilt M. NBER Working Paper 27660, August 2020.


