CEOs and Firm Performance
CEOs have become a topic of increasing scrutiny in economic research. Early studies on this topic inferred the presence of differentiation in CEOs’ abilities and managerial styles indirectly, examining changes in firm performance after exogenous events such as deaths or movements of managers across different firms affected their ability to manage.1 This summary describes recent empirical work that I have conducted to generate direct evidence on what top managers do, how they differ from one another, and whether these differences matter for firms’ performance.
The research touches upon different aspects of what CEOs do — ranging from day-to-day behavior to strategy setting. Ultimately, it strives to build new measurements of CEOs’ activities that are at the same time fine grained and scalable within and across countries. Given the intangible nature of leadership, this requires embracing an eclectic empirical approach, including developing new survey instruments, exploring previously untapped quantitative and textual data sources, and adopting machine learning methods to leverage rich and at times unstructured data.
This research has led to three broad findings. First, top managers vary considerably in what they do, both in terms of day-to-day behaviors (effort on the job, allocation of time across activities) and decision-making approaches (specifically, the formulation and execution of firm strategies). Second, CEOs also differ in terms of what they do not do, that is, the extent to which they allocate decision-making authority to other individuals in their organizations. Third, differences across CEOs in both activities and delegation are related to organizational performance, primarily due to matching effects. There isn’t one optimal way to be a CEO. What matters is the fit between what CEOs do (or do not do, in the case of delegation) and the specific needs of the firms that they run. This latter finding points to the importance of studying frictions in the market for CEOs, starting with imperfections in the selection of CEOs and in the way in which CEOs’ activity is monitored and rewarded within firms.
What Do CEOs Do? Time Use
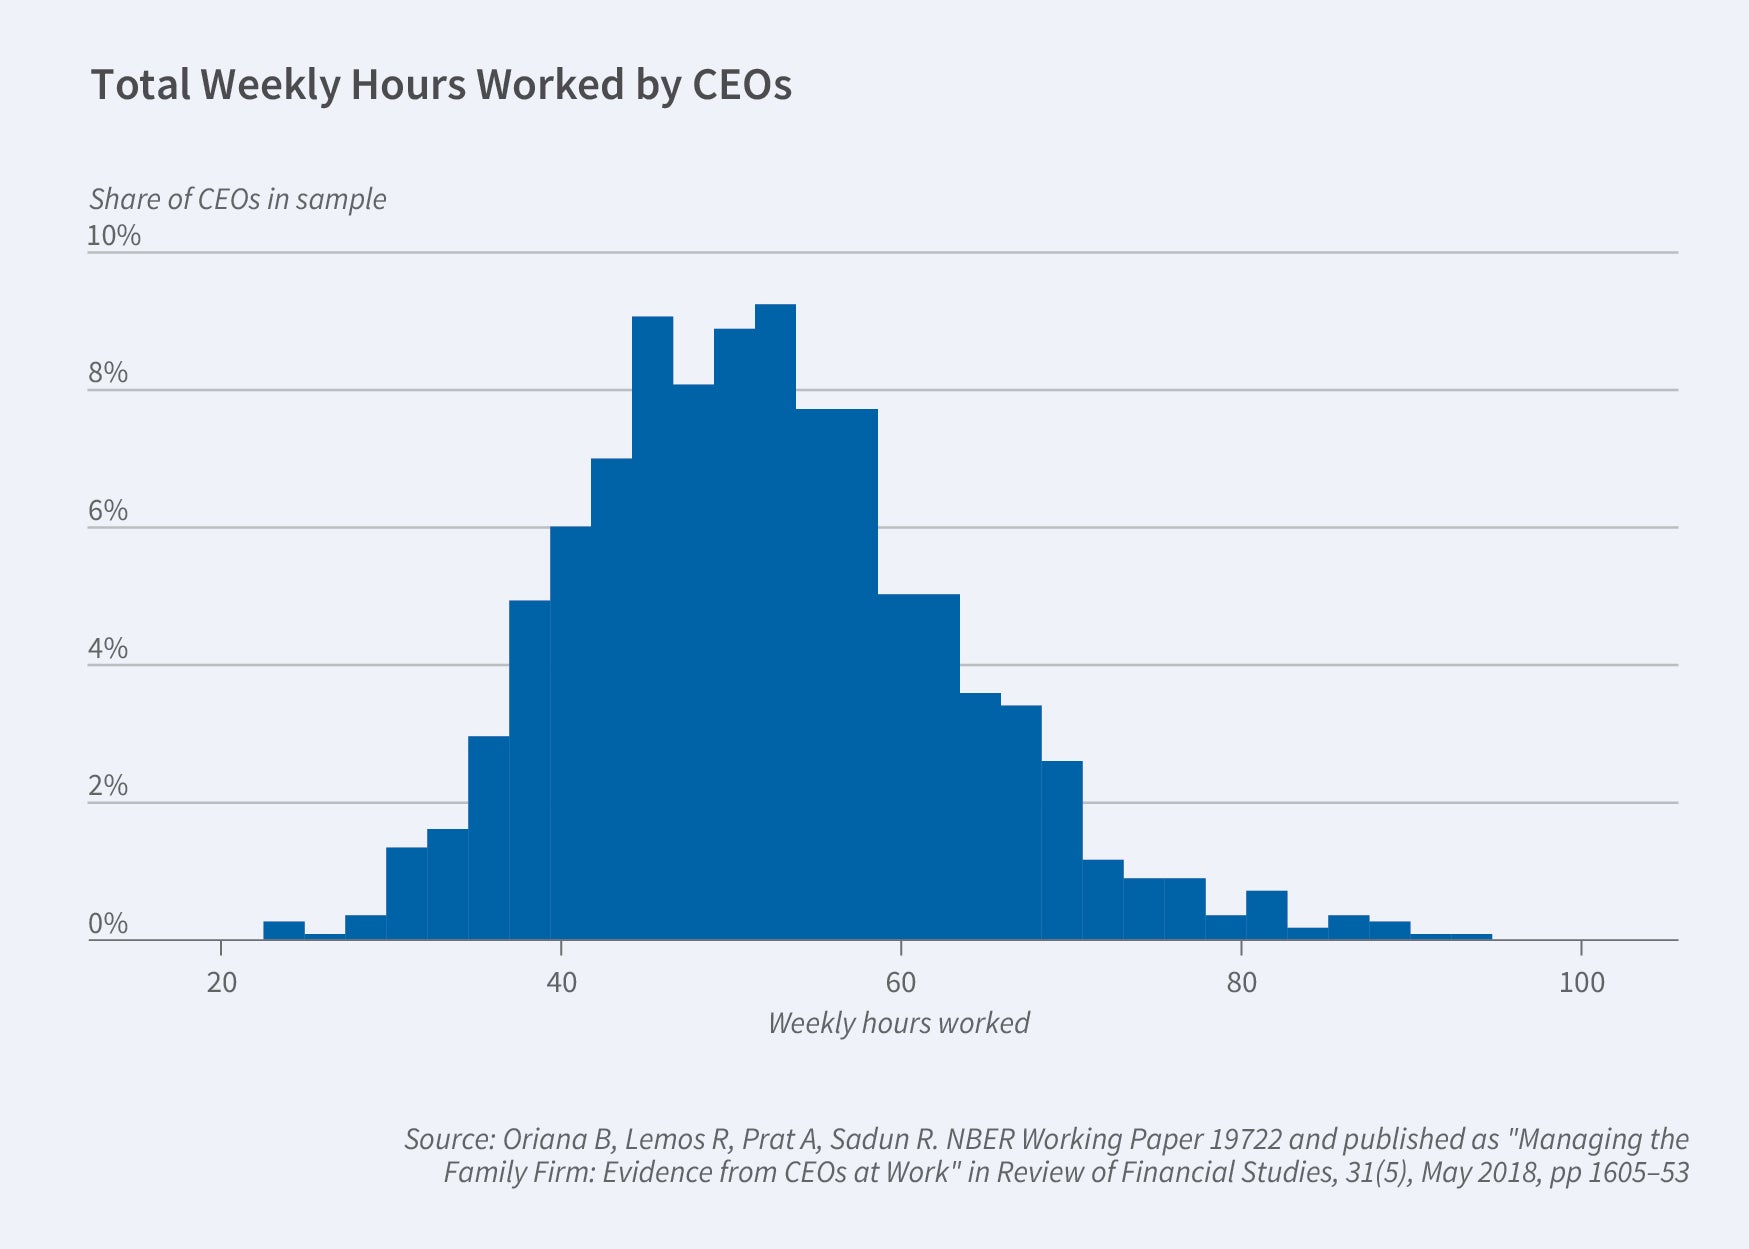
In a series of papers, Oriana Bandiera, Renata Lemos, Stephen Hansen, Andrea Prat, and I measured and studied differences in CEO behavior, looking at both hours spent working and time allocation across different activities.2 The notion that actual behavior could be an important factor of differentiation across managers is well accepted in the management literature,3 but the empirical examination of managerial time use has been somewhat elusive. To provide direct evidence on managerial behavior, we developed a new methodology to measure with unprecedented detail the time use of 1,114 CEOs in six countries. We scaled up traditional shadowing approaches — detailed observations of CEOs in action — by measuring CEOs’ diaries via daily calls with executives or their personal assistants during a random workweek. Overall, we collected data on 42,233 activities covering an average of 50 working hours per CEO. For each activity, we recorded the same five features: type (for example, meeting, plant/shop-floor visit, business lunch, or personal time), planning horizon, number of participants, number of different functions involved, and participants’ function (for example, finance, marketing, client, or supplier). The method allowed us to build a bottom-up measure of CEO effort by gauging the time spent on work-related activities during the week.
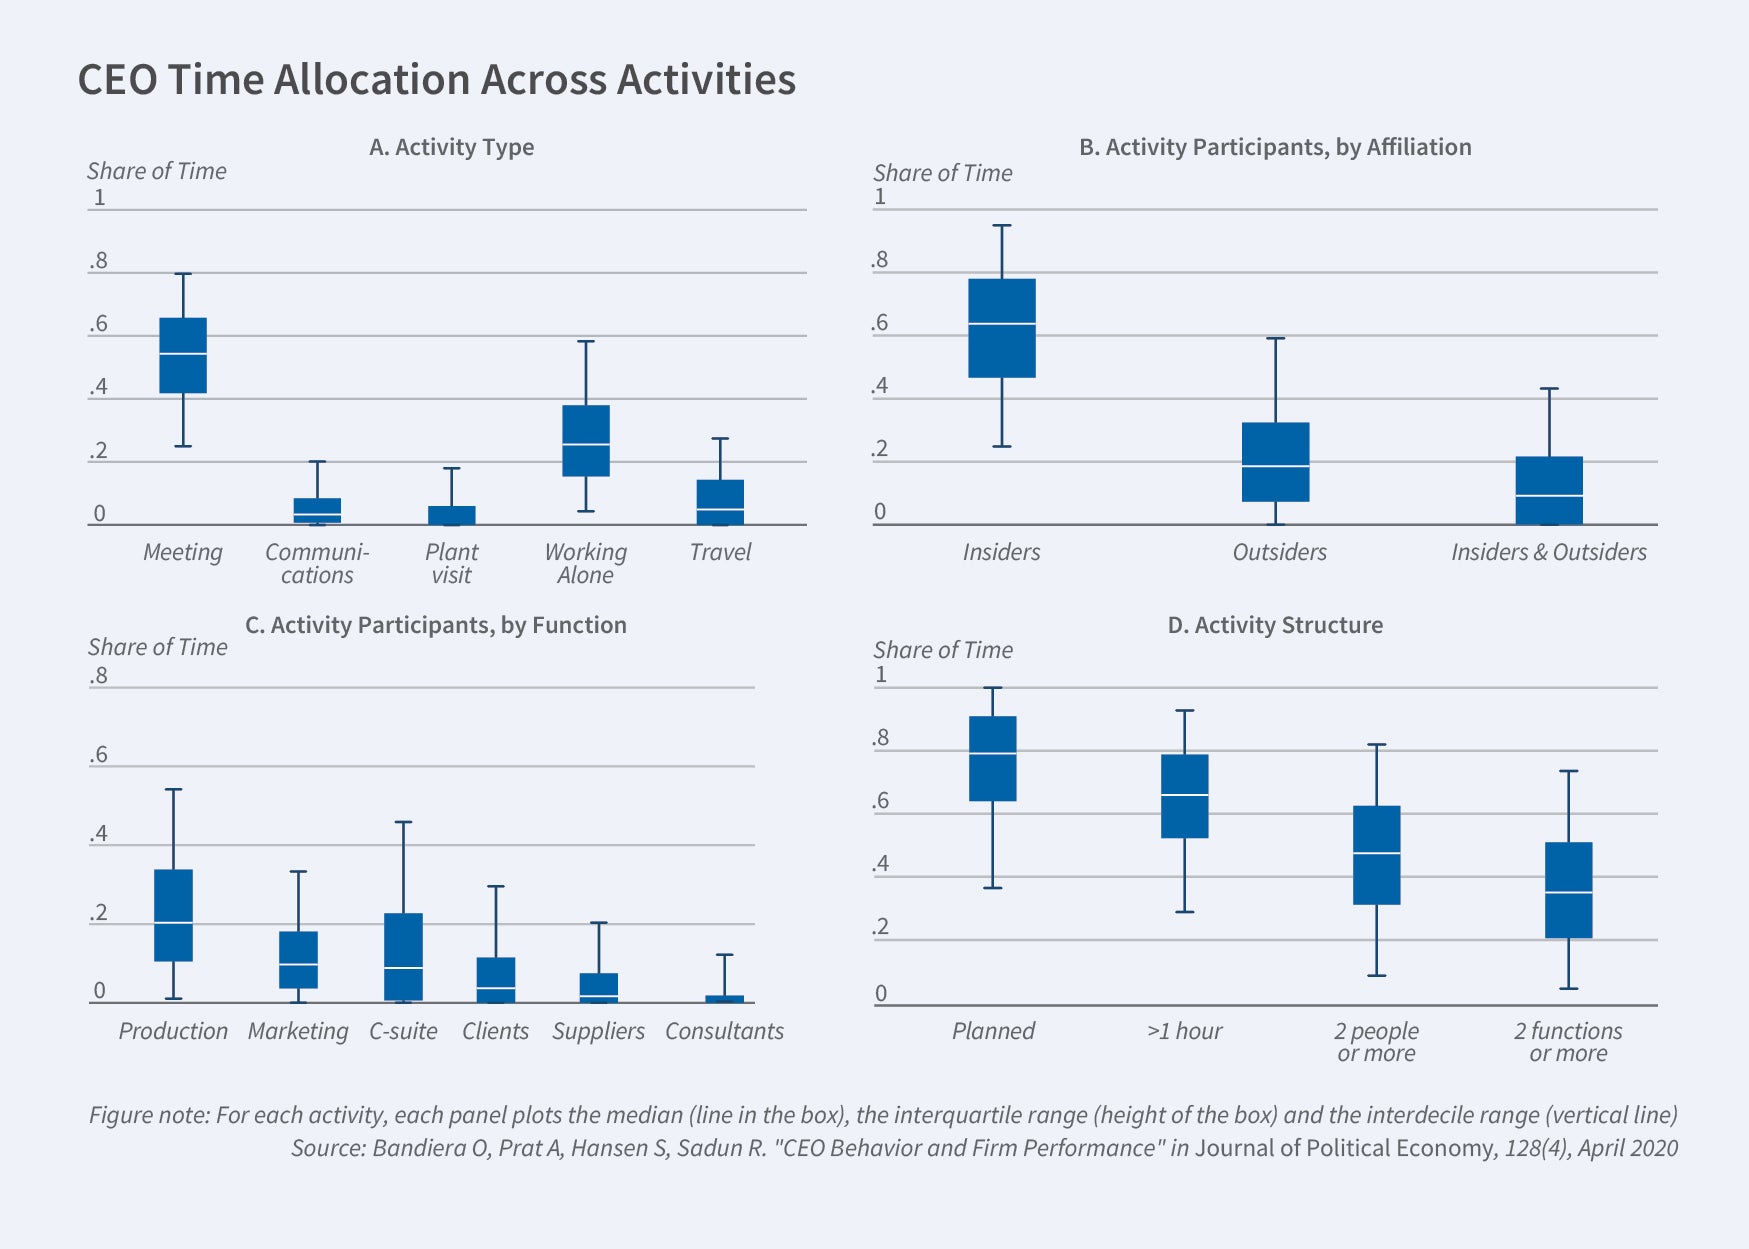
The data show wide variation in both CEO effort and time allocation. Figure 1 shows the distribution of hours worked across CEOs. Hours recorded vary from about 20 to nearly 100. Figure 2 provides a snapshot of differences in CEO activities. The work of CEOs mostly goes into meetings — more than 50 percent of working time at the median, involving both employees and outsiders. Even in this case, behaviors across CEOs vary markedly.
What explains these differences? Some of the variation in CEO labor supply is accounted for by differences in firm governance: family-business CEOs work 9 percent fewer hours than other firms’ CEOs, even conditional on formal qualifications and firm characteristics such as size and industry. Additionally, family-firm CEOs appear to be more likely to take time off when popular sporting events are being broadcast, and are less likely to work their usual schedules when snowstorms or other weather shocks make it more difficult to reach the office. Since differences in effort are correlated with firm performance — 18 percent of the performance gap between family and nonfamily firms is accounted for by differences in effort — the results suggest that potential profit opportunities may be lost in the pursuit of private benefits of control.
Examining differences in time allocation turns out to be a more complex challenge than analyzing CEO effort, since the wealth of information contained in the time diaries is too extensive to be easily compared across CEOs or correlated with other outcomes of interest, such as CEO and firm characteristics. To address this challenge, we use a machine learning algorithm (Latent Dirichlet Allocation) that projects the many dimensions of observed CEO behavior onto two “pure” behaviors — groups of related activities that together reflect a coherent, underlying behavioral profile. The algorithm finds the combination of features that best differentiates the sample CEOs. The first of the two pure behaviors is associated with more time spent with employees involved in production activities and in one-on-one meetings with firm employees or suppliers. The second pure behavior is associated with more time spent with C-suite executives and in interactions involving several participants and multiple functions inside and outside the firm. To fix ideas, we label the first type of pure behavior “manager” and the second “leader,” following a popular distinction described by John Kotter.4
Armed with a one-dimensional behavior index that represents each CEO as a convex combination of the two pure behaviors, we then study the correlation between CEO behavior, firm characteristics, and firm performance. We find that leader behavior is more common in large firms, multinationals, listed firms, and in sectors with high R&D intensity and production processes denoted by a higher incidence of abstract, rather than routine, tasks. We also find that leader behavior is more likely to be found in more productive and profitable firms. The correlation is economically and statistically significant: a one standard deviation in the CEO behavior index is associated with an increase of 7 percent in sales, controlling for labor, capital, and other standard firm-level covariates. In the absence of exogenous variation in CEOs’ assignment to firms, we cannot assume this relationship is causal — for example, CEOs may simply adapt their behavior to firms’ needs, and more productive firms may hire more leaders. However, two pieces of evidence go against this interpretation. First, pre-appointment trends in performance do not predict the appointment of a leader CEO; second, firms that hire a leader CEO experience a significant increase in productivity only after the CEO appointment, and this effect emerges gradually over time. That is, CEO behavior does not seem to be merely a reflection of differential pre-appointment trends or firm-level, time-invariant differences in performance.
The association between the CEO behavioral index and firm performance does not necessarily imply that all firms would benefit from hiring a leader CEO. In fact, the performance correlations emerging from the data are consistent with both vertical differentiation among CEOs — that is, that all firms would be better off with a leader CEO — and horizontal differentiation with matching frictions — that is, that some firms would be better off with leaders and others with managers, but not all firms needing a leader CEO are able to appoint one.
We develop and estimate a simple model of CEO firm assignment that encompasses both vertical and horizontal differentiation to test which is a better fit for the data. The model estimation is consistent with horizontal differentiation of CEOs with matching frictions: while most firms with managers are as productive as those with leaders, the supply of managers outstrips demand such that 17 percent of firms end up with the “wrong” type of CEO. These inefficient assignments are more frequent in lower-income countries (36 percent versus 5 percent of firms). The productivity loss generated by the misallocation of CEOs to firms accounts for 13 percent of the labor productivity gap between high- and low-income countries.
What CEOs Do Not Do: Delegation
Given the multitude and complexity of the activities performed inside organizations, it is essential for CEOs to be able to effectively delegate work. Effective delegation allows for more effective matching of problems with expertise and may increase empowerment and motivation of subordinates.5 Nicholas Bloom, John Van Reenen, and I explored the extent to which CEOs delegate decision-making authority to middle managers in a large cross-country survey of manufacturing firms.6 Our survey instrument, administered over the phone by a large team of trained interviewers, asked middle managers the maximum amount they could spend without asking permission from the central headquarters (CHQ) and their autonomy on four key domains of activity: spending, hiring, marketing, and product introduction. We find wide heterogeneity in delegation both across and within countries, as shown in Figure 3.
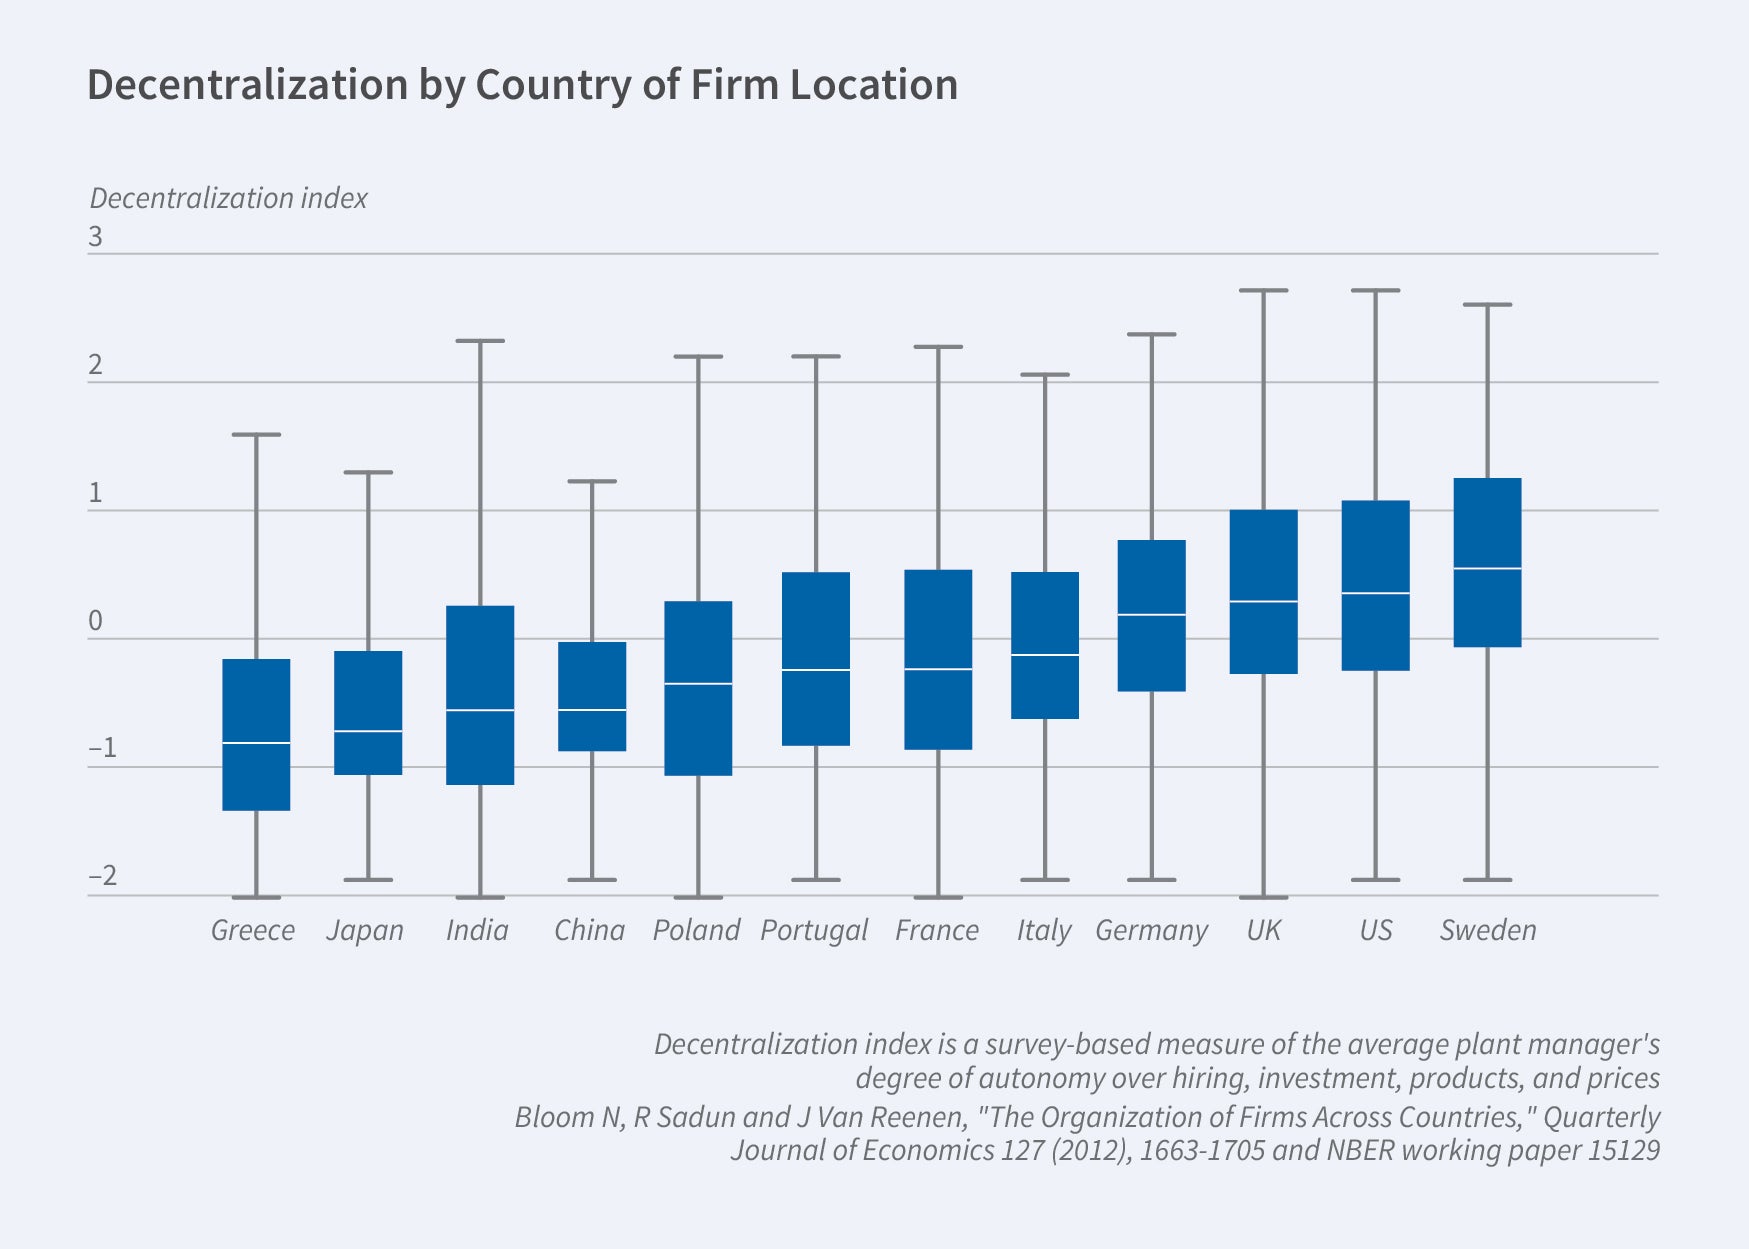
While some of this variation is related to firm characteristics — for example, delegation was much higher in larger plants — the data also suggest an important role for contextual factors external to the firm, and in particular the level of generalized trust in the area in which the firm CHQ is located. Firms in higher-trust regions are more decentralized and larger, and CHQ trust also predicts the level of delegation in subsidiaries, even when they are located in other regions or countries. We find that multinational subsidiaries located in a country that their parent country tends to trust, like the subsidiary of a French multinational in Belgium, are typically more decentralized than subsidiaries located in a country that the multinational’s parent country does not trust, like a French subsidiary located in Britain. Overall, these results suggest that external forces, and in this case some specific aspects of culture, may have powerful effects on CEOs’ willingness to delegate and, ultimately, on firm structure.
Even in the case of delegation, the data suggest the importance of matching CEO decisions to the specific needs of the firm. Philippe Aghion, Bloom, Brian Lucking, Van Reenen, and I study the performance effects of decentralization during the Great Recession, a time that coincided with a sudden increase in uncertainty in demand.7 Using two large microdatasets on decentralization in firms in the US and 10 OECD countries, we find that firms that delegated more power from the central headquarters to local plant managers prior to the Great Recession outperformed their centralized counterparts in sectors that were hardest hit by the subsequent crisis, as measured by the exogenous component of export growth and product durability. We interpret these results through the lens of a simple model of delegation, which provides support to the idea that decentralization provides firms with the necessary flexibility and local perceptiveness needed to respond to turbulent business conditions.
Strategy
A key prerogative of CEOs is setting firm strategy. Direct evidence on whether CEOs vary in their strategy “practices,” however, is scant. To make progress on this topic, Bloom, Michael J. Christensen, Jan Rivkin, M. J. Yang, and I examine how chief executives formalize, develop, and implement strategy in a sample of 262 Harvard Business School-educated CEOs.8 In spite of their common graduate education, there is tremendous variation in how strategy is approached — specifically how structured versus extemporaneous strategy practices are used by CEOs, both between and within industries. CEOs who use more-structured processes tend to lead larger and faster-growing firms. The data suggest that management education matters, as CEOs exposed to a curriculum that emphasized systematic analysis of the external environment — namely, the Harvard Business School first-year curriculum after the introduction of Michael Porter’s systematic analysis of competition — were significantly more likely than CEOs who were trained just before the change in curriculum to formalize their positioning against competitors. We also find that the more intense focus on strategy formalization may have crowded out attention to organizational practices related to strategy implementation.
Skills
In a separate line of research, Hansen, Tejas Ramdas, Joe Fuller, and I investigate the skill requirements needed to succeed in these top managerial positions using a large corpus of detailed and previously unexplored job descriptions for C-suite positions spanning 17 years.9 We classify the information contained in these documents using methods borrowed from machine learning, which allows us to map unstructured, free-text data into distinct clusters of skill requirements. We use the data to examine the variation in the demand for different managerial skills, which provides, to the best of our knowledge, the first direct evidence of C-suite skill requirements. Finally, we match the job description data with firm accounts and job postings for other occupations within the same firm and analyze the extent to which demand for social skills — a cluster that experienced sustained growth over time in CEO job descriptions — varies across firms. The results suggest that social skills are in especially high demand in larger, more complex, more IT-intensive organizations, consistent with the idea that social skills may facilitate the trading of expertise in the firm.10
Conclusions
CEOs play an increasingly important role in modern organizations, yet the nature of their activity and the mechanisms through which they may be able to affect firm performance often escape rigorous empirical investigation. The data that I helped build over the past few years show tremendous heterogeneity in CEO activities, delegation, decision-making approaches, and skill requirements. While the evidence supports the notion that CEOs matter for firm performance, it also suggests that this effect runs through the appropriate matching of CEOs to firms — that is, differentiation among CEOs is largely horizontal rather than vertical. This points to the crucial importance of understanding the mechanism through which CEOs are selected, and the governance of the CEO-firm relationship, which is essential to monitor fit and, if needed, to break bad matches.
Endnotes
"The Effect of Managers on Systematic Risk,” Schoar A, Yeung K, Zuo L. NBER Working Paper 27487, July 2022; “Managing with Style: The Effect of Managers on Firm Policies,” Bertrand M, Schoar A. The Q uarterly Journal of Economics 118(4), November 2003, pp. 1169–1208.
"Managing the Family Firm: Evidence from CEOs at Work," Bandiera O, Lemos R, Prat A, Sadun R. NBER Working Paper 19722, August 2017, and Review of Financial Studies 31(5), May 2018, pp. 1605–1653; “CEO Behavior and Firm Performance,” Bandiera O, Hansen S, Prat A, Sadun R. NBER Working Paper 23248, and Journal of Political Economy 128(4), April 2020, pp. 1325–1369.
The Effective Executive, Drucker P. New York: Harper and Row, 1967; The Nature of Managerial Work, Mintzberg H. New York: Harper and Row, 1973.
"What Leaders Really Do,” Kotter J. Harvard Business Review, December 2001.
‘‘Formal and Real Authority in Organizations,’’ Aghion P, Tirole J. Journal of Political Economy 105(1), February 1997, pp. 1–29.
"The Organization of Firms across Countries," Bloom N, Sadun R, Van Reenen J. NBER Working Paper 15129, August 2013, and The Quarterly Journal of Economics 127(4), November 2012, pp. 1663–1705.
“Turbulence, Firm Decentralization, and Growth in Bad Times,” Aghion P, Bloom N, Lucking B, Sadun R, Van Reenen J. NBER Working Paper 23354, October 2017, and American Economic Journal: Applied Economics 13(1), January 2021, pp. 133–169.
“How Do CEOs Make Strategy?” Yang M-J, Christensen M, Bloom N, Sadun R, Rivkin J. NBER Working Paper 27952, December 2020.
"The Demand for Executive Skills," Hansen S, Ramdas T, Sadun R, Fuller J. NBER Working Paper 28959, June 2021.
“The Growing Importance of Decision-Making on the Job,” Deming D. NBER Working Paper 28733, April 2021; “The Growing Importance of Social Skills in the Labor Market,” The Quarterly Journal of Economics 132(4), November 2017, pp. 1593–1640.


