Using Computational Linguistics to Identify Competitors and Competitive Interactions
Identifying competitors and analyzing competitive interactions is difficult in many markets. For well-defined markets with well-defined products, many examinations of competitors and markets can be done with traditional methods. However, firms increasingly operate in multiple markets. A given firm’s products may also differ sharply, both in their attributes and consumers, within markets. In addition, some firms may offer customized products or offer services along with physical products, increasing complexity. A firm’s product choice thus can involve multiple dimensions such as product differentiation and product quality. For all these reasons, identification of any given firm’s competitors and markets has become increasingly difficult.
Gerard Hoberg and I take a nonconventional approach to identifying and examining firm competitors and firm organization. We use natural language processing (NLP) of text to calculate firm pair-by-pair product similarity scores to build a new spatial, text-based network industry classification (TNIC).1 This new spatial representation can capture both horizontal and vertical industry connections among firms. Using these new text-based competitor and industry classifications, we along with other coauthors, examine mergers and acquisitions, vertical integration, entry threats by new firms, covariation in the stock market, and competition among patenting firms.
In a sequence of articles, we use multiple sources of text, including the business and product descriptions in firms’ 10-K annual reports filed with the Securities and Exchange Commission, product text in the input-output classifications from the Bureau of Economic Analysis (BEA), and patent text from US Patent and Trademark Office filings. Additional sources of text could also be incorporated into our network.
Text to Determine Competitors and Merger Synergies
We examine merging firms and their competitors in our early computational linguistics research.2 We take an agnostic view of markets and examine firms’ pairwise 10-K text-based product similarities to identify rival and complementary firms. Using NLP, we compute the product market similarity of each pair of firms using the product description text in firms’ 10-Ks and produce ranked competitors for each firm. Our text-based similarity measure gives a continuous related score indicating the actual degree of product word similarity. The relatedness score changes each year as the firms’ product descriptions change. Thus, the similarity scores are dynamic and continuous, capturing the degree of relatedness of two firms each year rather than just a “Yes/No” relatedness measure.
These relatedness measures are much better on multiple dimensions than Standard Industrial Classification (SIC) or North American Industry Classification System (NAICS) codes used extensively in economics, finance, and management. Hoberg and I show in our paper that in regressions of firm characteristics on industry grouping characteristics, our network codes can explain many accounting characteristics and outcomes such as merger relatedness significantly better than SIC and NAICS codes.3
There are two reasons SIC codes and NAICS codes can have severe misclassification problems. First, SIC and NAICS codes do not capture how related firms are because the codes are primarily based on how a product is made, rather than the end customer of that product. Second, the codes are updated infrequently and may be based on historical designations. Our measure is a continuous relatedness measure allowing product similarity and differentiation to be measured. It is updated each year and is firm specific.
These product market similarities enable us to rank a given firm’s closest product competitors to understand the incidence and outcomes of mergers and acquisitions. We show that firm pairs with very low or very high product similarity are both less likely to merge. The lower likelihood that we find for high-similarity firms possibly reflects rivals capturing some of the merger gains or antitrust concerns. Firms that are somewhat related are more likely to combine, and subsequently have more evidence of new product introductions, consistent with these firms having more opportunities for new products with product market synergies.
An illustration of these similarities is given in Figure 1. This graph shows the competitors of Disney and Pixar before Disney acquired Pixar. The large dashed circles give a visual depiction of Disney’s and Pixar’s 10 closest rival firms. For example, D5 and P5 indicate the firms that are the fifth-closest competitors to Disney and Pixar, respectively, based on their product similarity. D1 and P1, NewsCorp and DreamWorks, are the closest competitors to these two firms. Parentheses underneath indicate the SIC code assigned to that firm.
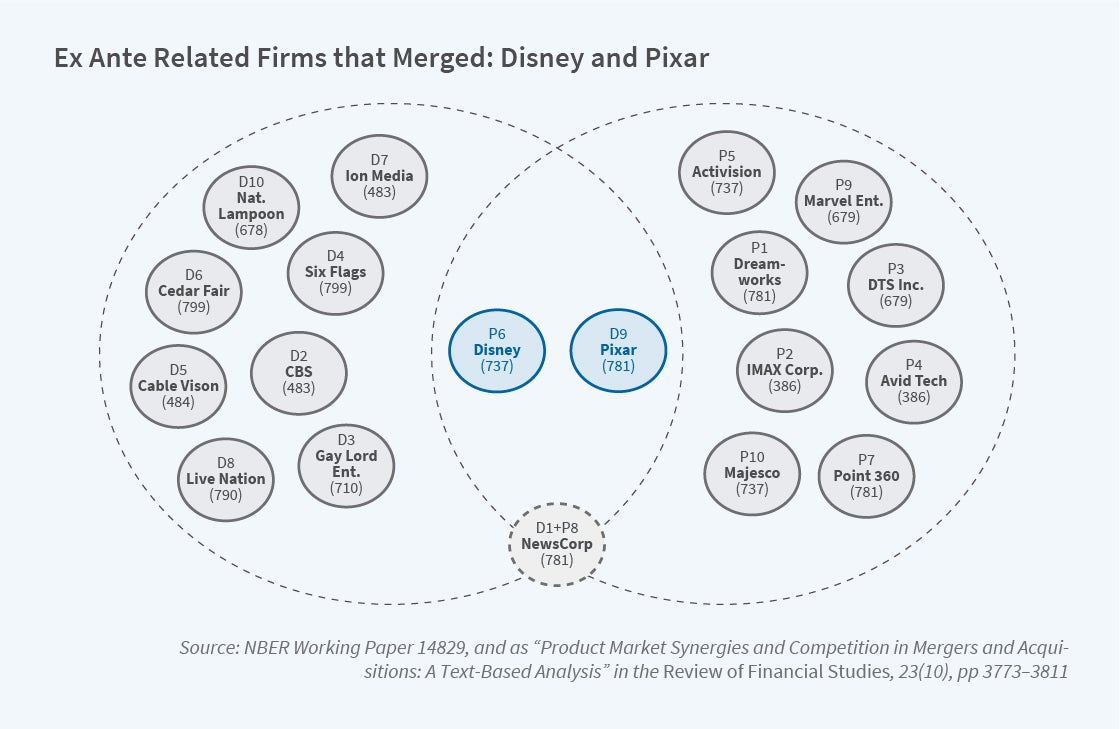
Despite these firms being highly related as indicated by their textual similarity, the SIC codes at the bottom of each circle show that many SIC codes for these firms don’t share similar first or second digits, and thus would not be considered competitors using traditional classifications. Disney acquired Pixar, and these firms were very related based on their products. Despite their intuitive similarities, this acquisition would have been classified as “unrelated” based on their SIC codes. Marvel Entertainment, which was later purchased by Disney, is classified by its SIC code as producing in 679, which is a miscellaneous investing code. However, all three merging firms make movies. We show that our text-based similarity scores classify related mergers much more accurately than SIC codes. Many mergers classified by SIC codes as between unrelated firms are actually between very related firms based on their product text.
Text-Based Network Industry Classification (TNIC)
We continue this work by creating a novel system to define markets and place competitors dynamically into a novel industry classification. Our industry classification can be represented as a time-varying, firm-specific spatial network of competitors.4 Our process uses the pair-wise similarities from the product descriptions to produce an NxN matrix of firm i, firm j similarity scores Ɵij. Each firm i has a score with every other firm j. Using a researcher decided cutoff competitors can be identified both close and far away. This comparative data can be visualized in a spatial format that shows clusters of firms making similar products, as well as concentrations of firms with less related products.
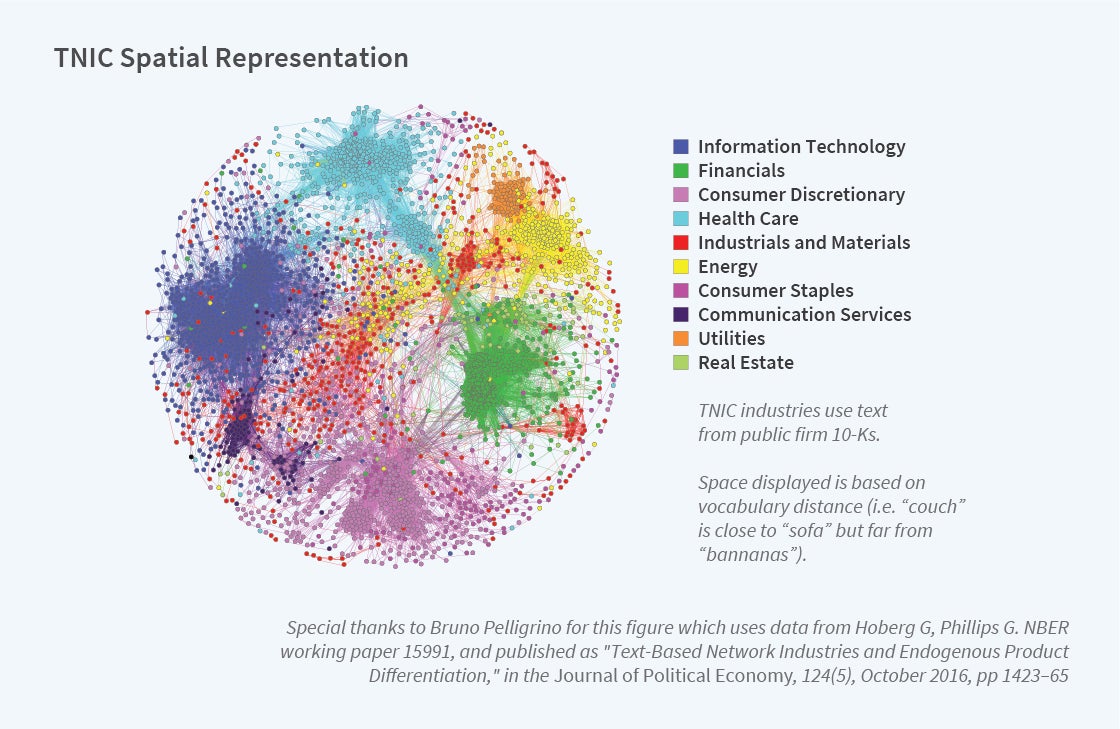
Spatial representation of the network allows us to plot these firms on the unit sphere in Figure 2. Using the similarity scores for one year, Figure 2 shows overlap with broad sector industry areas. We show the concentrations with labels indicating the predominant area, but firms can be far away from the broad concentration if they produce multiple products. Within broad sectors there is large variation in relatedness. In addition, this spatial representation is dynamic, varying year by year as firms and their products change. The result is a time-varying representation of how close firms are based on the products they sell.
Each year, we place firms into related text-based industry groups by assigning a given firm and its competitors to firm-specific networks based on minimum similarity scores between it and potential competitors. Competitors are thus firm specific and can be identified by their distance from one another in product vocabulary space.
We develop and test several implications of this spatial network. If there are too many firms close together, profits should be lower, because the firm has many competitors making similar products. If firms are far apart in their product text, we predict profits should be higher as they have more product differentiation. We test this prediction and indeed find that our measure of product differentiation based on text is a good predictor of corporate profits.
The text-based measure of product differentiation has also been used in many other studies to examine additional economic questions. Alexei Zhdanov and I show that R&D is higher in an active acquisition market, but innovation declines when potential acquirers are in concentrated markets as measured by TNIC market share consistent with the target’s bargaining power being lower in concentrated markets.5 Hoberg and I examine stock prices with these data, showing that stocks comove with their text-based industry competitors more than they do with regular SIC- or NAICS-code-based competitors.6 We also find that shocks to less visible textual network industry relatedness classification peers propagate with a lag to firms creating industry momentum. Minwen Li, Yao Lu, and I examine how industry competition impacts whether a powerful CEO should be appointed.7 Xi Li, Charles Xsu, Zhiming Ma, and I examine how our 10-K measures of competitors can help gauge analyst industry knowledge and the accuracy of analysts’ recommendations.8
Relative to existing classifications, these new text-based classifications offer economically large improvements in their ability to explain managerial discussions of competition and allow us to explain stock industry momentum and other accounting chrematistics, including profitability. They also allow us to identify more firms than managers mention as competitors. The underlying TNIC data and vertical integration data described here are available in the Hoberg-Phillips Data Library (http://hobergphillips.tuck.dartmouth.edu/), which has been visited by over 50,000 researchers since its inception.
Many other researchers have used our approach to classifying firms to analyze additional economic questions. For example, Bruno Pellegrino develops a Generalized Hedonic-Linear (GHL) demand system and estimates it using our TNIC product similarities.9 He shows that GHL elasticities align with state-of-the-art estimates from the empirical industrial organization literature and then nests this demand system in a general equilibrium model, where oligopolistic firms compete in a network of product rivalries. In this model, firm markups depend on a metric of centrality: in other words, a firm’s centrality in the network of product rivalries signals its market power or lack of market power.
Measuring Entry Threats
Hoberg, Nagpurnanand Prabhala, and I develop a new measure of competitive threats facing firms using analysis of product text in addition to text from IPO firms and venture-capital-financed firms.10 Our primary measure, product market fluidity, captures changes in rival firms’ products relative to a given firm’s products. The central idea is that when a firm operates in a market that is changing rapidly due to rivals’ actions — a fluid market — it faces more competitive threats. We also use the similarity of venture-capital-financed and IPO firms’ business descriptions and existing firms’ business descriptions to measure the entry threat posed by both VC-financed and IPO firms. Consistent with firms’ desire to preserve financial flexibility when competitive threats are high, increases in fluidity and entry threats reduce firms’ propensity to make cash payouts, especially for those with less access to financial markets. These results are consistent with firms’ financial policies being significantly shaped by product market threats and dynamics.
Constructing Measures of Vertical Integration
Laurent Frésard, Hoberg, and I examine vertical integration over time by mapping each firm’s 10-K product text onto the input-output matrix product words from the BEA manual, to measure vertical relatedness between firm pairs at a granular level.11 This method is illustrated in Figure 3.
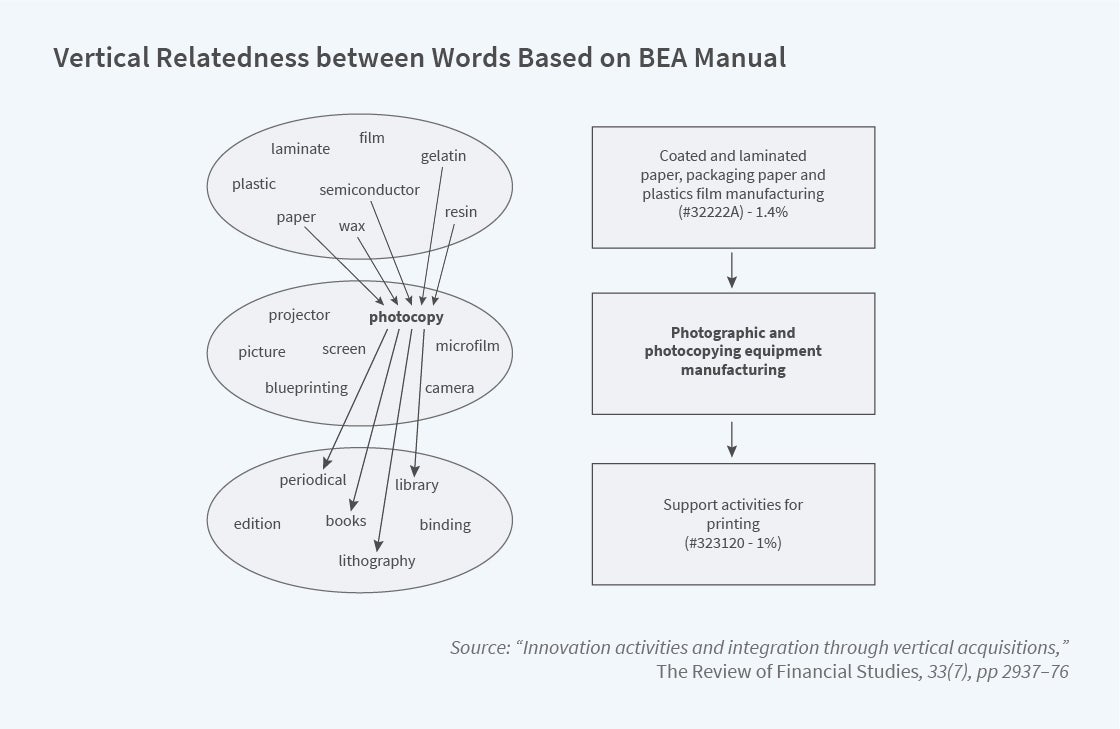
Each firm can be mapped into this network, along with firms it at some point might vertically integrate with. Using this time-varying measure of vertical integration along with relatedness between firm pairs, we produce a time-varying measure of actual and potential vertical integration. We find that when innovative assets require further development, vertically related firms are less likely to merge, consistent with it being optimal to leave control to the firms whose incentives are most important for innovation. When innovation is realized and protected by legally enforceable patents, however, incentives to invest in innovation by one party decline in importance, and we see vertical acquisitions that reallocate control to the other firm, thereby limiting holdup risk.
Analyzing Patent Text with Machine Learning
Recently, Utku Acikalin, Tolga Caskurlu, Hoberg, and I used NLP methods to examine the consequences of losing intellectual property (IP) protection.12 We examined a broad swath of firms affected by a major Supreme Court decision, Alice Corp. vs. CLS Bank. This decision greatly weakened patent protection for some firms with patents similar to the Alice patent; over 30,000 patents applied for prior to the Alice decision were subsequently ruled ineligible for patent protection. Using these patents, we trained a machine learning model and used it to identify existing patents that may also suffer decreased patent protection. We identified more than 60,000 patents from over 600,000 patents that we predict would be ruled ineligible if examined post-Alice. These patents span many large industrial groups, including business methods, software, and bioinformatics.
We find that small firms with exposure to the Alice decision experience an erosion of their market power, and subsequently more competition as measured by increased product market similarity with competitors in their 10-K product text. Consistent with competition encouraging innovation, these small firms respond by increasing their R&D expenditures.
Larger firms with large market share benefit from area-wide invalidations as their sales and market values increase while their acquisitions of other existing patenting firms decrease. They also litigate less and face less litigation following losses in IP protection. These results are consistent with firms with large market shares having more technological, financial, and managerial resources with which to protect their product market positions independent of patents.
Product-Market Scope for Multi-industry Firms
In recent work, Hoberg and I develop new firm-year measures of product market scope using the 10-K product text.13 We begin by classifying single-segment firms into industry vocabularies using multiple text-based tools as well as the NAICS products from the NAICS industry manual. Instead of using imperfect firm self-reported product segments, we assign larger firms to multiple industry areas using word overlaps with these industry vocabularies. We document that the average firm’s scope in related industries has increased steadily and by a total of 71 percent during our sample period, 1989 to 2017. Moreover, firms have increased scope without increasing the number of operating segments they report.
We find that increases in firm scope are related to mergers and acquisitions, spending on R&D, and increased vertical integration. Our results are consistent with an ongoing process of asset redeployment across and within firms, which is reinforced by innovation that facilitates flexible and efficient redeployment of assets for multi-industry production. Overall, our results support the emergence of more dynamic, technology-supported, multiproduct firms starting in the 1990s and growing in prevalence to present day. By producing related products without increasing operating segments, these new-age conglomerates can avoid potential agency conflicts associated with the diversified conglomerates of the 1980s.
Endnotes
“Text-Based Network Industries and Endogenous Product Differentiation,” Hoberg G, Phillips G. NBER Working Paper 15991, May 2010, revised February 2012, and Journal of Political Economy 124(5), October 2016, pp. 1423–1465.
“Product Market Synergies and Competition in Mergers and Acquisitions: A Text-Based Analysis,” Hoberg G, Phillips G. NBER Working Paper 14289, August 2008, revised February 2012, and The Review of Financial Studies 23(10), October 2010, pp. 3773–3811.
“Text-Based Network Industries and Endogenous Product Differentiation,” Hoberg G, Phillips G. NBER Working Paper 15991, May 2010, revised February 2012, and Journal of Political Economy 124(5), October 2016, pp. 1423–1465.
“R&D and the Incentives from Merger and Acquisition Activity,” Phillips G, Zhdanov A. NBER Working Paper 18346, August 2012, and The Review of Financial Studies 26(1), January 2013, pp. 34–78.
“Text-Based Industry Momentum,” Hoberg G, Phillips G. Journal of Financial and Quantitative Analysis 53(6), December 2018, pp. 2355–2388.
"CEOs and the Product Market: When Are Powerful CEOs Beneficial?" Li M, Lu Y, Phillips G. Journal of Financial and Quantitative Analysis 54(6), December 2019, pp. 2295–2326.
"Does Industry Competition Influence Analyst Coverage Decisions and Career Outcomes?" Li X, Hsu C, Ma, Z, Phillips G. Journal of Financial and Quantitative Analysis 54(6), January 2021, pp. 1-51.
“Product Differentiation and Oligopoly: A Network Approach,” Pellegrino B. University of Maryland Working Paper, 2019.
“Product Market Threats, Payouts and Financial Flexibility,” Hoberg G, Phillips G, Prabhala N. The Journal of Finance 69(1), February 2014, pp. 293–324.
“Innovation Activities and Integration through Vertical Acquisitions,” Frésard L, Hoberg G, Phillips G. Review of Financial Studies 33(7), July 2020, pp. 2937–2976.
“Intellectual Property Protection Lost and Competition: An Examination Using Machine Learning,” Acikalin U, Caskurlu T, Hoberg G, Phillips G. NBER Working Paper 30671, November 2022.
“Scope, Scale and Concentration: The 21st Century Firm,” Hoberg G, Phillips G. NBER Working Paper 30672, November 2022, and Tuck School of Business Working Paper 3746660, 2021.


