Program Report: Economic Fluctuations and Growth, 2019
Over the last decade, research in the Economic Fluctuations and Growth (EFG) Program has responded to important macroeconomic challenges. This report emphasizes four areas in which there have been significant developments. First, the global financial crisis has prompted research on the sources and propagation of financial crises, as well as on policy responses. Second, the general decline in business dynamism and lackluster productivity has reignited interest in economic growth analysis. Third, the surge in income and wealth inequality has generated new work on macroeconomic determinants of inequality. Fourth, with respect to methodology, there has been a growing recognition that so-called "representative agent" models are not sufficient for addressing many key macroeconomic issues. This has led to the development and increased use of heterogeneous agent models. This report summarizes recent research in each of these areas.
1. The Great Recession, Financial Crises, and Policy Responses
Researchers affiliated with the EFG program have analyzed both the financial crisis and the policy responses extensively. Roughly one tenth of recent EFG working papers have been devoted to these issues.
Theoretical and empirical work on financial crises predates the Great Recession. This work emphasized the role of borrower balance sheets in constraining credit access when capital markets are imperfect. It then associated financial crises with a kind of "adverse feedback loop" in which declines in real activity weaken borrower balance sheets, which in turn further depress spending and real activity. The emphasis was on borrowing frictions faced by nonfinancial firms. However, the evidence from the recent crisis suggests that the key conduits of financial distress were mainly highly leveraged households and highly leveraged shadow banks. While nonfinancial firms eventually felt the brunt of the financial distress, it was a dramatic buildup of leverage in the housing and shadow banking sectors that made the economy vulnerable to financial collapse.
There is now a rough consensus that there were two main channels of financial distress. The first, which we call the "household balance sheet channel," features the impact of declining house prices on households' net financial positions, and in turn on their credit access and spending. The second, which we term "the banking distress channel," features the effect of weakening of bank balance sheets on credit intermediation.1 Of course the two channels are interrelated, as the sources of the financial distress in banking stemmed from losses on mortgage-related securities that eventually led to a full-scale panic.
• The Household Balance Sheet Channel
Partly because of how the data was unfolding in real time during the crisis, much of the early research emphasis was on the household balance sheet channel. The origins of the crisis involved an extraordinary housing boom, featuring a dramatic run-up in home prices and mortgage debt. Among the factors triggering the boom were: a secular decline in mortgage rates due to a combination of declining long-term interest rates and innovation in mortgage finance, relaxation of lending standards, and widespread optimism about housing prices.
What we have learned to appreciate since is that the pre-crisis housing boom was not unique to the 2007 U.S. experience. Across both countries and time, it is typical for run-ups of both household debt and housing prices to precede major financial crises. For example, Òscar Jordà, Moritz Schularick, and Alan Taylor document that the run-up in household mortgage debt occurred across countries as a precursor to the recent global financial crisis.2 Arvind Krishnamurthy and Tyler Muir, in related work, find that not all household debt booms lead to crises, but that those accompanied by increasing credit spreads are more likely to do so.3
What initially triggers the crises that follow a run-up in household debt, including the recent one, is a contraction in house prices. According to the household balance sheet channel, the drop in house prices weakens the balance sheets of households highly leveraged with mortgage debt. In turn, there is a significant decline in household spending.
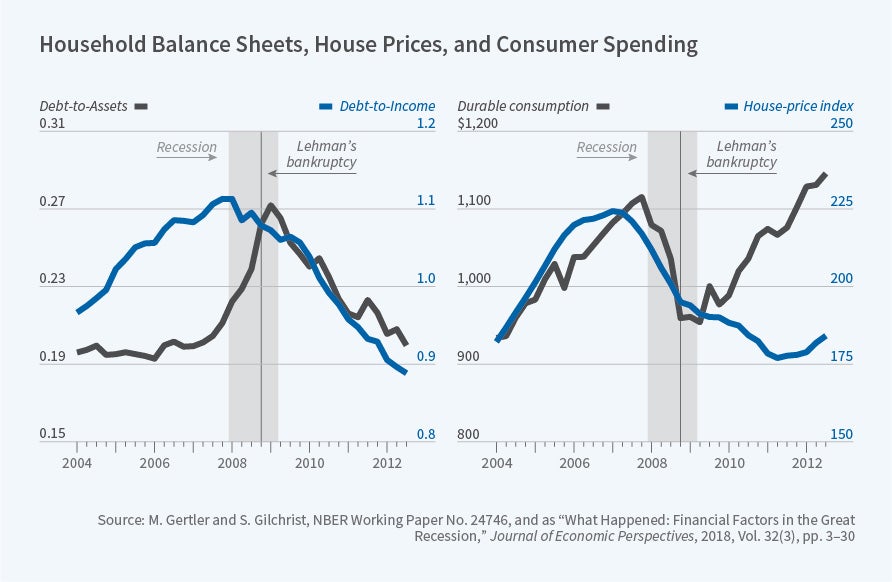
The descriptive evidence suggests that a household balance sheet channel was a key conduit of financial distress during the Great Recession. The left panel in Figure 1 shows the behavior of household debt to income (the blue line) versus debt to assets (the gray line) over the period 2004 to 2012. The right panel shows house prices (the blue line) and consumer durable consumption (the gray line). In each panel the shaded band is the recession and the solid vertical line is the date of the Lehman bankruptcy. Preceding the crisis there is a roughly 20 percent run-up of household debt as a percentage of income. The debt-to-assets ratio remains stable until 2007, reflecting that home prices increase along with debt. However, as home prices decline starting in early 2007, the household debt-to-assets ratio sharply increases. The weakening of household balance sheets, in turn, leads to a sharp drop in spending on consumer durables.
With aggregate data, however, it is difficult to identify causality. Aggregate housing prices could be responding to the decline in real activity, as opposed to influencing it. In a series of highly influential papers, Atif Mian and Amir Sufi use cross-sectional data to identify the household balance sheet channel.4 They first show that regions which experienced the largest run up in home prices and mortgage debt in the years prior to the crisis suffered the largest drops in home prices and real activity once the crisis hit. For the crisis period, they estimate cross-sectional regressions that relate some measure of real activity — for example, consumption or non-tradable employment — to the decline in household net worth, where the latter is measured by the rate of decline in home prices weighted by household leverage at the beginning of the crisis. They identify exogenous variation in household net worth using an instrumental variable based on local land supply elasticity. Because the regression is cross-sectional and time effects are removed, it is not possible to identify the aggregate effects of the household balance sheet channel. Nonetheless, the results provide persuasive evidence of the existence of a household balance sheet channel.5
The empirical work on the household balance sheet in turn motivated a vast theoretical literature that modifies macroeconomic models to allow for balance sheet constraints on households. As with models developed before the crisis, these models feature adverse feedback loops between borrower balance sheets and real activity, but they put households, rather than non-financial firms, at center stage. One interesting auxiliary finding is that the tightening of balance sheet constraints on household borrowers not only reduces household spending, it also pushes down interest rates, helping account for how household financial distress could move the economy into a liquidity trap, where the zero lower bound on the nominal interest rate binds.6
• Banking Distress and the Real Economy
The mirror image of the sharp increase in household indebtedness portrayed in Figure 1 was a sharp increase in the leveraging of the banking system, particularly the shadow banking system that operated outside the direct regulatory control of the Federal Reserve. The right panel in Figure 2, on the next page, illustrates the behavior of the liabilities of broker/dealers — the investment banks that were the main actors in the shadow banking sector. The growth of the shadow banking sector financed the sharp increase in mortgage-related securities, a product of the housing boom described earlier. Importantly, while the assets held by these institutions were mainly long-term, the liabilities were mostly short-term. With the benefit of hindsight, this maturity mismatch made them vulnerable to panic. The downturn in house prices portrayed in Figure 1 not only weakened household balance sheets, it induced losses in mortgage-related securities held by both shadow and commercial banks. The highly leveraged and lightly regulated shadow banking sector was particularly vulnerable. The losses on mortgage-related securities led to panic in markets for wholesale short-term funding, culminating in the failure of Lehman Brothers and the investment banking collapse.7 The collapse in broker/dealer liabilities portrayed in Figure 2 was the product of these events.
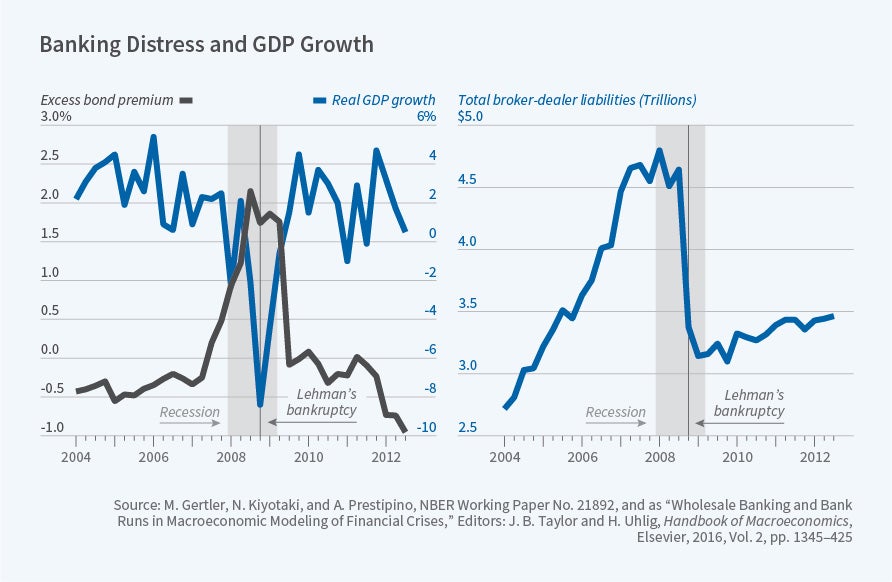
The role of the banking distress channel demonstrates that the weakening of bank balance sheets over the crisis induced a contraction in intermediation, raising the cost of credit and thus weakening real activity. As with the household balance sheet channel, the aggregate data provide some suggestive support. The left panel in Figure 2 plots GDP growth against a measure of financial distress, the excess bond premium (EBP) developed by Simon Gilchrist and Egon Zakrajšek8.The EBP measures the spread between the rate of return on corporate bonds and on similar maturity government bonds, but with the default premium removed. The latter adjustment implies that increases in the EBP reflect elevation in the cost of credit as opposed to signals of increasing default. As Figure 2 shows, the beginning of the recession features relatively modest declines in output growth and increases in the EBP. In the summer of 2008, the recession appeared similar to the relatively mild downturns of 1990–91 and 2001–02. However, as Figure 2 makes clear, closely correlated with the Lehman collapse is a sharp increase in the EBP along with a sharp contraction in GDP growth. This broad connection of banking disruption, rising credit costs, and declining real activity is highly suggestive of a banking distress channel.
Once again, to establish causality it is necessary to go beyond the aggregate data. A number of microdata studies have shown how the banking distress induced contractions in real activity. As with the work on the household balance channel, the work on banking distress exploits cross-sectional variation to identify variation in banks' financial health that was unrelated to borrower quality. It then compares the behavior of borrowers who had relationships with financially stressed banks with those whose banks were in good financial health. For example, Gabriel Chodorow-Reich finds that firms that borrowed from commercial banks with exposure to Lehman Brothers experienced a much sharper contraction in employment than banks not directly exposed.9 He shows further that the effects due to banking distress account for a significant fraction of the overall employment decline.
The banking crisis prompted a stream of research that incorporated banking in macroeconomic models, a feature conspicuously absent from pre-crisis models. A common dimension of the work was to introduce balance sheet constraints on banks stemming either from regulation or incentive problems between banks and their creditors. In these models, losses on loans induce a decline in equity, weakening the banks' balance sheets, inducing a tightening of credit and in turn a reduction in real activity. In this respect, the models capture the basic way in which financial distress played out during the Great Recession.10
Work following the initial wave of new research on banking focused on another important aspect of the crisis, namely the high degree of nonlinearity. Krishnamurthy, Stefan Nagel, and Dmitry Orlov note that financial crises feature sharp increases in credit spreads and sharp contractions in asset prices and output, which is consistent with the evidence presented in Figure 2.11 There is no symmetric movement in these variables during booms. One way to introduce nonlinearity is to assume that balance sheet constraints bind only occasionally, as in work by Enrique Mendoza and also work by Zhiguo He and Krishnamurthy. 12 During booms the constraints are slack. However, a negative disturbance can move the economy into a region where the constraints are binding, amplifying the effect of the shock on the downturn. In contrast, recent work captures the nonlinearity by allowing for banking panics in the form of a rollover crisis, a situation in which suppliers of short-term debt in panic-like fashion decide to not roll over their loans to banks.13 This kind of panic was a central feature of the crisis.
As to why the recovery from the banking crisis was so slow, Carmen Reinhart and Kenneth Rogoff argue in a classic study that the process of deleveraging by borrowers can lead to prolonged periods of low spending.14 Robert Hall argues that the contraction in investment spending during the Great Recession was large enough to generate a nontrivial reduction in the capital stock.15 Finally, Hall, John Fernald, James Stock, and Mark Watson argue that the slow recovery was mainly the product of bad luck with some contractionary fiscal policy mixed in. The bad luck was a productivity slowdown that began in 2005, several years before the Great Recession, and is still continuing.16
• Policy Responses to the Crisis
Research has not only focused on improving our ability to analyze financial crises, but also on analyzing policy responses. For example, a key new tool the Federal Reserve used to combat the crisis was unconventional monetary policy, which involved adjusting the size and composition of its balance sheet. The prime example, popularly known as quantitative easing, involved purchasing agency mortgage-backed securities, agency debt, and long-term government debt, and funding these acquisitions by issuing short-term government debt in the form of interest-bearing government debt. With perfect financial markets, unconventional monetary policy is neutral: government intermediation of long-term securities simply displaces private intermediation with no effect on security prices and interest rates. During the Great Recession, however, the financial distress induced a contraction in investment banking, raising credit costs by elevating both credit spreads on private securities and term premiums on long-term bonds. In this kind of environment, unconventional monetary policy can be effective in reducing credit costs. Indeed, purchases of securities funded by interest-bearing reserves can be thought of as increasing government financial intermediation to offset the contraction of private intermediation. By doing so, it reduces both credit spreads and term premiums that had been elevated due to the crisis.17
In addition to research on how policy can respond as the crisis unfolds, there has also been work on regulatory policies designed to limit the likelihood of a crisis ex ante. Some of this work has focused on leverage restrictions on households in order to limit the possibility of the kind of large run-up of consumer debt that was a feature of the crisis.18 Most of the work, though, has focused on the effects of regulatory capital requirements on banks.19 A tradeoff that emerges is that tighter capital requirements reduce the likelihood of a crisis but also lower output, on average, due to the constraint on intermediation. In many settings, countercyclical capital buffers appear optimal. That is, if the goal is macroeconomic stability, capital requirements should be raised in good times and relaxed during recession. The high capital requirements force banks to build up a buffer that cushions them against negative shocks. Relaxing capital requirements in bad times permits more intermediation and thus reduces credit costs, facilitating the recovery.
Finally, the crisis forced us to think further about conventional monetary and fiscal policy. For monetary policy, the challenge was confronting the zero lower bound (ZLB) on the nominal interest rate. Earlier research suggested that a central bank could use forward guidance to manage expectations of the future path of the policy rate in this kind of environment. A general finding is that when the central bank is confronting a liquidity trap, expansionary policy involves a promise to keep rates "lower for longer," that is, keep them low beyond the point at which the ZLB is not binding.20 Lengthening the expected period of low rates provides stimulus to the economy by reducing longer-term rates.
The existing models suggest a counterfactually powerful effect of forward guidance. This conundrum, dubbed the "forward guidance puzzle," has attracted considerable attention because, among other things, it suggests that the standard models may not be trustworthy for analyzing policy that relies on managing private-sector expectations. Some researchers have argued that allowing for financial market frictions can address the puzzle, while others suggest a behavioral or incomplete information approach to introduce myopia.21 Emmanuel Farhi and Iván Werning argue that a combination of financial fractions and myopia is needed to produce plausible quantitative results.22
Finally, given constraints on monetary policy, fiscal policy provides an option when the economy hits the ZLB. A key question is the interaction between fiscal policy and the ZLB. It is possible at the zero lower bound to increase the fiscal multiplier due to the feedback effect of inflation on the real interest rate, with the nominal interest rate unchanged due to the ZLB.23 Emi Nakamura and Jón Steinsson provide evidence using state data that accommodative monetary policy increases the fiscal multiplier.24 There is also some empirical evidence suggesting that fiscal multipliers are stronger in recessions.25
2. Economic Growth
Economic growth is a thriving topic of inquiry. This section highlights two findings in particular. The first is declining business dynamism amidst lackluster productivity growth. The second is substantial — perhaps growing — misallocation of capital and labor across firms and establishments.
• Declining Dynamism and Lackluster Growth
Productivity growth — as opposed to growth in human and physical capital — is the main force behind rising output per worker hour.26 Firms, in turn, are key contributors to productivity growth. Those firms that successfully innovate survive and grow. Those that fail to innovate shrink and die. The rise and fall of firms is considered an essential byproduct of progress. This notion goes back to Joseph Schumpeter's conception of creative destruction.27 In this vein, a major finding is that the entry and exit rates of firms and establishments have been falling in the United States in recent decades.28 A corollary is that reallocation of labor across firms and establishments has slowed.29 Young firms tend to grow faster than older firms, even conditional on size.30 And young firms appear to be more innovative than older firms in the sense of patenting more per unit of employment and receiving more citations to their patents.31 Falling entry rates and exit rates, combined with falling reallocation among incumbents, are consistent with falling rates of creative destruction and innovation by entering firms and establishments.
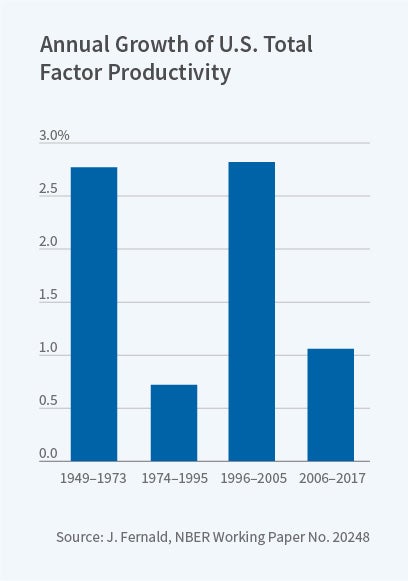
Figure 3 shows that productivity growth has ebbed and flowed in the United States over the last 70 years. After exceeding 2.5 percent per year in the period 1949-73, growth slowed to less than 1 percent per year in 1974-95 — the infamous productivity growth slowdown. Growth surged to above 2.5 percent again for a decade beginning in the mid-1990s, largely fueled by industries producing and using information technology.32 Since 2005, however, growth has faltered again, to about 1 percent per year.
Declining business dynamism is one reason for the meager productivity growth.33 But it may not be the primary contributor, at least not directly.34 Incumbent firms do most R&D and patenting, and most growth appears to come from quality improvements by incumbents on their own products.35
A leading view is that the slowdown is a byproduct of slowing population growth.36 It appears that ideas are getting harder to find as the level of technology attained rises.37 In this view, growth has been maintained through rising research effort. Population growth feeds this by providing more talent to search for new ideas and by expanding the size of the market for selling products embodying those ideas. A contrarian view holds that the slowdown itself is illusory because growth is increasingly difficult to measure. But measuring growth has always been challenging.38 Official measures may understate growth, but not increasingly so.39
• Misallocation
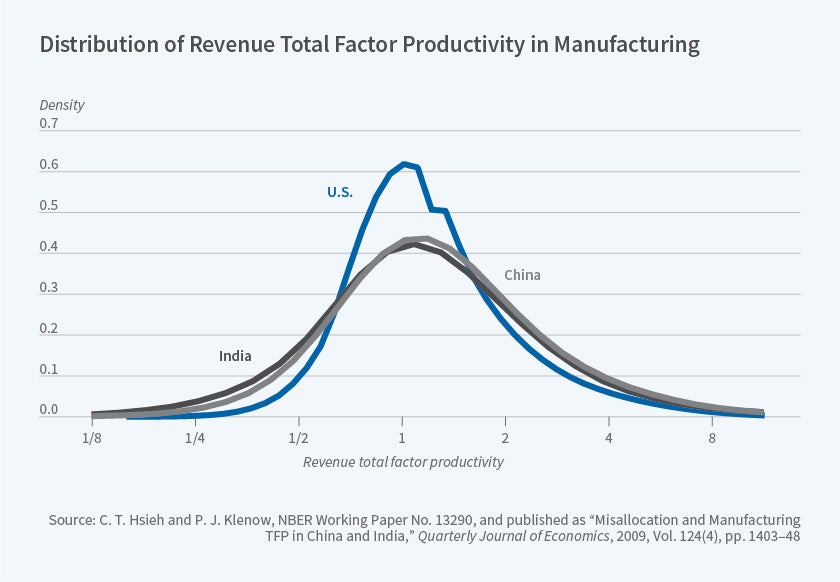
In addition to innovation within firms, the level of U.S. productivity reflects the efficiency with which capital and labor are allocated across a given set of firms.40 There are large differences in the ratio of revenue to inputs across firms and establishments, which may reflect gaps in the value of marginal products and therefore misallocation.41 Such gaps are best documented in manufacturing and, as Figure 4 suggests, are larger in China and India than in the United States.42
The gaps may stem partly from adjustment costs that are technologically avoidable and hence do not represent misallocation.43 But the gaps are too persistent to reflect adjustment costs alone.44 Misallocation may contribute to both differences in levels and growth rates of productivity across countries.45 Financial frictions are one possible source of misallocation.46 Financial frictions, like adjustment costs, might be expected to have transitory effects on the allocation of inputs in the absence of ongoing idiosyncratic shocks.47
Another possible source of misallocation is markup dispersion.48 Price-cost markups could differ persistently across firms or even establishments within firms. Because markups may differ even within industries, they can cause larger allocative distortions than cross-industry markup dispersion.49 Even average markups can distort intermediate inputs and labor supply.50 Rising markups have been tied to the declining fraction of national income going to workers, in the U.S. and elsewhere.51
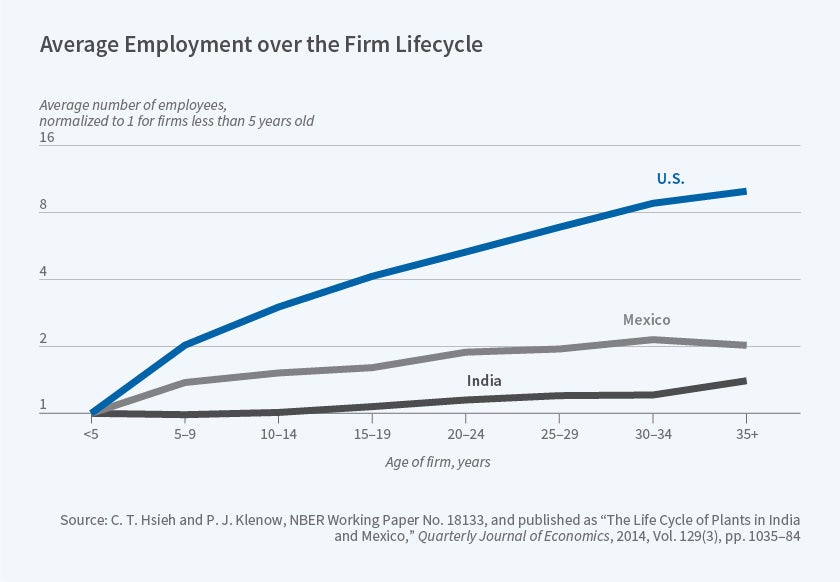
Static misallocation of inputs can, in turn, undermine dynamic incentives to increase productivity and expand into more establishments.52 Firms may exhibit slower growth over their life cycle if they face frictions in hiring and/or firing workers and in financing capital.53 Figure 5 shows that, conditional on survival, establishments grow faster in the United States than in Mexico and India.
Misallocation can take many other forms, such as the allocation of crops to farmland, the allocation of land to farmers, and the allocation of talent across occupations. And declining discrimination against women and African Americans may have boosted U.S. growth for much of the past 50 years.54
3. Income and Wealth Inequality and Macroeconomics
Over the last three decades, macroeconomists have become more interested in the study of inequality. The links between the distributional dynamics of income, human capital, and financial wealth, and their aggregate dynamics now constitute a vast area of research with clear relevance to current policy concerns.
Recently, the field has increasingly (and naturally) shifted toward empirical and quantitative studies, thanks to increasingly sophisticated data and methodologies. At the same time, it retains strong links with the theoretical work carried out earlier. This section highlights recent advances and findings in four areas: long-run trends and recent dynamics of income and wealth distributions; links between human capital, social mobility, and residential segregation; technological change and labor market institutions; and the effects of specific policy reforms.
• Long-run Trends and Income and Wealth Dynamics
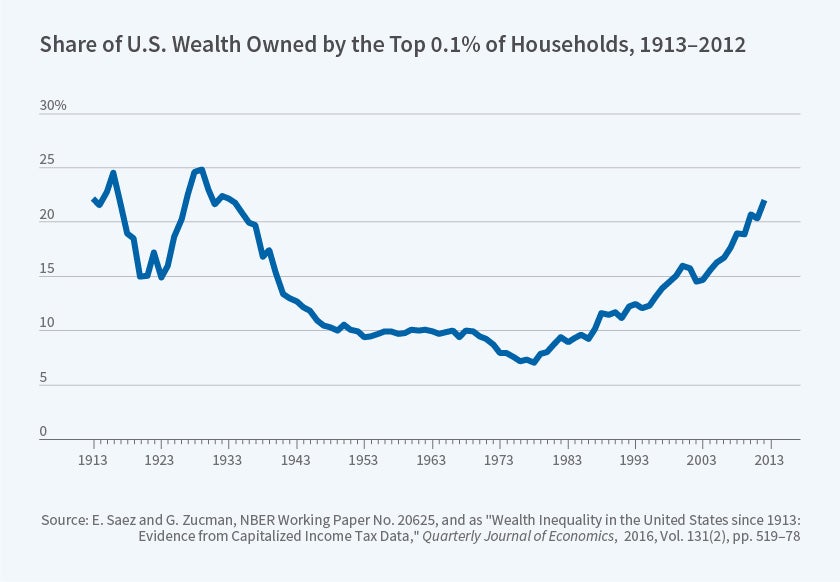
While many studies document trends in income inequality, it is difficult to find reliable data spanning long periods on wealth inequality. Emmanuel Saez and Gabriel Zucman55 estimate its evolution in the United States since 1913 by combining individual income tax returns with macroeconomic household balance sheets and capitalizing reported incomes [Figure 6]. Wealth concentration was high early in the 20th century, then fell from 1929 to 1978, and has continuously increased since. The top 0.1 percent's wealth share rose from 7 percent in 1978 to 22 percent in 2012, about as high as it was in 1929. High wealth today tends to be associated with high income much more than in the past. An increase in saving-rate inequality is also documented to be an important factor.
Xavier Gabaix, Jean-Michel Lasry, Pierre-Louis Lions, and Benjamin Moll ask whether standard random-growth models for the evolution of the income distribution can be modified to explain the large increase in the upper tail of the distribution.56 Two departures from the standard framework help: heterogeneity in the "type" of different individuals, and "scale dependence." The first admits the possibility that some individuals — such as entrepreneurs — can attain higher returns on their wealth than the rest of the population. The second allows for multiplicative shocks to the income distribution that can have large effects on high incomes, rather than just additive shocks, which tend to have smaller effects in producing very high incomes. The framework is tractable and yields an analytical characterization of the speed of convergence of the cross-sectional income distribution. In a related study, Jess Benhabib, Alberto Bisin, and Mi Luo match a parsimonious macroeconomic model to key moments of the distribution of wealth and the social-mobility matrix.57 This allows them to disentangle the contribution of three factors, all of which are found to be important in replicating the thick upper tail of incomes and the observed extent of social mobility: heterogeneous and random returns to wealth, heterogeneity in savings, and capital-income risk.
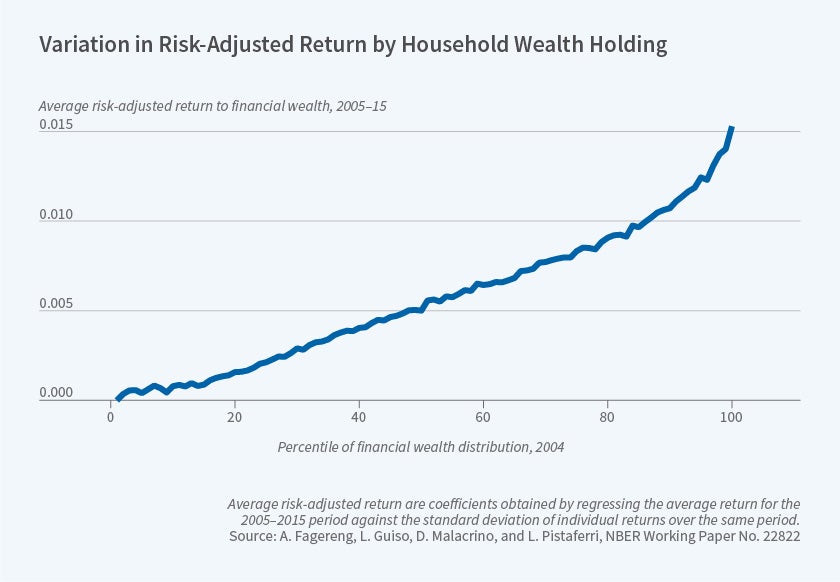
These findings align well with those of an empirical study by Andreas Fagereng, Luigi Guiso, Davide Malacrino, and Luigi Pistaferri.58 Using tax records from Norway, their study documents significant heterogeneity in the returns investors earn on their assets. Interestingly, this does not solely arise from different portfolio allocation between safe and risky assets: Returns are heterogeneous even within asset classes, and moreover they are persistently positively correlated with wealth [Figure 7]. All of these studies conclude that heterogeneous returns to wealth are an important determinant of persistent wealth inequality.
A number of studies have focused specifically on the distributional effects of the Great Recession, particularly for low incomes. Dirk Krueger, Kurt Mitman, and Fabrizio Perri construct a heterogeneous-agent model with incomplete markets.59 Since this class of models, when calibrated to a realistic income process, fails to produce sufficient dispersion in the wealth distribution, the researchers augment it with preference heterogeneity, idiosyncratic labor income risk, and a life-cycle structure that allows them to consider Social Security and unemployment insurance. The augmented model fits the empirical distribution well, and in particular features a realistically large proportion of agents with low wealth. When these wealth-poor agents are hit by a large aggregate shock, they adjust their consumption dramatically, which makes the model consistent with the evidence of a large fall in consumption during the Great Recession.
• Inequality, Human Capital, and Residential Segregation
Leaving aside the very top of the income distribution, growing inequality in the United States and elsewhere stems in important part from increasing skill and educational premiums, together with large differences in human capital across households. A growing applied microeconomics literature finds that a significant part of this inequality can be traced back to early childhood, and that programs targeting poor families can have important effects on the cognitive and noncognitive skills of their children. Early work by Oded Galor and Joseph Zeira showed how, due to credit-market imperfections, inequality can have adverse effects on aggregate human capital formation and income growth.60 Diego Daruich examines quantitatively the macroeconomic consequences of large-scale early-childhood development policies.61 Using a dynamic general-equilibrium macro model, he traces the cumulative effects of such interventions on the skill formation of successive generations and finds that the resulting welfare gains are twice as large in the long run as in the short run, even taking into account attenuating general-equilibrium effects, such as those of taxation.
Matthias Doepke and Fabrizio Zilibotti relate inequality, parenting practices, and the process of human capital formation.62 They document that, in countries with high and growing economic inequality such as the United States and China, parents push their children harder to become academic achievers, whereas in more equal societies like Sweden, Germany, and Japan, parents care more about promoting their children's independent development. Within the United States, the researchers document an increasing "parenting gap" between richer and poorer families, raising the prospect of diminished social mobility and fewer opportunities for children from disadvantaged backgrounds.
Another key driver of both inequality and intergenerational social mobility is residential and social segregation. Alessandra Fogli and Veronica Guerrieri document a significant correlation between income inequality and residential segregation over the last three decades, both in the time-series and across metropolitan statistical areas.63 They construct a dynamic general-equilibrium model in which local spillovers in education generate a feedback mechanism between segregation and income inequality. Calibrating the model using census data to match the micro estimates of these spillovers from Raj Chetty and Nathaniel Hendren,64 they show that endogenous residential segregation substantially magnifies the effects of exogenous increases in the returns to education. A closely related amplifying mechanism is assortative mating in the marriage market. As people live in increasingly stratified neighborhoods, highly educated people meet mostly highly educated people, so it is harder for those coming from the lower ranks of society to move up the ladder through marrying up, a traditional vehicle of social mobility. Lasse Eika, Magne Mogstad, and Basit Zafar study the extent of educational assortative matching in the U.S. and four European countries,65 and show that it is indeed an important determinant of the level of inequality. In terms of time trends for the U.S., however, they find mixed results: Since the 1980s, there has been little change in educational assortative mating, suggesting that this may not have been a primary factor in the rising inequality observed here in recent decades.
The debate on the relationship between technology and the income distribution has been lively since the late 1980s, and in recent years, artificial intelligence and automation have attracted substantial attention. Daron Acemoglu and Pascual Restrepo present evidence that robots are substituting for jobs in manufacturing.66 David Autor and Anna Salomons argue that automation shifts labor across industries and pushes down labor's share of income within industries.67
Through incomes and a variety of other channels, innovation and creative destruction ultimately affect people's well-being. This is especially important in light of the evidence that, over recent years, certain groups in the population — most notably, white males in middle age — exhibited a significant deterioration in their health and perceived welfare. Philippe Aghion, Ufuk Akcigit, Angus Deaton, and Alexandra Roulet document that job destruction associated with innovation tends to decrease subjective well-being, but less so in the presence of more generous unemployment benefits.68
• Tax and Regulatory Reforms
Policy is, of course, another important determinant of the distribution of incomes, both pre-and post-tax. Stefania Albanesi and Jaromir Nosal study the effects of a 2005 reform of personal bankruptcy in the United States, the Bankruptcy Abuse Prevention and Consumer Protection Act, which increased the costs of filing and restricted eligibility.69 Using administrative credit-file data, the study documents that this act caused a large drop in filings for straight bankruptcy, especially for low-income individuals, but also a large permanent rise in insolvency. They conclude that the reform may have reduced the provision of valuable insurance for poor households. Katrine Jakobsen, Kristian Jakobsen, Henrik Kleven, and Zucman document the effects of wealth taxes on wealth accumulation, using administrative data from Denmark.70 This country had a large wealth tax, which was first reduced and then abolished between 1989 and 1997. The researchers construct a lifecycle model and show that a calibrated version predicts a high long-run elasticity of wealth with respect to the net-of-tax return, especially for the wealthiest individuals, hence a substantial impact on inequality.
4. Methodological Advance: Heterogeneous Agent Models
Stimulated in part by the need to better understand the dynamics of the 2008 financial crisis and the impact of the policy response, heterogeneous agent modeling has been an area in which research has advanced rapidly in recent years. Models in this tradition focus on differences across households or firms as critical for macroeconomic dynamics. Progress on this topic has included both important methodological advances and substantive findings. Two areas in which there have been particularly important applications are the study of how heterogeneity affects the transmission of monetary and fiscal policy, and the use of regional heterogeneity to draw implications about aggregate behavior.
Prior to the Great Recession, many researchers used the representative household framework with perfect financial markets to analyze monetary and fiscal policy. In addition to being unrealistic, the representative agent framework predicts a very strong response of household consumption to interest rates due to intertemporal substitution. That is not seen in the data, which makes the frame-work questionable for studying monetary policy. The heterogeneous agent framework allows for borrowing and lending among households, along with realistic frictions in this process. Because this framework recognizes that a sizeable fraction of households face borrowing constraints, overall consumption is not as sensitive to interest rate movements in this framework as in the representative agent setting. Accordingly, the heterogeneous agent framework is better able to capture the monetary policy transmission mechanism and the distributional consequences of monetary policy.71
On the other hand, the representative agent framework understates the effect of fiscal policy. The Ricardian equivalence theorem, which implies that tax cuts do not affect household spending, holds: Households simply adjust saving to pay future taxes. Within the heterogeneous agent framework, tax cuts stimulate spending due to the fact that some households are at or near their respective borrowing constraints. Accordingly, the heterogeneous agent framework offers a more realistic approach to studying fiscal policy.72
In part because of the substantial differences across places in the severity of the Great Recession, in recent studies researchers have estimated local employment, wage, consumption, and output elasticities with respect to plausibly identified exogenous regional shocks. Given the importance of general equilibrium forces, these regional elasticities to a given shock do not directly measure aggregate elasticities to the same shock. In order to translate well-identified regional elasticities to meaningful aggregate elasticities for macroeconomic analysis, some additional structure is needed. Several important papers have developed procedures linking well-identified regional estimates so that they speak more directly to issues of aggregate fluctuations. For example, Nakamura and Steinsson use a structural model to show how estimates of local government multipliers can inform aggregate multipliers.73 Martin Beraja, Erik Hurst, and Juan Ospina develop a methodology to combine regional data with aggregate data to discipline nominal wage rigidities in New Keynesian models.74 Beraja, Andreas Fuster, Hurst, and Joseph Vavra use regional variation to explore the time-varying aggregate effects of monetary policy.75 Rodrigo Adão, Costas Arkolakis, and Federico Esposito use a structural model to map well identified estimates of the local employment effects of trade shocks to aggregate employment trends.76 Callum Jones, Midrigan Virgiliu, and Thomas Philippon were among the first to use regional data in an equilibrium dynamic macro model to study the origins of the Great Recession.77
Endnotes
M. Gertler and S. Gilchrist, "What Happened: Financial Factors in the Great Recession," NBER Working Paper No. 24746, June 2019, provide a time line of the crisis that high-lights these two channels.
O. Jordà, M. Schularik, and A. Taylor, "Macrofinancial History and the New Business Cycle Facts," NBER Working Paper No. 22743, October 2016
A. Krishnamurthy and T. Muir, "How Credit Cycles Across a Financial Crisis," NBER Working Paper No. 23850, September 2017.
A. Mian and A. Sufi, "House Prices, Home Equity-Based Borrowing, and the U.S. Household Leverage Crisis," NBER Working Paper No. 15283, August 2009, and A. Mian and A. Sufi, "What Explains High Unemployment? The Aggregate Demand Channel," NBER Working Paper No. 17830, February 2012.
A voluminous empirical literature has followed that essentially confirms Mian and Sufi's findings, including, for example, G. K. Mitman and G. Violante, "Non-durable Consumption and Housing Net Worth in the Great Recession: Evidence from Easily Accessible Data," NBER Working Paper No. 22232, May 2016; and C. Jones, V. Midrigan, and T. Philippon, "Household Leverage and the Recession," NBER Working Paper No. 16965, April 2011.
Examples of models with this feature include V. Guerrieri and G. Lorenzoni, "Credit Crises, Precautionary Savings, and the Liquidity Trap," NBER Working Paper No. 17583, November 2011; G. Kaplan, K. Mitman, and G. Violante, "The Housing Boom and Bust: Model Meets Evidence," NBER Working Paper No. 23694, August 2017; D. Berger, V. Guerrieri, G. Lorenzoni, and J. Vavra, "House Prices and Consumer Spending," NBER Working Paper No. 21667, October 2015; and A. Justiniano, G. Primiceri, and A. Tambalotti, "Credit Supply and the Housing Boom," NBER Working Paper No. 20874, January 2015
M. Gertler, N. Kiyotaki, and A. Prestipino, "A Macroeconomic Model with Financial Panics," NBER Working Paper No. 24126, December 2017, provides a timeline of the rise and fall of the shadow banking sector.
S. Gilchrist and E. Zakrajšek, "Credit Spreads and Business Cycle Fluctuations," NBER Working Paper No. 17021, May 2011.
G. Chodorow-Reich, "The Employment Effects of Credit Market Disruptions, Firm-level Evidence from the 2008-2009 Financial Crisis," Quarterly Journal of Economics, 129(1), 2013, pp. 1–59. For related evidence on how the disruption of intermediation financial affected nonfinancial firms, see G. Chodorow-Reich and A. Falato, "The Loan Covenant Channel: How Bank Health Transmits to the Real Economy," NBER Working Paper No. 23879, September 2017; S. Gilchrist, R. Schoenle, J. Sim, and E. Zakrajšek, "Inflation Dynamics During the Financial Crisis," NBER Working Paper No. 22827, November 2016; B. Chen, S. Hanson, and J. Stein, "The Decline of Big-Bank Lending to Small Business: Dynamic Impacts on Local Credit and Labor Markets," NBER Working Paper No. 23843, September 2017. E. Benmelech, R. Meisenzahl, and R. Ramcharan, "The Real Effects of Liquidity During the Financial Crisis: Evidence from Automobiles," NBER Working Paper No. 22148, April 2016, present evidence on how such disruptions affected household auto demand.
Z. He and A. Krishnamurthy, "A Macroeconomic Framework for Quantifying Systemic Risk," NBER Working Paper No. 19885, February 2014, present a model in this tradition.
A. Krishnamurthy, S. Nagel, and D. Orlov, "Sizing Up Repo," NBER Working Paper No. 17768, January 2012.
E. Mendoza, "Sudden Stops, Financial Crises, and Leverage: A Fisherian Deflation of Tobin's Q," NBER Working Paper No. 14444, October 2008; Z. He and A. Krishnamurthy, "A Macroeconomic Framework for Quantifying Systemic Risk," NBER Working Paper No. 19885, February 2014, revised May 2019.
M. Gertler and N. Kiyotaki, "Banking, Liquidity, and Bank Runs in an Infinite-Horizon Economy," NBER Working Paper No. 19129, June 2013; and ibid., NBER Working Paper No. 24126.
C. Reinhart and K. Rogoff, This Time is Different: Eight Centuries of Financial Folly, Princeton, N.J.: Princeton University Press, 2009.
R. Hall, "Quantifying the Lasting Harm to the U.S. Economy from the Financial Crisis," NBER Working Paper No. 20183, May 2014.
J. Fernald, R. Hall, J. Stock, and M. Watson, "The Disappointing Recovery of Output after 2009," NBER Working Paper No. 23543, June 2017.
Empirical work by A. Krishnamurthy and A. Vissing-Jorgensen, "The Effects of Quantitative Easing on Interest Rates: Channels and Implications for Policy," NBER Working Paper No. 17555, and others provides evidence for this kind of mechanism.
Examples include E. Farhi and I. Werning, "A Theory of Macroprudential Policies in the Presence of Nominal Rigidities," NBER Working Paper No. 19313, and A. Korinek and A. Simsek, "Liquidity Trap and Excessive Leverage," NBER Working Paper No. 19970, March 2014.
Examples include E. Farhi and J. Tirole, "Collective Moral Hazard, Maturity Mismatch, and Systemic Bailouts," NBER Working Paper No. 15138, July 2009; V. Chari and P. Kehoe, "Bailouts, Time Inconsistency, and Optimal Regulation," NBER Working Paper No. 19192, June 2013; and J. Bianchi and E. Mendoza, "Optimal Time-Consistent Macroprudential Policy," NBER Working Paper No. 19704, December 2013.
I. Werning, "Managing a Liquidity Trap: Monetary and Fiscal Policy," NBER Working Paper No. 17344, August 2011.
Research on this topic includes A. McKay, E. Nakamura, and J. Steinsson, "The Power of Forward Guidance Revisited," NBER Working Paper No. 20882, January 2015; M. Garcia-Schmidt and M. Woodford, "Are Low Interest Rates Deflationary? A Paradox of Perfect-Foresight Analysis," NBER Working Paper No. 21614, October 2015; G. Angeletos and C. Lian, "Forward Guidance without Common Knowledge," NBER Working Paper No. 22785, October 2016; and X. Gabaix, "A Behavioral New Keynesian Model," NBER Working Paper No. 22954, December 2016.
E. Farhi and I. Werning, "Monetary Policy, Bounded Rationality, and Incomplete Markets," NBER Working Paper No. 23281, March 2017.
L. Christiano, M. Eichenbaum, and S. Rebelo, "When Is the Government Spending Multiplier Large?" NBER Working Paper No. 15394, October 2009.
E. Nakamura and J. Steinsson, "High Frequency Identification of Monetary Non-Neutrality: The Information Effect," NBER Working Paper No. 19260, July 2013.
A. Auerbach and Y. Gorodnichenko, "Fiscal Multipliers in Recession and Expansion," NBER Working Paper No. 17447, September 2011; V. Ramey, "Ten Years after the Financial Crisis: What Have We Learned from the Renaissance in Fiscal Research?" NBER Working Paper No. 25531, February 2019, suggests caution in drawing conclusions about the variation in the fiscal multiplier over the cycle.
C. Jones, "The Facts of Economic Growth," NBER Working Paper No. 21142, May 2015, and Handbook of Macroeconomics, 2, 2016, pp. 3–69.
P. Aghion, U. Akcigit, and P. Howitt, "What Do We Learn From Schumpeterian Growth Theory?" NBER Working Paper No. 18824, February 2013; and Handbook of Economic Growth, 2, 2016, pp. 515–63.
U. Akcigit and S. Ates, "Ten Facts on Declining Business Dynamism and Lessons from Endogenous Growth Theory," NBER Working Paper No. 25755, April 2019.
R. Decker, J. Haltiwanger, R. Jarmin, and J. Miranda, "Changing Business Dynamism and Productivity: Shocks vs. Responsiveness," NBER Working Paper No. 24236, January 2018.
J. Haltiwanger, R. Jarmin, and J. Miranda, "Who Creates Jobs? Small vs. Large vs. Young," NBER Working Paper No. 16300, August 2010, and Review of Economics and Statistics, 95(2), 2013, pp. 347–61.
U. Akcigit and W. Kerr, "Growth through Heterogeneous Innovations," NBER Working Paper No. 16443, November 2010, and Journal of Political Economy, 126(4), 2018, pp. 1374–1443.
J. Fernald, "Productivity and Potential Output Before, During, and After the Great Recession," NBER Working Paper No. 20248, June 2014, and NBER Macroeconomics Annual 2014, pp. 1–51.
T. Alon, D. Berger, R. Dent, and B. Pugsley,"Older and Slower: The Startup Deficit's Lasting Effects on Aggregate Productivity Growth," NBER Working Paper No. 23875, September 2017, and Journal of Monetary Economics, 93, 2018, pp. 68–85.
D. Garcia-Macia, C. Hsieh, and P. Klenow,"How Destructive is Innovation?," NBER Working Paper No. 22953, December 2016, and forthcoming in Econometrica.
C. Hottman, S. Redding and D. Weinstein,"Quantifying the Sources of Firm Heterogeneity," NBER Working Paper No. 20436, August 2014, and Quarterly Journal of Economics, 131(3), 2016, pp. 1291–364.
R. Gordon,"Why Has Economic Growth Slowed When Innovation Appears to be Accelerating?" NBER Working Paper No. 24554, April 2018.
N. Bloom, C. Jones, J. Van Reenen, and M. Webb,"Are Ideas Getting Harder to Find?" NBER Working Paper No. 23782, September 2017.
C. Syverson,"Challenges to Mismeasurement Explanations for the U.S. Productivity Slowdown," NBER Working Paper No. 21974, February 2016, and Journal of Economic Perspectives, 31(2), 2017, pp. 165–86.
P. Aghion, A. Bergeaud, T. Boppart, P. Klenow, and H. Li,"Missing Growth from Creative Destruction," NBER Working Paper No. 24023, November 2017, and forthcoming in American Economic Review.
D. Restuccia and R. Rogerson,"The Causes and Costs of Misallocation," NBER Working Paper No. 23422, May 2017, and Journal of Economic Perspectives, 31(3), 2017, pp. 151–74.
C. Syverson,"What Determines Productivity?" NBER Working Paper No. 15712, January 2010, and Journal of Economic Literature, 49(2), 2011, pp. 326–65.
C. Hsieh and P. Klenow,"Misallocation and Manufacturing TFP in China and India," NBER Working Paper No. 13290, August 2007, and Quarterly Journal of Economics, 124(4), pp. 1403–48, 2009.
A. Collard-Wexler, J. Asker, and J. De Loecker,"Productivity Volatility and the Misallocation of Resources in Developing Economies," NBER Working Paper No. 17175, June 2011, and published as "Dynamic Inputs and Resource (Mis)Allocation," Journal of Political Economy, 122(5), 2014, pp. 1013–63.
J.M. David and V. Venkateswaran,"The Sources of Capital Misallocation," NBER Working Paper No. 23129, February 2017, and forthcoming in the American Economic Review.
G. Gopinath, S. Kalemli-Ozcan, L. Karabarbounis, and C. Villegas-Sanchez,"Capital Allocation and Productivity in South Europe," NBER Working Paper No. 21453, August 2015, and Quarterly Journal of Economics, 132(4), 2017, pp. 1915–67; Y. Gorodnichenko, D. Revoltella, J. Svejnar, and C.T. Weiss,"Resource Misallocation in European Firms: The Role of Constraints, Firm Characteristics, and Managerial Decisions," NBER Working Paper No. 24444, March 2018.
F. Buera, J. Kaboski, and Y. Shin,"Finance and Development: A Tale of Two Sectors," NBER Working Paper No. 14914, April 2009, and American Economic Review, 101(5), 2011, pp. 1964-2002; A. Eisfeldt and Y. Shi,"Capital Reallocation," NBER Working Paper No. 25085, September 2018.
V. Midrigan and D.Y. Xu,"Finance and Misallocation: Evidence from Plant-Level Data," NBER Working Paper No. 15647, January 2010, and American Economic Review, 104(2), 2014, pp. 422–58.
D. Baqaee and E. Farhi,"Productivity and Misallocation in General Equilibrium," NBER Working Paper No. 24007, November 2017.
C. Edmond, V. Midrigan, D. Xu,"How Costly are Markups?" NBER Working Paper No. 24800, July 2018.
D. Autor, D. Dorn, L. Katz, C. Patterson, and J. Van Reenen,"The Fall of the Labor Share and the Rise of Superstar Firms," NBER Working Paper No. 23396, May 2017; J. De Loecker and J. Eeckhout,"The Rise of Market Power and the Macroeconomic Implications," NBER Working Paper No. 23687, August 2017.
U. Akcigit, H. Alp, and M. Peters,"Lack of Selection and Limits to Delegation: Firm Dynamics in Developing Countries," NBER Working Paper No. 21905, January 2016.
C. Hsieh and P. Klenow,"The Life Cycle of Plants in India and Mexico," NBER Working Paper No. 18133, June 2012, and Quarterly Journal of Economics, 129(3), 2014, pp. 1035–84.
C. Hsieh, E. Hurst, C. Jones, and P. Klenow,"The Allocation of Talent and U.S. Economic Growth," NBER Working Paper No. 18693, January 2013, and forthcoming in Econometrica.
E. Saez and G. Zucman,"Wealth Inequality in the United States since 1913: Evidence from Capitalized Income Tax Data," NBER Working Paper No. 20625, October 2014, and Quarterly Journal of Economics, 131(2), 2016, pp. 519-78.
X. Gabaix, J. Lasry, P. Lions, and B. Moll,"The Dynamics of Inequality," NBER Working Paper No. 21363, July 2015, and Econometrica, 84(6), 2016, pp. 2071–111.
J. Benhabib, A. Bisin, and M. Luo,"Wealth Distribution and Social Mobility in the U.S.: A Quantitative Approach," NBER Working Paper No. 21721, December 2015, and American Economic Review, 109(5), 2019, pp. 1623–47.
A. Fagereng, L. Guiso, D. Malacrino, and L. Pistaferri, "Heterogeneity and Persistence in Returns to Wealth," NBER Working Paper No. 22822, November 2016.
D. Krueger, K. Mitman, and F. Perri,"Macroeconomics and Household Heterogeneity," NBER Working Paper No. 22319, June 2016.
O. Galor and J. Zeira, "Income Distribution and Macroeconomics," Review of Economic Studies, 60(1), 1993, pp. 35-52.
D. Daruich, "The Macroeconomic Consequences of Early Childhood Development Policies," Federal Reserve Bank of Minneapolis System Working Paper 18–18, 2018.
M. Doepke and F. Zilibotti,"Parenting with Style: Altruism and Paternalism in Intergenerational Preference Transmission," NBER Working Paper No. 20214, June 2014, and Econometrica, 85(5), 2017, pp. 1331–71.
A. Fogli and V. Guerrieri, "The End of the American Dream? Inequality and Segregation in U.S. Cities," Mimeo, University of Chicago, Booth School of Business, 2018.
R. Chetty and N. Hendren,"The Impacts of Neighborhoods on Intergenerational Mobility II: County-Level Estimates," NBER Working Paper No. 23002, and Quarterly Journal of Economics, 2018, 133(3), 2018, pp. 1163–1228.
L. Eika, M. Mogstad, and B. Zafar,"Educational Assortative Mating and Household Income Inequality," NBER Working Paper No. 20271, July 2014, and forthcoming in Journal of Political Economy.
D. Acemoglu and P. Restrepo,"Robots and Jobs: Evidence from U.S. Labor Markets," NBER Working Paper No. 23285, March 2017.
D. Autor and A. Salomons,"Is Automation Labor-Displacing? Productivity Growth, Employment, and the Labor Share," NBER Working Paper No. 24871, July 2018.
P. Aghion, U. Akcigit, A. Deaton, and A. Roulet,"Creative Destruction and Subjective Well-Being," NBER Working Paper No. 21069, April 2015, and American Economic Review, 106(12), 2016, pp. 3869–97.
S. Albanesi and J. Nosal,"Insolvency after the 2005 Bankruptcy Reform," NBER Working Paper No. 24934, August 2018.
K. Jakobsen, K. Jakobsen, H. Kleven, and G. Zucman,"Wealth Taxation and Wealth Accumulation: Theory and Evidence from Denmark," NBER Working Paper No. 24371, March 2018.
Studies that employ the heterogeneous agent approach to analyze monetary policy include A. Auclert,"Monetary Policy and the Redistribution Channel," NBER Working Paper No. 23451, May 2017; G. Kaplan, B. Moll, and G. Violante,"Monetary Policy According to HANK," NBER Working Paper No. 21897, January 2016; A. McKay, E. Nakamura, and J. Steinsson,"The Power of Forward Guidance Revisited," NBER Working Paper No. 20882, January 2015; and I. Werning,"Incomplete Markets and Aggregate Demand," NBER Working Paper No. 21448, August 2015.
Studies that employ the heterogeneous agent approach to analyze fiscal policy include M. Hagdorn, I. Manovskii, and K. Mitman,"The Fiscal Multiplier," NBER Working Paper No. 25571, February 2019; G. Kaplan and G. Violante,"A Model of the Consumption Response to Fiscal Stimulus Payments," NBER Working Paper No. 17338, August 2011; A. McKay and R. Reis,"The Role of Automatic Stabilizers in the U.S. Business Cycle," NBER Working Paper No. 19000, April 2013; and H. Oh and R. Reis,"Targeted Transfers and the Fiscal Response to the Great Recession," NBER Working Paper No. 16775, February 2011.
E. Nakamura and J. Steinsson,"Fiscal Stimulus in a Monetary Union: Evidence from U.S. Regions," NBER Working Paper No. 17391, September 2011.
M. Beraja, E. Hurst, and J. Ospina,"The Aggregate Implications of Regional Business Cycles," NBER Working Paper No. 21956, February 2016.
M. Beraja, A. Fuster, E. Hurst, and J. Vavra,"Regional Heterogeneity and Monetary Policy," NBER Working Paper No. 23270, March 2017, and Quarterly Journal of Economics, 134(1), 2019, pp. 109-83.
R. Adão, C. Arkolakis, and F. Esposito,"Spatial Linkages, Global Shocks, and Local Labor Markets: Theory and Evidence," NBER Working Paper No. 25544, February 2019.
C. Jones, V. Midrigan, and T. Philippon,"Household Leverage and the Recession," NBER Working Paper No. 16965, April 2011


