Rising Oil Prices, Loose Monetary Policy, and US Inflation

US inflation was relatively low and stable for three decades beginning in the 1990s. In sharp contrast, it has been relatively high since 2021. Many factors, including the COVID-19 pandemic, the war in Ukraine, expansionary fiscal policy, and loose monetary policy, have been cited as potential contributors to the recent inflation surge. In Oil Prices, Monetary Policy and Inflation Surges (NBER Working Paper 31263), Luca Gagliardone and Mark Gertler suggest that a combination of oil price shocks and easy monetary policy have been critical to the size and persistence of the recent inflation surge.
The researchers focus on the complementarity between the use of oil and labor as inputs to production by firms, and the related complementarity between the use of oil and other consumption goods by households. They embed their formulation of production and consumption in a macroeconomic model that allows for unemployment and wage rigidity and in which households have well-anchored long-run inflation expectations.
Historical data suggest that rising crude oil prices due to the Ukrainian conflict and expansionary monetary policy both contributed to the inflationary surge of 2021–23.
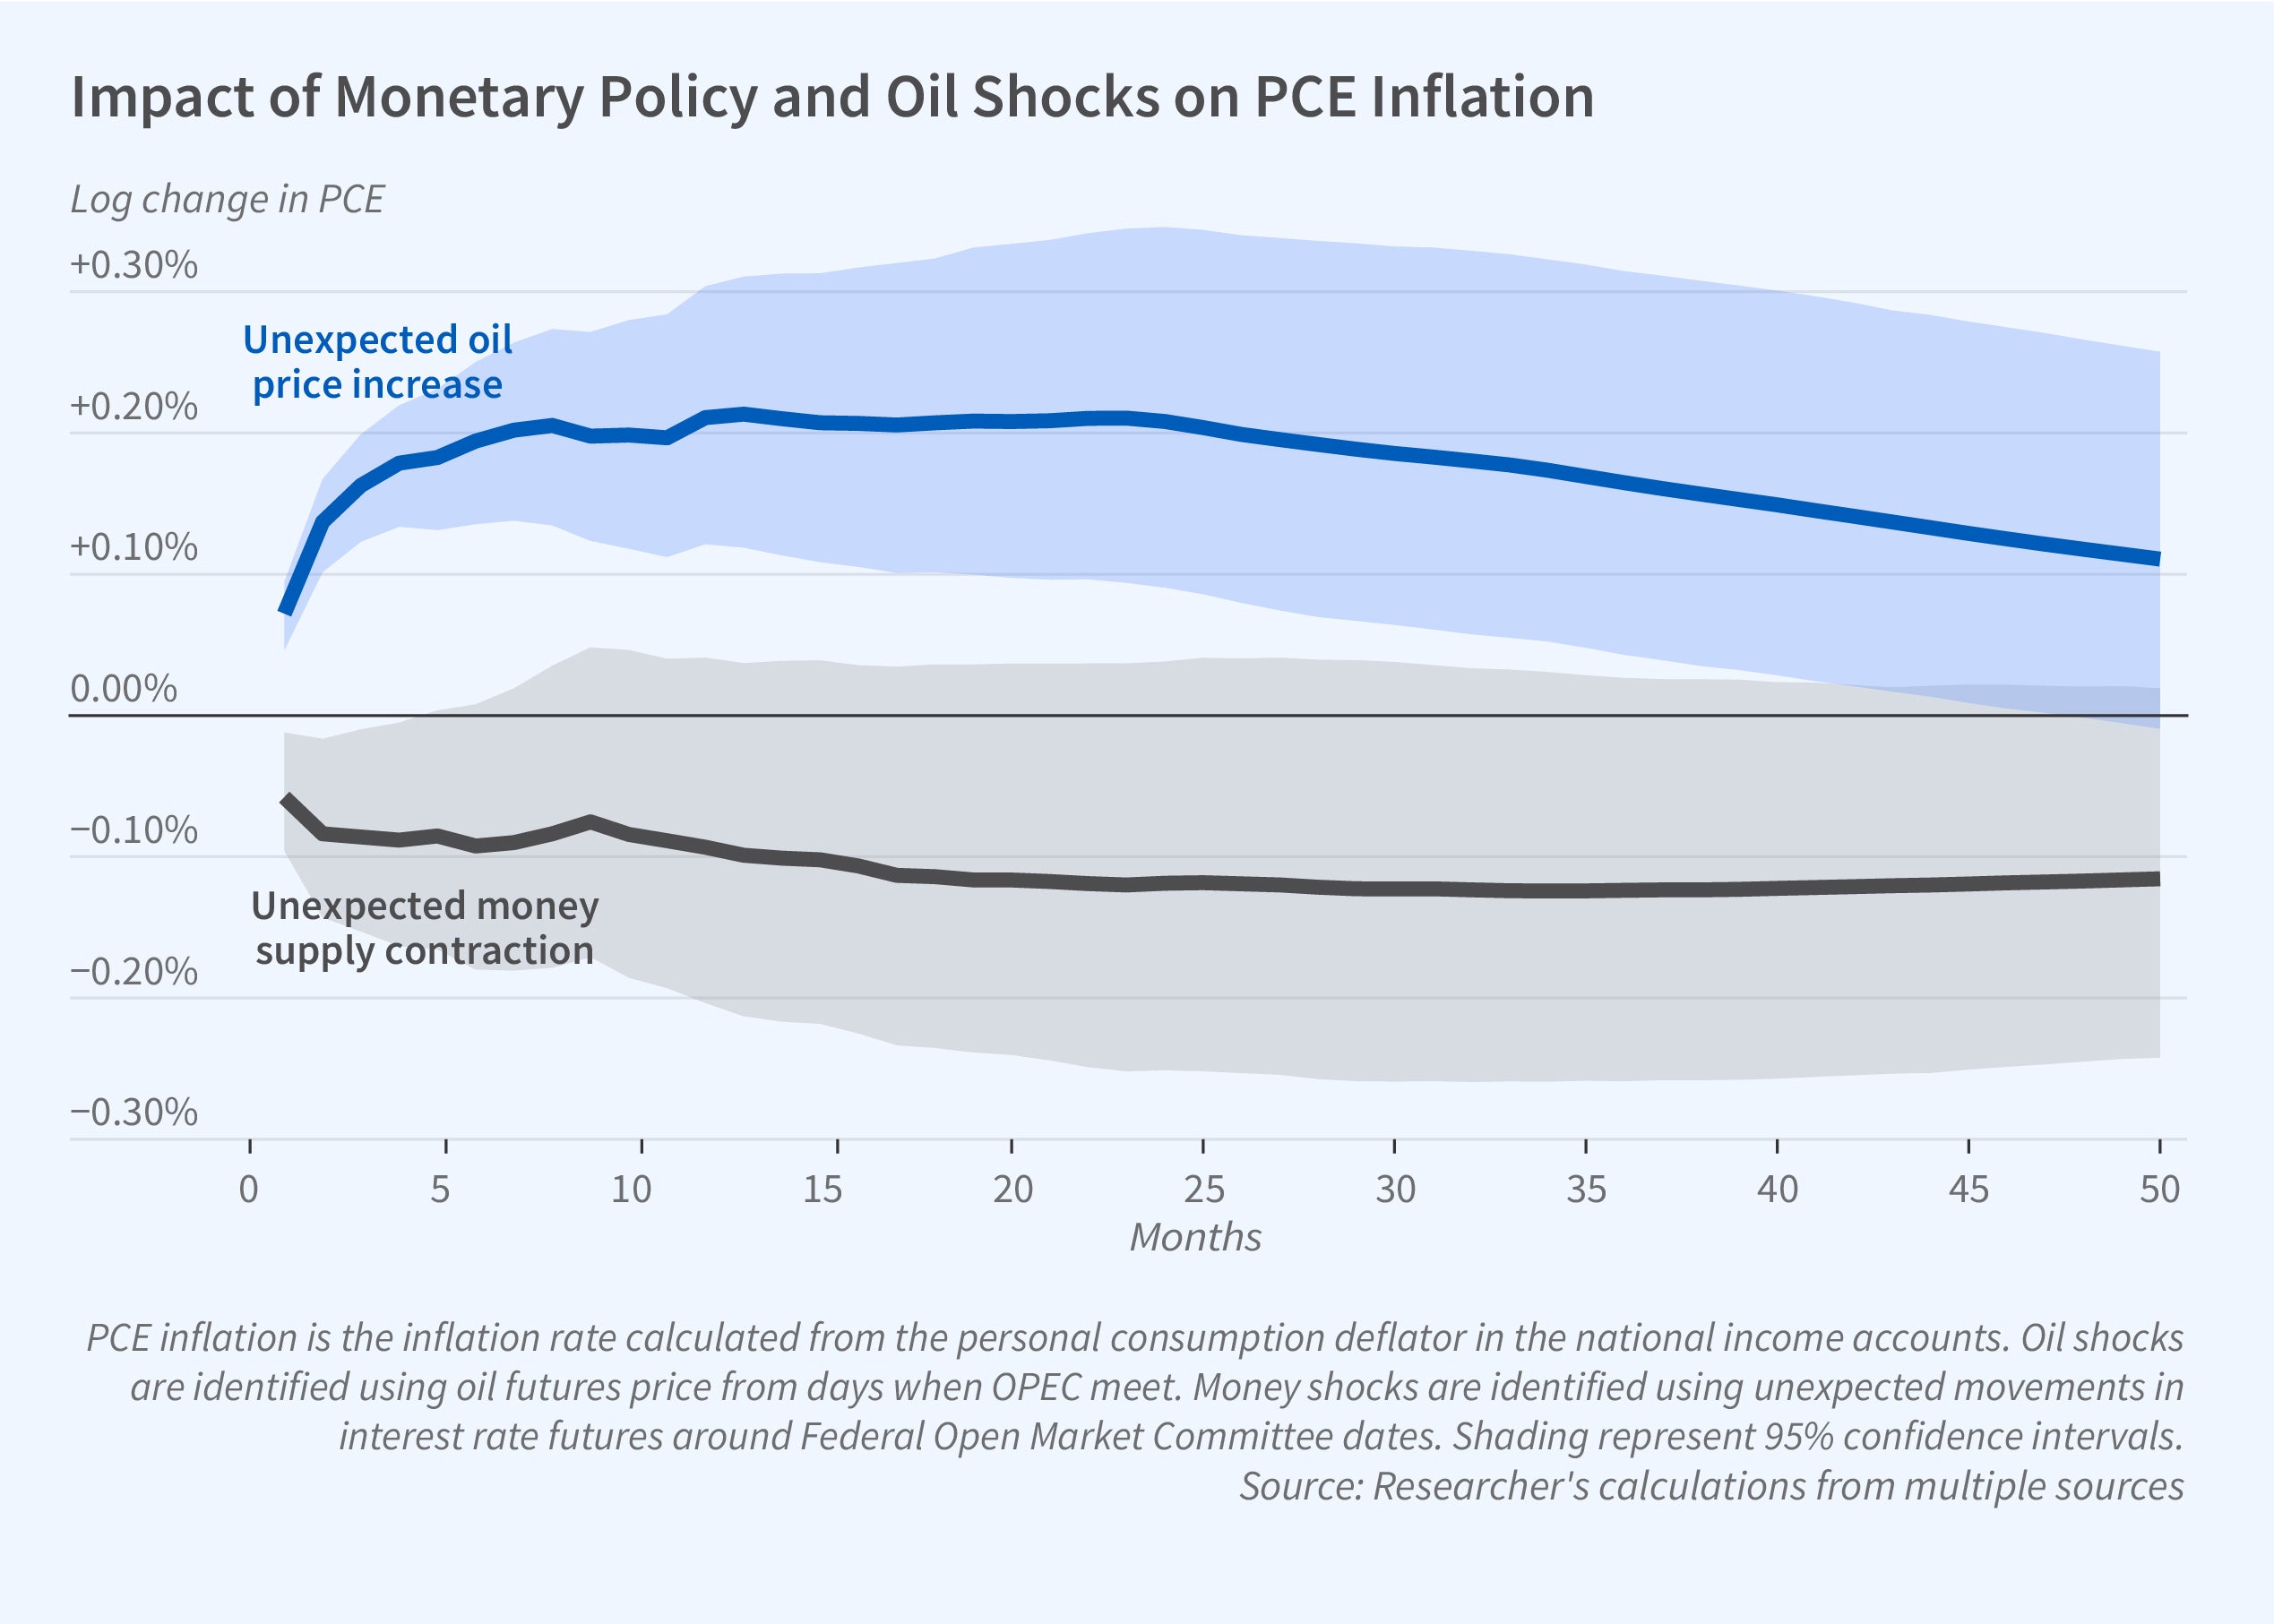
To estimate their model, they consider two types of macroeconomic shocks: changes in oil prices that constitute “supply shocks,” and changes in the tightness of monetary policy that constitute “demand shocks.” They identify the former from changes in the futures prices for oil on OPEC meeting days, and the latter from movements in interest rate futures around Federal Open Market Committee meeting dates. After constructing time series of both oil prices and monetary policy shocks over the period 1973 to 2019, they analyze the effects of these shocks on monthly measures of real gross domestic product (GDP), unemployment, real oil prices, the federal funds rate, the inflation rate for Personal Consumption Expenditures (PCE), and the excess return of private long-term bond yields over similar maturity government bonds.
The researchers show that a monetary policy shock that entails an unexpected interest rate tightening of 15 basis points leads to a 10-basis-point decline in both real GDP and the price level, with effects persisting for approximately four years. A shock to oil prices that increases the real price of oil by 6 percent reduces GDP by 20 to 30 basis points and increases the price level by 20 basis points. In response to such an oil price increase, the federal funds rate increases by 20 basis points and real wages decline by 5 to 10 basis points. The researchers then estimate their economic model to match these empirical patterns, and show that it matches closely the evidence on the impact of oil and monetary shocks. They also illustrate how the complementarities they analyze, in conjunction with wage rigidity, greatly enhance the impact of oil shocks on inflation and unemployment.
The researchers use their model to identify the underlying drivers of the recent inflation. They consider four types of primitive shocks: shocks to oil prices, shocks to monetary policy, a general (nonmonetary) demand shock, and shocks to labor market tightness. They identify these four shocks by using their estimated model to fit movements in four variables — real oil prices, the federal funds rate, unemployment, and labor market tightness — over the period from 2010 to the spring of 2023. Given the identified shocks, the researchers show that their model can track both core and headline inflation, even though inflation was not targeted in the estimation. In particular, the model captures both the magnitude and persistence of the recent inflation surge. It undershoots the rise in core PCE inflation in the latter part of 2021, a period when supply chain problems peaked, but otherwise fits well through the spring of 2023.
The researchers find that the two important underlying drivers of the recent inflation surge were positive oil price shocks and “loose” monetary policy shocks. The former are associated with both the global recovery from the pandemic recession and the Russia-Ukraine War. The latter reflect the prolonged period at the zero lower bound following the pandemic recession, which led to the federal funds rate being persistently below its historical policy rule. Part of the reason for the persistent effect of easy monetary shocks on inflation is that the model, like the US economy, exhibits a delayed effect of monetary policy on economic activity. Interestingly, the model also accounts for why during the period 2015 to 2019 inflation was low despite low unemployment. There were a series of negative oil price shocks and tight monetary policy shocks, the exact opposite of what happened recently.
Finally, the researchers show that their model predicts that absent new shocks, core PCE inflation should decline to 3 percent by the end of 2024. They also use their model to illustrate how the central bank could hasten the decline in PCE inflation by tightening monetary policy, but at the cost of higher unemployment.
—Whitney Zhang


