The Rate of Return on Everything
Asset returns occupy a special place in the history of economic thought. From John Stuart Mill to Karl Marx, the profession's most influential thinkers have devoted much of their time to the study of interest and profits. Today, the rate of return on capital still plays a pivotal role in shaping current macroeconomic debates.
Asset returns encapsulate fundamental features about an economy's dynamics, such as attitudes toward risk and preferences over future consumption, demographic shifts in the share of borrowers versus savers, and the ebb and flow of inequality. Understanding such features is critical in designing economic policy.
My latest research, in collaboration with Òscar Jordà, Katharina Knoll, Dmitry Kuvshinov, and Moritz Schularick, sheds new light on many of these big issues in economics. This research forms part of a larger agenda, a collaborative effort to reconstruct the quantitative macro-financial history of the advanced economies since 1870, and to use that laboratory to study questions of interest to academics and policymakers that have taken on added urgency since the global financial crisis.
The first phase of our research program focused on rebuilding the history of aggregate leverage in the economy, based on bank lending and exploring the relationship between bank balance sheets and leverage, crisis risk, and macroeconomic fluctuations.1 The new data and some of the key findings from that work were presented in a paper published recently in the NBER Macroeconomics Annual.2
In our program's latest phase, attention has shifted to the links between the above phenomena and developments in asset markets. This goal led us to reconstruct the history of returns on major asset classes, which we presented in a recent NBER Working Paper.3
After several years of work, we developed our findings from a new dataset covering the total returns on four main asset classes in the advanced economies over the last 150 years. We collected from scratch new historical data, including, for the first time, the returns on residential real estate — the largest component of household wealth — of which little has been known until now.
Our data offer new insights on several long-standing puzzles in economics and uncover new relationships that may seem at odds with some fundamental economic tenets. This is a review of a few perplexing insights that we have uncovered and their economic significance.
Long-run Rates of Return on All Major Asset Classes
First, a quick review of the new data. We construct three types of returns: investment income (yield), capital gains (price changes), and total returns (the sum of the two). We do these calculations for four major asset classes, two of them risky — equities and housing — and two of them seen as relatively safe — government bonds and short-term bills. Importantly, our data consist of actual asset returns taken from market data. In that regard, our "bottom up" annual-frequency data are more detailed than returns inferred "top down" from wealth estimates in discrete benchmark years, such as in the work of Thomas Piketty and Raymond Goldsmith.4
For the first time, we compile historical returns on housing, the largest but an often-ignored component of household wealth. We follow earlier work in documenting annual equity, bond, and bill returns, but have taken the project further. We recompute all these measures from original sources, improve the links across some important historical market discontinuities (e.g., closures and other gaps associated with wars and political instability), and in a number of cases we access new and previously unused raw data sources. Here are some of the puzzling results we have uncovered.
The Housing Puzzle
Perhaps the most surprising finding is that total real returns on residential real estate are on a par with the returns to equities — on average about 7 percent per annum — but they are far less volatile.
Figure 1, above, shows decadal moving averages for real returns on equity and housing. In some countries for some periods, equities have performed slightly better than housing, but only at the cost of much higher volatility and higher synchronicity with the business cycle.
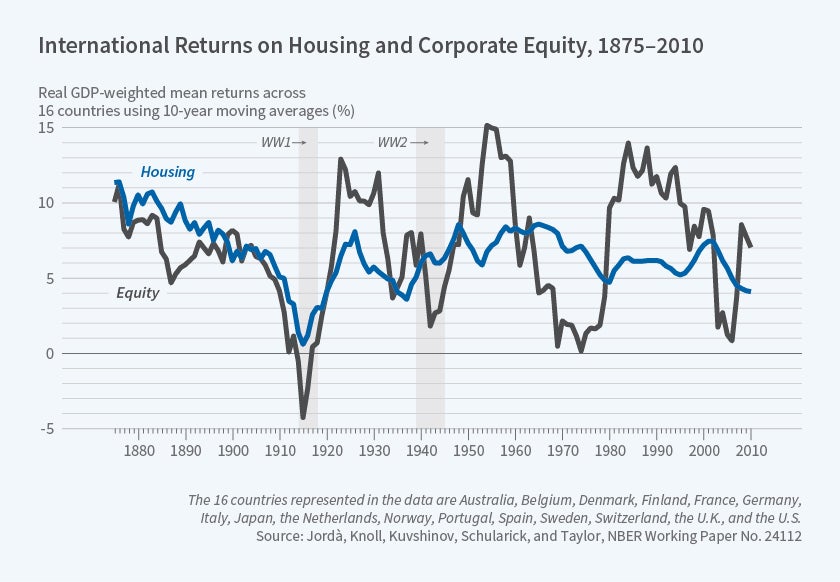
This is puzzling. Housing portfolios are more difficult to diversify than equity portfolios, and transaction costs are admittedly higher. But even accounting for local level variability in house prices, a great deal of this housing puzzle is difficult to fully explain.
The mystery deepens when we consider international diversification. Whereas we can show that equity returns have become increasingly correlated across countries over time, we can also show that housing returns have remained globally uncorrelated. International diversification of housing investment may be harder to achieve, but the thought experiment suggests that the representative investor would do well to hold an internationally diversified portfolio of real estate holdings.
The Safe Rate Puzzle
Our second important finding is that the real returns on safe assets have been very volatile over the long run — and, surprisingly, as much if not more so than risky returns, as Figure 2 demonstrates. Each of the world wars was a time of very low real safe rates, well below zero. So were the 1970s inflation and growth crises. The peaks in the real safe rate occurred during gold standard times, in the interwar period, and in the mid-1980s fight against inflation, when monetary policy sharply tightened.
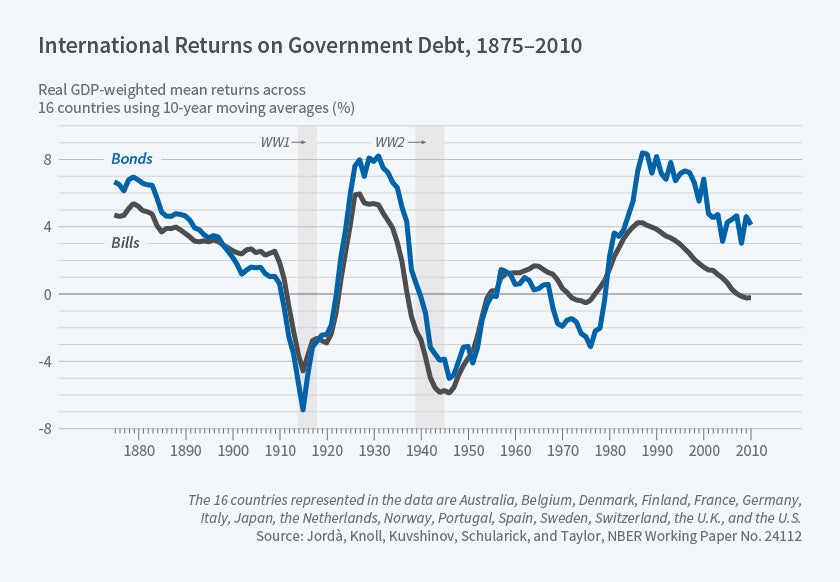
International evidence presented by Holston, Laubach, and Williams suggests that the natural interest rate has declined internationally since the mid-1980s.5 Our richer cross-country sample registers a similarly sharp fall in real safe rates over the same time period. But from a long-run perspective, the puzzle may well be why the safe rate was so high in the mid-1980s, rather than why it has declined so much since then.
Real safe returns have been low on average, in the 1 to 3 percent range for most peacetime periods. Although this combination of low bill and bond returns and high volatility has offered a poor risk-return trade-off to risk-averse investors, it has been a boon to government finances.
The Risk Premium Puzzle
The more an asset pays off when the economy does poorly, the more it insures the investor against economic malaise, and the more the investor will be willing to pay for that insurance — thus depressing its returns and hence commanding what is usually referred to as a risk premium. A vast literature in finance looks at the co-movement between asset pay-offs and economic fluctuations to gauge whether assets are hence properly priced.6
However, we find substantial swings in the risk premium at lower frequencies that sometimes endured for decades, far beyond the range of business-cycle swings. In peacetime, the risk premium has been stable at about 4 to 5 percent. There is no visible long-run trend, and, with a few well-understood exceptions, mean reversion appears strong. Curiously, the bursts of risk premium in the wartime and interwar years were mostly phenomena of collapsing safe rates rather than dramatic increases in risky returns. In fact, the risky rate has often been smoother and more stable than safe rates, averaging 6 to 8 percent across all eras. Recently, with safe rates falling, the risk premium has widened only a little, and the gap between the two rates of return is still close to their historical range.
The Final Puzzle: r > > g
One of the most intensely debated economic questions in recent years is the relationship between real returns on wealth and the real rate of growth. In his influential book Capital in the Twenty-First Century, Piketty argued that if the return to capital exceeded the rate of economic growth, rentiers would accumulate wealth at a faster rate than incomes grow. Comparing returns to growth, or r - g in Piketty's vernacular, we uncover that in fact r > > g for more countries, more years, and more dramatically than Piketty himself reported.
The only exceptions to r > > g happen in very special periods: the years in or right around wartime. In the pre-WWII period, r - g was on average 5 percent per annum, excluding WWI. As of today, this gap is still quite large, in the range of 3 to 4 percent; it narrowed to 2 percent during the 1970s oil crises before widening in the years leading up to the global financial crisis of 2007–08.
Yet an important puzzle that emerges from our analysis is that the r - g gap does not fluctuate systematically with the growth rate of the economy. This feature of the data poses a conundrum for the battling views of factor income, distribution, and substitution in the ongoing debate.7
Conclusions
The returns to risky assets, and risk premiums, have been high and stable over the past 150 years, and substantial diversification opportunities exist between risky asset classes and across countries. Arguably the most surprising result of our study is that long-run returns on housing and equity look remarkably similar. Yet while returns are comparable, residential real estate is less volatile on a national level and less globally interrelated, opening up new and interesting risk-premium puzzles.
In light of the new historical data, we might say invest in stocks for the long run — and houses too. But if that is encouraging an upward revision on the returns on all risk assets, we lean if anything toward down-ward revisions for safe assets. Low real rates may not just be the new normal; in light of our new evidence, they might be seen as more typical of the old normal as well. Safe real rates have almost never been as high as they were in the 1980s, so that decade may not be a reliable benchmark at all.
Our research also speaks directly to the relationship between r, the rate of return on wealth, and g, the growth rate of the economy. The gap between r - g figures prominently in the current debate on inequality sparked by Piketty. A robust finding in this paper is that r is much higher than g. On a global level and across most countries, the weighted rate of return on capital was twice as high as the growth rate in the past 150 years.
These and other findings set out a rich agenda for future research. Many issues remain to be explored, in particular the fundamental determinants that drive the returns on each of the asset class in typical economies. For now, we hope our introduction of this new universe of asset return data can provide a basis for new explorations of fundamental economic questions in years to come.
Endnotes
M. Schularick and A. Taylor, "Credit Booms Gone Bust: Monetary Policy, Leverage Cycles, and Financial Crises, 1870–2008," American Economic Review, 102(2), 2012, pp. 1029–61; Ò. Jordà, M. Schularick, and A. Taylor, "When Credit Bites Back: Leverage, Business Cycles, and Crises," Journal of Money, Credit, and Banking, 45(s2), 2013, pp. 3–28; Ò. Jordà, M. Schularick, and A. Taylor, "Leveraged Bubbles," Journal of Monetary Economics, 76(s), 2015, pp. s1–20; Ò. Jordà, M. Schularick, and A. Taylor, "Betting the House," Journal of International Economics, 96(s1), 2015, pp. s2–18; Ò. Jordà, M. Schularick, and A. Taylor, "The Great Mortgaging: Housing Finance, Crises, and Business Cycles," Economic Policy, 31(85), 2016, pp. 107–52.
Ò. Jordà, M. Schularick, and A. Taylor, "Macrofinancial History and the New Business Cycle Facts," in M. Eichenbaum and J. Parker, eds., NBER Macroeconomics Annual 2016, Vol. 31, Chicago: University of Chicago Press, 2017.
Ò. Jordà, K. Knoll, D. Kuvshinov, M. Schularick, and A. Taylor, "The Rate of Return on Everything, 1870–2015," NBER Working Paper 24112, December 2017.
K. Holston, T. Laubach, and J. Williams, "Measuring the Natural Rate of Interest: International Trends and Determinants," Journal of International Economics, 108(s1), 2017, pp. s59–75.


