Program Report: Asset Pricing, 2018
The 2007-09 financial crisis challenged many long-standing beliefs about asset markets. For example, it raised questions about the applicability of the law of one price, it coincided with a period of extraordinary house price volatility, and it witnessed changing patterns of asset demand on the part of households and financial institutions alike. Over the last decade, researchers in the Asset Pricing Program have carried out a wide range of studies that are motivated by, or try to respond to, these challenges.
This report focuses on studies that exemplify post-crisis research on these three specific developments. The report is not a comprehensive review of research in the three areas, but is rather a collection of illustrative studies. Many other related papers have been distributed in the NBER Working Papers series.
Exploring Violations of the Law of One Price
The law of one price holds that two investment strategies that have exactly the same payoffs in the future should have the same value today. This principle is at the core of asset pricing theory and is usually taught at the beginning of any course in finance. Before the crisis, the law of one price was extraordinarily useful for thinking about financial markets. It was hard to come up with examples of buy-sell strategies that would generate profitable arbitrages, at least after accounting for the transaction costs that would be involved in trading based on these strategies. This suggested that violations of the law of one price did not exist, or that if they did, they were short-lived and quickly arbitraged away.
The crisis profoundly changed this situation, as the law of one price appeared to be violated in many settings. Why? The standard explanation has been weak balance sheets: Financial institutions were aware of the arbitrage opportunities but were unable to take the positions necessary to eliminate them. Some violations have persisted and are still observed today, even though balance sheets of financial institutions have recovered.
There have been particularly salient questions about price determination in foreign exchange markets. In these markets, the law of one price implies the covered interest rate parity (CIP) condition. It compares two investment strategies that do not involve risk. For example, one might be investing U.S. dollars domestically at the short-term interest rate, while the other could be investing dollars in Switzerland at the same maturity. In the latter case, the investor would exchange dollars for Swiss francs today, invest the francs at the Swiss short-term rate, and then convert them back into dollars at the current futures exchange rate. The CIP condition states that the return on these two strategies should be the same.
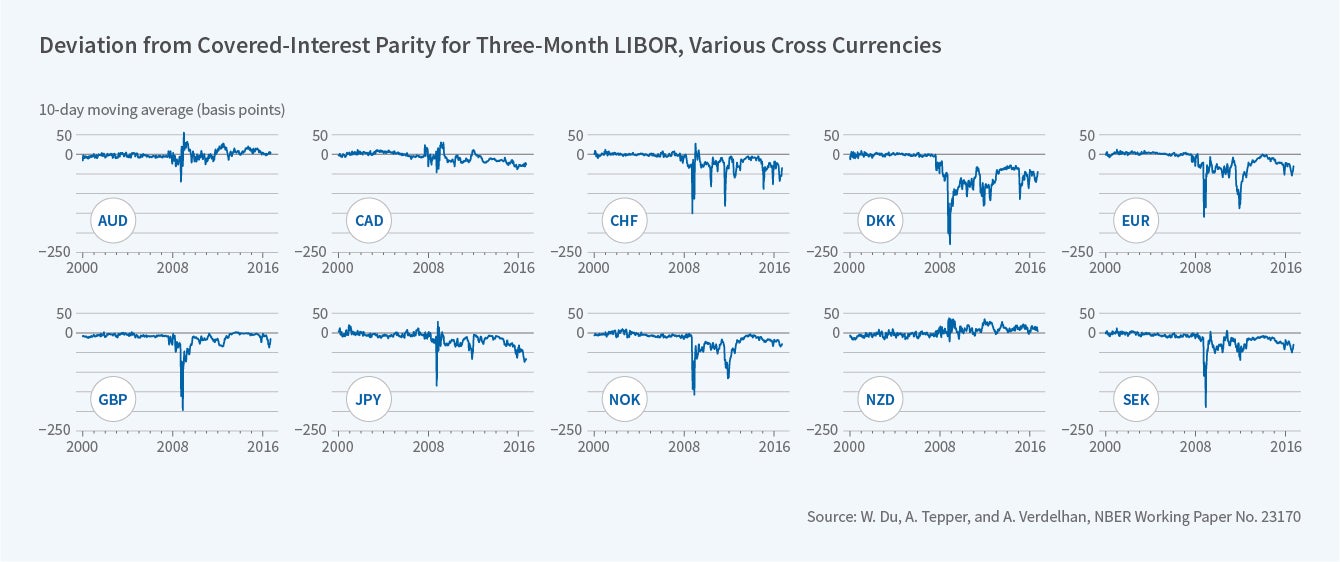
Wenxin Du, Alexander Tepper, and Adrien Verdelhan document that the CIP condition held up well before the crisis, but broke down afterward in the markets for G-10 currencies.1 Figure 1, on the next page, shows these violations in basis points. For most currencies, including the Swiss franc, the Japanese yen, and the euro, it is more profitable to borrow abroad and invest domestically.
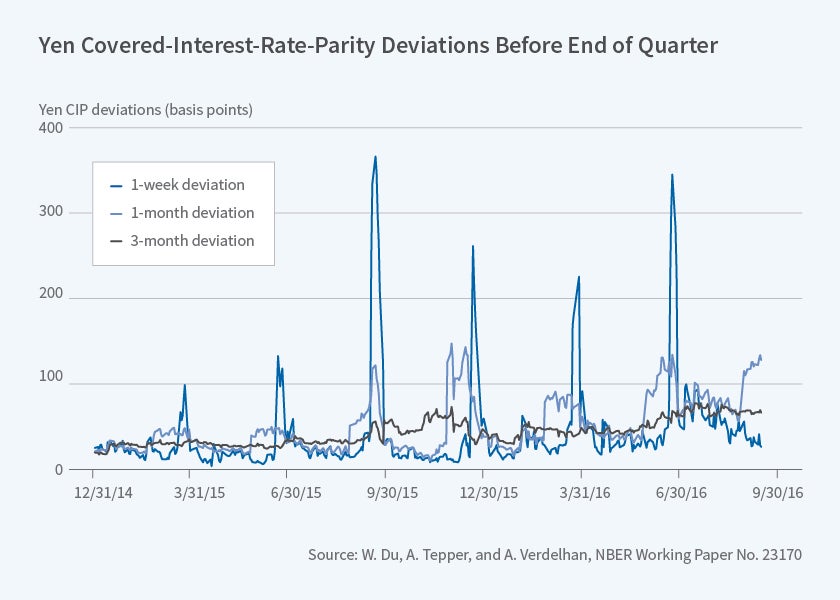
The researchers find evidence that regulatory constraints, in particular capital requirements for European banks, are responsible for the CIP violations. European banks have to hold capital against quarter-end positions. The researchers also observe stronger CIP violations toward the end of the quarter. A week from the end of the quarter, for example, European banks do not like to engage in weeklong positions. Figure 2, also on the next page, shows the pattern of the CIP deviations in forward contracts toward the end of the quarter.
Du, Joanne Im, and Jesse Schreger point to another cause for CIP violations: the attractiveness of U.S. Treasuries as safe assets for investors across the world.2 They document large and persistent CIP violations when rates are measured from government bonds instead of LIBOR. Foreign investors appear willing to give up roughly 25 basis points per year to hold currency-hedged U.S. Treasuries as opposed to their own countries' bonds.
U.S. Treasuries are well known to be sought after as a safe asset. As a consequence, they have a convenience yield: their holders accept a lower interest rate than they could earn on other bonds because the Treasuries are more liquid than other bonds. The presence of the convenience yield leads to CIP violations even in the absence of financial frictions such as regulatory constraints, but during and after the crisis, the yield differential associated with liquidity expanded.
Zhengyang Jiang, Hanno Lustig, and Arvind Krishnamurthy argue that in times in which foreign investors assign a higher convenience yield to U.S. Treasuries, they earn a lower return on Treasuries in their own currency.3 Their paper documents that this theoretical prediction is borne out in the data: a higher convenience yield on Treasuries coincides with an appreciation of the dollar, but predicts its future depreciation, lowering the return on Treasuries for foreign investors.
House Prices
Before the dramatic boom-bust episode of the early 2000s, housing markets attracted relatively little attention from asset pricing researchers. This was due, in part, to data availability. Researchers have easy access to copious data on individual stocks through the Center for Research in Security Prices (CRSP), while researchers studying house prices often must begin with the time-consuming process of putting together a basic dataset. Getting the data is usually costly, because individual housing transactions and mortgage information are only available through commercial data providers such as CoreLogic. These data need to be cleaned with many filters to eliminate transactions that were not made at market prices or that should be excluded for other reasons. We would know more today about booms and busts in housing markets if there was a CRSP database for housing and mortgages.
Despite the data challenges, there has been rapid progress in recent years in studying the dynamics of housing cycles. For example, Tim Landvoigt, Martin Schneider, and I analyze house purchases in the years 2000 and 2005 — the beginning and peak of the recent housing boom — and study the quality of houses that changed owners during those years.4 We analyze the distribution of characteristics of the houses that sold in those years, and then ask what prices buyers were willing to pay for different categories of homes. Our study examines San Diego County, a metropolitan area that experienced a strong boom-bust episode.
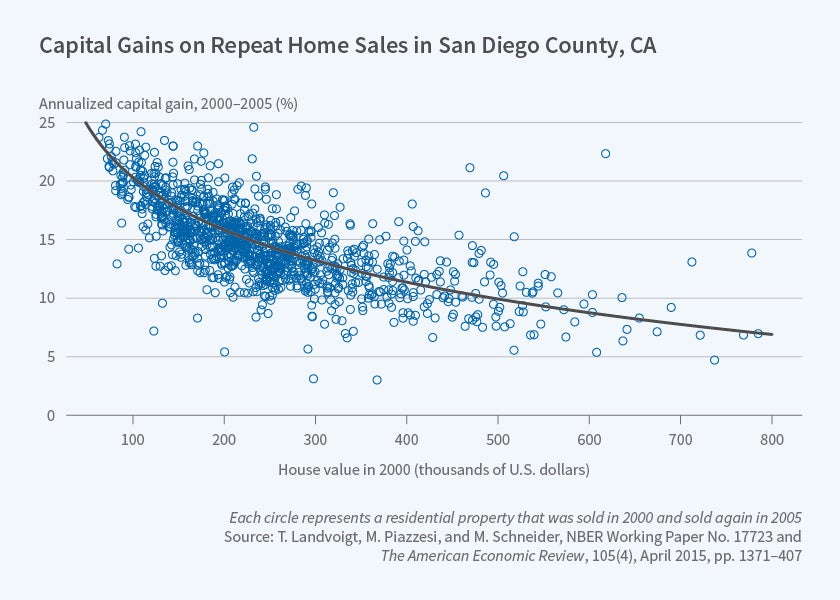
Repeat-sales data suggest that while house prices appreciated in all segments, houses in cheaper, lower-quality segments appreciated more than houses in expensive, higher-quality segments. Each dot in Figure 3 is a house that sold in 2000 and again in 2005. The figure also shows the estimated relationship between capital gains from 2000 to 2005, measured in percent, and the natural log of the initial price. Houses that were initially cheaper, as measured along the horizontal axis, experienced larger subsequent capital gains on the vertical axis.
The data suggest three reasons cheaper homes appreciated more. First, cheap credit — especially lower down-payment constraints, but also lower mortgage rates — enabled poorer households to spend more on a house or to purchase a house in the first place. Second, a larger fraction of the houses sold in 2005 were of either low or high quality relative to 2000. The quality distribution for houses traded at the peak of the boom had fatter tails than the corresponding distribution before the boom. Because fewer medium-quality houses were available, the marginal buyer of a low-quality house was richer in the boom and drove up prices of low-quality houses more, relative to prices of higher-quality houses. Third, at the peak of the boom, households were forecasting further house price appreciation; they were disappointed in the bust.
Another study of the recent evolution of the U.S. housing market examines how the decline in down-payment constraints during the early 2000s could have affected risk premia in housing markets, other asset markets, and house prices. Jack Favilukis, Sydney C. Ludvigson, and Stijn Van Nieuwerburgh observe that a closed economy — one without trade or capital flows — provides a useful benchmark to understand the interaction of down-payment constraints and risk premia.5 In such an economy, credit has to flow from domestic saver households to domestic borrowers, intermediated by the banking system. Lower down-payment constraints will have two counteracting effects. First, they will improve risk-sharing opportunities between households, which lead to lower risk premia in all asset markets, including the housing market, and thereby to higher house prices. Second, improved risk-sharing will also lower precautionary saving. This decline in the supply of saving will raise equilibrium interest rates, which in turn will depress house prices. In the quantitative model developed by these researchers, the second effect dominates, and a decline in down-payment constraints is associated with higher interest rates and lower house prices — a pattern that is not consistent with the U.S. experience during the early 2000s.
The researchers point out that the United States is not a closed economy, and that during the early 2000s, it experienced a massive influx of foreign capital, particularly to domestic bond markets. This influx was quantitatively large enough to lower equilibrium interest rates, and in isolation, it would have pushed domestic savers out of bond markets and into other risky asset classes, thereby increasing risk premia. However, because the influx coincided with lower down-payment constraints that improved risk sharing among domestic households, and lowered risk premia across the board, the overall effect was a coincidence of lower interest rates, lower risk premia, and higher house prices.
Researchers have also studied the dynamics of housing markets in other countries, notably China. Hanming Fang, Quanlin Gu, Wei Xiong, and Li-An Zhou provide evidence that the Chinese house price boom of the last decade has been supported by strong growth in household incomes in most cities.6 Edward Glaeser, Wei Huang, Yueran Ma, and Andrei Shleifer argue that the demand for real estate in China is so strong that current house price developments might be sustainable, especially given the sparse alternative investments for Chinese households.7
House price data have not only been used to study housing market dynamics, but also for other purposes. One novel use is the estimation of discount rates for payoffs that arrive in the distant future. Stefano Giglio, Matteo Maggiori, and Johannes Stroebel document significant price differences between houses in the U.K. that provide the buyer an unlimited property right to the land (freeholds) and those where the property right expires after a predetermined number of years (leaseholds).8 The underlying differences across properties are attributable to differences in contractual provisions that were adopted hundreds of years ago, when large holdings were first divided. The observed price differences today imply that ownership of land that only begins far in the future is highly valued in the housing market. The researchers estimate a long-term discount rate of about 2.5 percent per year. This estimate could find application in a number of settings beyond the housing market, for example in discounting the costs and benefits of environmental policies.
Other research is directed at understanding the role of beliefs and expectations in affecting house prices and the behavior of home buyers. Schneider and I use data from the Michigan household survey and document that, from the beginning to the peak of the 2000s housing boom, the share of optimistic households who were convinced that housing is a good investment because house prices would further appreciate doubled from 10 percent of households to 20 percent.9 We stress that because houses trade in an illiquid search market — less than 10 percent of the housing stock trades in any given year — a small number of optimists is enough to have a major impact on the few transactions that we observe in the housing market. Craig Burnside, Martin Eich-enbaum, and Sergio Rebelo describe the social dynamics of how households pass on their optimism about house prices to other households with an epidemiological model of infectious diseases.10 The work by Greg Kaplan, Kurt Mitman, and Giovanni L. Violante suggests that shifting beliefs about the future trajectory of house prices played a key role in the boom-bust house price cycle.11 Understanding the factors that contribute to such shifts in expectation formation is an active area of research.
Positions and Asset Prices
Why do households and institutions hold certain assets, and what effect do their asset demands have on asset prices? The traditional approach in asset pricing specifies models of optimal consumption-savings behavior and tests these models with data on aggregate or individual consumption of households, as well as asset price data. Recent research on "positions-based asset pricing" tries to understand individual asset positions of households and financial institutions and to connect these positions to asset prices.
There is a large literature that develops models to explain households' asset demands. For example, if households face collateral constraints and an uncertain income that increases over their life cycle, it is possible to explain both large, mortgaged positions in housing and low rates of participation in the stock market by young households. While leveraged positions in a single asset are often associated with hedge funds, they can also make sense for young households with a large claim on human capital: future labor income. Since human capital is relatively safe, it can be optimal to invest the remainder of a young house-hold's portfolio in a highly risky financial position.
Another strand of research, which seeks to explain the behavior of financial institutions, uses a variety of modeling approaches that range from simple descriptions of the risk-return tradeoffs that these institutions face to dynamic optimization models that capture agency frictions or regulatory frictions such as leverage or liquidity constraints. This work builds heavily on the classic contributions in corporate finance. The sharp distinction between contributions to the fields of asset pricing and corporate finance has been eroding, and many research studies are now presented at meetings of both the Asset Pricing and the Corporate Finance Programs.
Empirical work on "positions-based asset pricing" relies on detailed data on the holdings of households and financial institutions. The most comprehensive data source for U.S. household positions is the Survey of Consumer Finances, the Federal Reserve Board's triennial survey of families' balance sheets, pensions, income, and demographic characteristics. Data on positions of financial institutions are drawn from regulatory filings such as the Consolidated Reports of Condition and Income (Call Reports) that banks fill out quarterly.
These detailed data specify positions in many individual assets — many more assets than any model could possibly accommodate. Therefore it has become useful to rely on classic findings in the empirical asset pricing literature that document a strong factor structure in asset returns. The highly complicated problem of choosing between many different assets can then be rephrased as a much simpler problem of choosing exposures to a small set of factors. Factor investing is an interesting example of a technique that has become popular in both the asset management industry and in the latest academic research.
One recent study examines whether the asset demand decisions of financial institutions affect the prices of particular stocks, whether the price impact of these decisions varies over time, and whether these decisions contribute to the volatility of stock returns. Ralph S. J. Koijen and Motohiro Yogo study the stock investment behavior of financial institutions such as insurance companies, mutual funds, pension funds, hedge funds, and endowments.12 They first define, for each financial institution separately, the universe of stocks from which each chooses. Some institutions publish descriptions of the investment universe that they consider. For example, mutual funds publish a prospectus that describes the type of stocks in which they invest. Some invest passively to track the S&P 500 Index; others may track an industry index, such as health care or energy. If an institution does not publish a prospectus, the researchers construct the investment universe by looking at past stock holdings from regulatory filings of Form 13F to the Securities and Exchange Commission.
They then solve a mean-variance portfolio choice problem with heterogeneous beliefs and short sale constraints to describe the institution's demand for stocks with specific characteristics, such as market capitalization or profitability. In equilibrium, the aggregate demand for stocks by financial institutions, plus household demand, must clear the market. In this framework, the researchers find that the price impact of individual institutions has decreased over time, especially for the least liquid stocks. Moreover, their analysis suggests that about 30 percent of the variance in stock returns is due to variations in the assets under management of different investor types, while 60 percent is attributable to other demand factors. Variations in the supply of stocks with various characteristics, for example from share issues or repurchases or from changes in the characteristics of such stocks like a change in dividend payouts, explain only about 10 percent of the return variance.
Juliane Begenau, Schneider, and I use quarterly data from the Call Reports together with return data on fixed income instruments to document the risk exposures of individual banks.13 These exposures are a central focus of macroprudential policy. We develop an approach to measuring exposure to interest rate risk and credit risk, the two factors that explain much of the return variation in fixed income instruments on bank balance sheets. Our approach can be used to represent many different bank positions — including those in derivatives — in terms of simple factor portfolios. A transparent algorithm delivers exposure estimates for each bank, individual position, and date that are comparable across banks and positions.
Our findings indicate that large banks built up considerable exposures to interest-rate risk through both derivatives and other business during the recent boom, while small banks are highly exposed to the credit risk factor through their loan portfolios. To illustrate this point, consider U.S. banks' aggregate net fixed income holdings at the end of 2013. While the net value of these holdings was $2.3 trillion, the interest-rate risk of their positions was comparable to that of a leveraged portfolio with a $4 trillion long position in safe long-term bonds and a similar-sized short position in cash. Interest rate derivatives positions show a similar pattern: They are equivalent to a highly leveraged portfolio with a long position of $1.2 trillion in long- term bonds — which is their exposure to the interest-rate factor — and a $1.1 trillion short position in cash. Both derivatives and other positions decline in value when interest rates rise, so the derivatives do not provide a source of diversification. These results suggest that maturity transformation, which has long been recognized as a goal of banks' traditional business, is also an objective in their investment business. This is reflected in their derivatives positions.
Endnotes
W. Du, A. Tepper, and A. Verdelhan, "Deviations from Covered Interest Rate Parity," NBER Working Paper 23170, February 2017.
W. Du, J. Im, and J. Schreger, "The U.S. Treasury Premium," Journal of International Economics 112: pp.167–81, NBER Working Paper 23759, August 2017, and the Journal of Finance, 73(3), 2018, pp. 915–57.
Z. Jiang, A. Krishnamurthy, and H. Lustig, "Foreign Safe Asset Demand and the Dollar Exchange Rate," NBER Working Paper 24439, March 2018.
T. Landvoigt, M. Piazzesi, and M. Schneider, "The Housing Market(s) of San Diego," NBER Working Paper 17723, January 2012, and the American Economic Review, 105(4), 2015, pp.1371–407.
J. Favilukis, S. Ludvigson, and S. Van Nieuwerburgh, "The Macroeconomic Effects of Housing Wealth, Housing Finance, and Limited Risk-Sharing in General Equilibrium," NBER Working Paper 15988, May 2010, and the Journal of Political Economy, 125(1), 2017, pp. 140–223.
H. Fang, Q. Gu, W. Xiong, and L. Zhou, "Demystifying the Chinese Housing Boom," NBER Working Paper 21112, April 2015.
E. Glaeser, W. Huang, Y. Ma, and A. Shleifer, "A Real Estate Boom with Chinese Characteristics," NBER Working Paper 22789, October 2016, and the Journal of Economic Perspectives, 31(1), 2017, pp. 93–116.
S. Giglio, M. Maggiori, and J. Stroebel, "Very Long-Run Discount Rates," NBER Working Paper 20133, May 2014, and the Quarterly Journal of Economics, 130(1), 2015, pp. 1–53.
M. Piazzesi and M. Schneider, "Momentum Traders in the Housing Market: Survey Evidence and a Search Model," NBER Working Paper 14669, January 2009, and The American Economic Review, 99(2), pp. 406–11.
C. Burnside, M. Eichenbaum, and S. Rebelo, "Understanding Booms and Busts in Housing Markets," NBER Working Paper 16734, January 2011, and the Journal of Political Economy 124(4), pp. 1088–147.
G. Kaplan, K. Mitman, and G. Violante, "The Housing Boom and Bust: Model Meets Evidence," NBER Working Paper 23694, August 2017.
R. Koijen and M. Yogo, "An Equilibrium Model of Institutional Demand and Asset Prices," NBER Working Paper 21749, November 2015, and forthcoming in the Journal of Political Economy.
J. Begenau, M. Piazzesi, and M. Schneider, "Banks’ Risk Exposures," NBER Working Paper 21334, July 2015.


