Integrated Assessment Models of Climate Change
Many areas of the natural and social sciences involve complex systems that link multiple areas and disci-plines. This is particularly true for the science, economics, and policy of climate change, which involve a wide variety of fields from atmospheric chemistry to game theory.1 As understanding progresses across the different fronts, it is increasingly necessary to link the different areas to develop models and policies that reflect the complex interactions. A full analysis would reflect that economic activity drives emissions, which affect atmospheric concentrations, thence climate and the hydrological cycle, which in turn affect human and natural systems, which ultimately contribute to the determination of climate policies.
Integrated assessment analyses and models play a key role in putting the pieces together. Integrated assessment models (IAMs) can be defined as approaches that integrate knowledge from two or more domains into a single framework. These are sometimes theoretical but are increasingly computerized, empirical, dynamic, non-linear models of varying levels of complexity.
The challenge of coping with global warming is particularly daunting, because it spans many disciplines and parts of society. Ecologists may see it as a threat to ecosystems, marine biologists as a problem leading to ocean acidification, and coastal communities as a lottery with intense hurricanes, while ski resorts may view it as a mortal danger to their already short seasons. It also poses a challenge to natural and social scientists, who must incorporate a wide variety of geophysical, economic, and political disciplines into their diagnoses and prescriptions.
Integrated assessment models of climate change grew organically from energy models. One of the earliest careful comparisons of energy models was the Modeling Resource Group (MRG) analysis of the 1970s.2 This project, chaired by Nobel Prize-winning economist Tjalling Koopmans, analyzed several energy models that projected energy demands and technologies over a long time horizon. The earlier work of Koopmans on the linear programming approach to production, as well as the Samuelson principle of "markets as maximization," formed the intellectual core of much of the energy modeling starting at that time and proceeding to the present.3
The first IAMs in climate change were basically energy models with an emissions model included, and later with other modules such as a carbon cycle model and a small climate model. My early approaches were partial equilibrium energy models with exogenous output.4 A. S. Manne's model, the first to imbed an energy system in a full economic-growth model, was an important landmark.5 The earliest versions of my models adopted a growth-theoretic framework similar to Manne's and extended it to geophysical variables.6
IAMs are increasingly used in analyses by national governments and in international assessments. Among the most important applications are:
- Making projections that have consistent inputs and outputs of the different components of the system so that, for example, the GDP projections are consistent with the emissions projections.
- Calculating the impacts of alternative assumptions on important variables such as output, emissions, temperature change, and the effect of economic activity on climate.
- Tracing the effects of alternative policies on all variables in a consistent manner as well as esti-mating the costs and benefits of alternative strategies.
- Estimating the uncertainties associated with alternative variables and strategies along with the value of research and new technologies.
There are dozens of IAMs today, a handful of which have a track record of at least a decade. Models range from small ones like the DICE model described below to enormous ones that may have as many as a half-million variables. Different IAMs are like different animals in terms of comparative strengths and weaknesses in tackling the various questions above. Small comprehensive models can yield a full cost/benefit analysis, but are weak on regional or industrial detail. Larger species provide great detail, but may be unable to trace impacts and damages, are less transparent, and are unable to do full uncertainty analyses. Some models are able to trace the impacts of policies on land use. Others can investigate a wide range of technologies. A few have full damage functions, while others include a limited number of technologies and engineering variables. The great diversity of the modeling ecosystem allows most important questions to be addressed.
The DICE and RICE Models as Examples
The Dynamic Integrated model of Climate and the Economy (DICE) and Regional Integrated model of Climate and the Economy (RICE) models have gone through several revisions since their initial develop-ment around 1990. The latest published versions are the RICE-2010 and DICE-2016R2 models. The latest DICE model is available in GAMS, a fine mathematical software system, and a full description of the earlier version is available.7
DICE is a globally aggregated model. RICE is essentially the same, except that output and abatement have structures for 12 regions. This discussion will use the term "DICE model," and for most modules the analysis applies equally to the RICE model.
The DICE model views the economics of climate change from the perspective of neoclassical economic growth theory. In this approach, economies make investments in capital, education, and technologies, thereby reducing consumption today in order to increase consumption in the future. The DICE model extends this approach by including the "natural capital" of the climate system as an additional kind of capital stock. By devoting output to emissions reductions, economies reduce consumption today but prevent economically harmful climate change and thereby increase consumption possibilities in the future.
The DICE model has 12 behavioral equations, two variables to be optimized, and several identities. In the GAMS version, the simplest model has about 240 lines of operational code. A run of 1,000 years takes five seconds, so it can be used for projects with multiple states of the world and Monte Carlo experiments.
The RICE model has the same basic economic and geophysical structure, but contains a regional elaboration. The specification of preferences in RICE is different because it must encompass multiple regions. The general preference function is a Bergson-Samuelson social welfare function over regions. The model is specified using the Negishi approach, in which regions are aggregated using time- and region-specific weights subject to budget constraints.
This sketch of a pair of IAMs in the DICE and RICE models makes it clear that they are highly simplified representations of complex economic and geophysical realities — what might be called geo-macroeconomics. While small and comprehensive models have many advantages, they also have major shortcomings because of their simplifications.
A useful analogy here is to return to the animal kingdom. Each model is like an animal that has its fruitful niche in the analytical ecosystem. Small models can be fleet and can adapt easily to a changing environment or new data, while large models take many years to mature but are able to handle much larger and more complex tasks.
Illustrative Results
Here are some representative results using the DICE model. These results are from the most recent version of the model DICE-2016R2.8 One application is to compare the economic and climate trajectories associated with different policy approaches. Here are four different policy options:
Baseline: No climate-change policies are adopted.
Optimal: Climate-change policies maximize economic welfare, with full participation by all nations starting in 2020.
Temperature-limited: The optimal policies are undertaken subject to a further constraint that global temperature does not exceed 2.5 °C above the 1900 average. (The international goal of 2 °C is not feasible with current DICE estimates without technologies that allow negative emissions by mid-21st century.)
Stern discounting: These are results associated with an extremely low discount rate as advocated by The Stern Review on the Economics of Climate Change.9
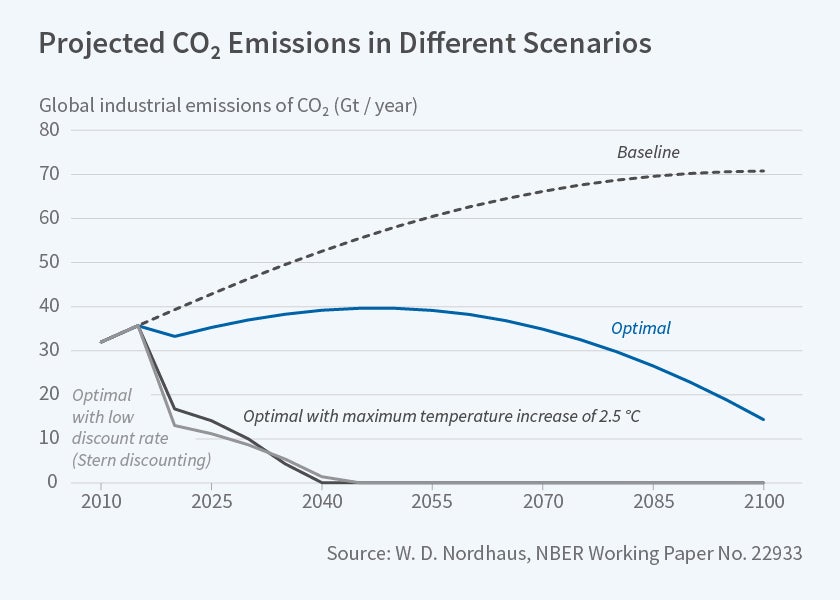
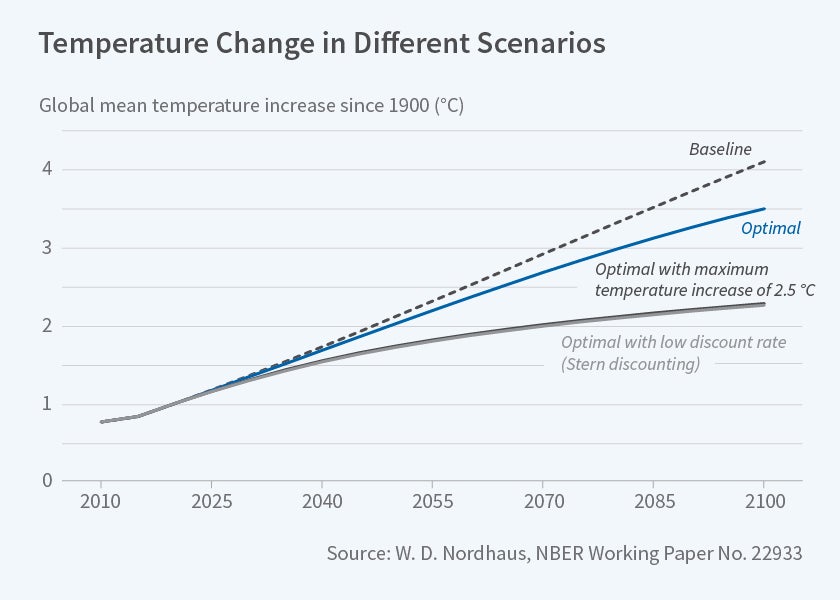
Figures 1–3 show outcomes associated with the four policy options. A few key results emerge. First, emissions differ sharply, with major cuts in emissions in cases with ambitious policies. Second, the temperature in the uncontrolled scenario continues to rise sharply over the current century.
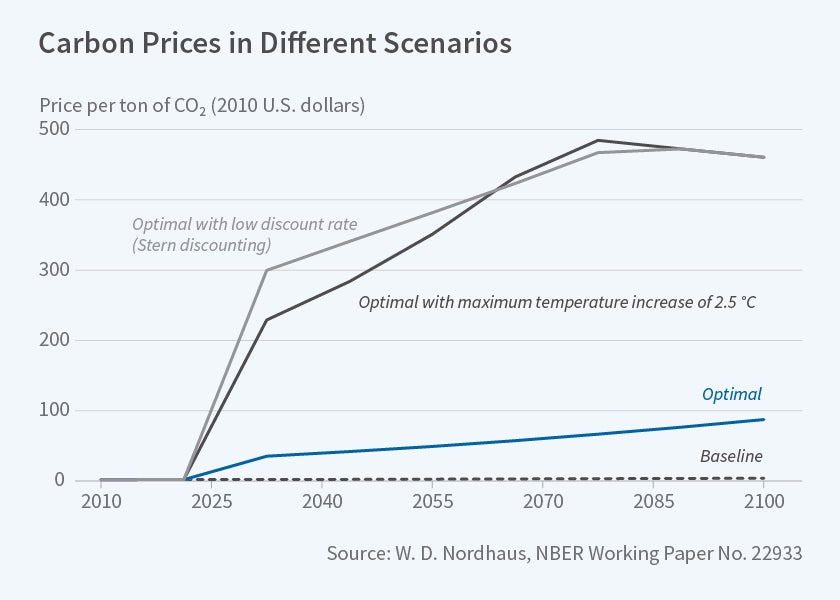
Figure 3 is the outcome that is generated uniquely by IAMs: the carbon prices associated with each policy. This is a concept that measures the marginal costs of reductions of emissions of greenhouse gases. In a market environment such as a cap-and-trade regime, the carbon prices would be the trading price of carbon emission permits. In a carbon-tax regime, they would be the harmonized carbon tax among participating regions. Carbon prices in the baseline scenario are the current average prices in world markets, roughly $2 per ton of CO2. Prices under the optimal and temperature-limited scenarios at first rise to $35 and $229 per ton of CO2, respectively, by 2020. The carbon prices associated with the low-discounting scenario are close to those of the temperature-limited policy.
The carbon price is closely linked to an important policy instrument, the social cost of carbon, or SCC. This concept represents the economic cost of an additional ton of carbon dioxide emissions (or, more succinctly, carbon) or its equivalent. The advantage of IAMs is that they can calculate the shadow price of carbon emissions along a reference path of output, emissions, and climate change. In an optimized climate policy, abstracting away from distortions, the social cost of carbon will equal the carbon price or the carbon tax.
Estimates of the SCC are a critical ingredient in climate-change policy. They provide policymakers a guidepost to aim for if they are seeking an economically efficient policy for carbon pricing. Another application is for rulemaking where countries do not have comprehensive policies covering all greenhouse gases. In this context, regulators might use the SCC in a calculation of social costs and benefits of policies involving energy or climate-affecting decisions. For example, the U.S. government has undertaken rulemaking proceedings to determine the SCC for use in such areas as subsidies for the installation of low-carbon energy sources, regulations requiring energy efficiency standards in buildings and motor vehicles, and for power plants. Current regulations using the SCC have more than $1 trillion in benefits, according to the U.S. Environmental Protection Agency.10
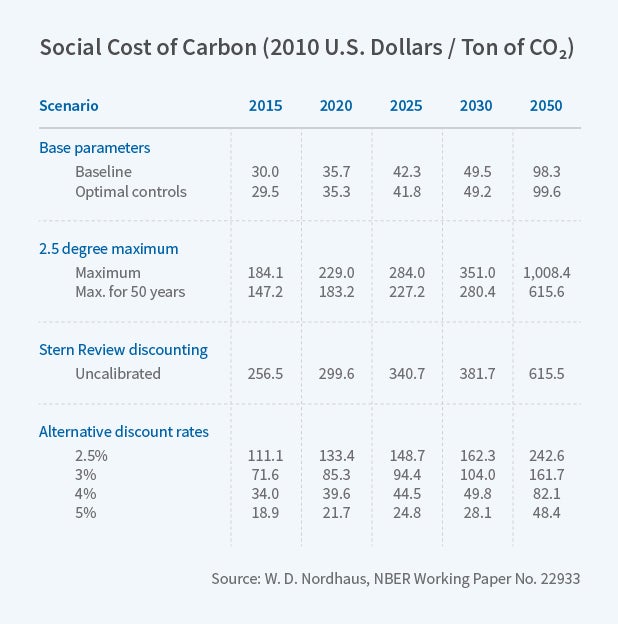
Estimates of the SCC vary by model and approach. Table 1, on the following page, shows estimates from the most recent DICE model. Two points emerge here. The first is the critical importance of discounting. Looking at 2020, the SCC ranges from $22 to $133 per ton of CO2 as the real discount rate ranges from 2.5 to 5 percent per year. Second, the SCC is extremely high — around $200 per ton of CO2 — for damage functions that would justify the temperature-limited objective (2 °C) that has been adopted at international meetings in Copenhagen and Paris.
Calibration in IAMs
IAMs belong to a class of models, both in economics and more generally in applied sciences, that rely on calibration rather than econometric estimation. Calibration involves determination of system parameters and behavior using external evidence rather than statistical systems estimation. Calibration gained widespread use with the introduction of computable general equilibrium models, of which DICE and RICE are examples, and more recently with real business cycle models. Outside economics, important examples of calibrated models are earth-system models such as the familiar climate models, transportation models, and engineering studies. Generally, while estimation is desirable, calibration is necessary when the model reaches a certain complexity or when there are no relevant data to use for estimation. Both of these are true for IAMs of future climate change.
As an example, one of the most controversial aspects of IAMs is the damage function, which relates climate change to economic impacts. Take the "simple" example of tropical cyclones — hurricanes in the United States. Basic physics indicates that a warmer ocean is likely to increase the intensity of hurricanes; more precisely, the probability distribution of damage from wind speed will shift to the right. IAMs need to integrate this finding with economic impacts. A major surprise of research here was that the economic impacts of hurricanes are a high-power function of maximum wind speed; normalized by economic variables such as local capital, damage is estimated to be wind speed to the ninth power.11
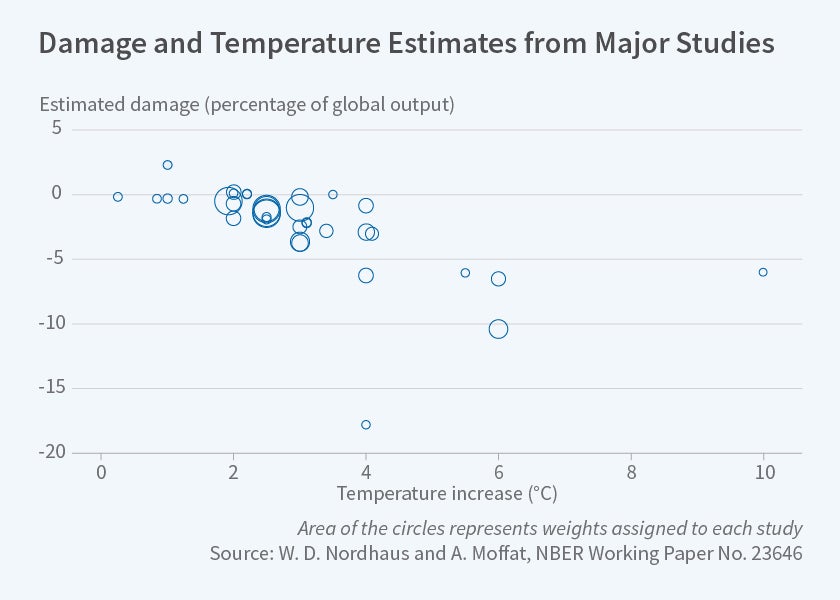
But that is only a small slice of damage. To construct damage functions, researchers need to aggregate across sectors, regions, levels of development, and climate change scenarios. This has proven the most difficult part of IAMs. In aggregate models, damage is often represented as a quadratic function of global mean temperature. Andrew Moffat and I recently did a systematic review of damage estimates; Figure 4 summarizes the findings of different studies.12 One important feature of damage studies is that they are generally limited to global temperature increases of up to 3 °C, with the upper limits shown in Figure 2 not well-studied.
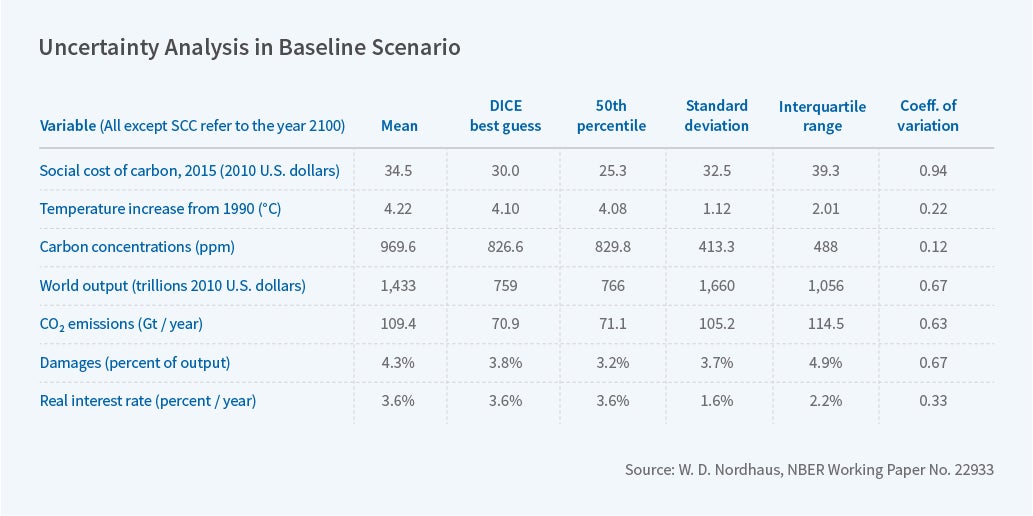
A difficulty in assessing IAMs is the inability to use standard statistical tests because of the lack of a probabilistic structure. One concern, alluded to above, is the major uncertainties associated with the results of IAMs. The uncertainties are particularly pronounced because of the long time periods — literally hundreds of years — required for estimates of optimal policies and the SCC. A recent study using the DICE-2016R2 model examined the uncertainties of major outcomes from parametric uncertainty of five major variables: equilibrium temperature sensitivity, productivity growth, the damage function, the carbon cycle, and the rate of decarbonization. Table 2, on the following page, shows the results. The best guess is the standard DICE model where parameters are set at their expected values, while the others are the distribution of outcomes. For the important SCC calculation, the mean value with full uncertainty is about 15 percent above the best guess. The change in temperature for 2100 is only slightly higher than the best guess. On the other hand, output is much higher because of the large estimated uncertainty of productivity growth.
Another approach to estimating uncertainty, illustrative rather than statistical, is to examine model revisions. For this purpose, I looked at revisions of the DICE model over its quarter-century history. The study found that the major revisions have come primarily from economic aspects of the model, whereas the revisions to environmental modules have been much smaller. Particularly sharp revisions have occurred for global output, damages, and the social cost of carbon. These results indicate that the economic projections are the least precise parts of IAMs and deserve much greater study than has been the case up to now, especially careful studies of economic growth prospects to 2100 and beyond.13
Conclusion
IAMs are important tools for understanding the implications and policy aspects of climate change. They have fundamentally transformed the way economists and environmentalists approach climate policy, shifting from a pure engineering approach — "do this and don't do that" — to approaches like cap-and-trade or carbon taxes that emphasize market mechanisms.
As hurricanes Harvey and Irma remind us, the impacts of weather events can be extremely large. So climate change is likely to continue growing as an economic problem. Improving integrated assessment models is therefore an important research area for economists — full of puzzles, challenges, and policy applications.
Endnotes
This research report draws upon W. D. Nordhaus, The Climate Casino: Risk, Uncertainty, and Economics for a Warming World, New Haven, CT: Yale University Press, 2013; W. D. Nordhaus, "Integrated Economic and Climate Modeling," in Handbook of Computable General Equilibrium Modeling, P. Dixon and D. Jorgenson, eds.: Elsevier, 2013, pp. 1069–131; W. D. Nordhaus, "Projections and Uncertainties About Climate Change in an Era of Minimal Climate Policies," NBER Working Paper 22933, December 2016, revised September 2017.
Report of the Modeling Resource Group, Synthesis Panel of the Committee on Nuclear and Alternative Energy Systems, National Research Council, Energy Modeling for an Uncertain Future, Washington, D.C.: The National Academies Press, 1978.
P. A. Samuelson, "Market Mechanisms and Maximization," Santa Monica, CA: Rand Corporation, P-69, March 28, 1949.
W. D. Nordhaus, "Can We Control Carbon Dioxide?" International Institute for Applied Systems Analysis Working Paper, WP 75-63, Laxenburg, Austria, June 1975; W. D. Nordhaus, "Economic Growth and Climate: The Case of Carbon Dioxide," American Economic Review, 67(1), 1977, pp. 341–6.
A. S. Manne, "ETA: A Model for Energy Technology Assessment," Bell Journal of Economics, 7(2), 1976, pp. 379-406.
W. D. Nordhaus, "An Optimal Transition Path for Controlling Greenhouse Gases," Science, 258, 1992, pp. 1315–9; W. D. Nordhaus, Managing the Global Commons: The Economics of Climate Change, Cambridge, MA: MIT Press, 1994.
W. D. Nordhaus, P. Sztorc, "DICE 2013R: Introduction and User's Manual," October 2013. http://www.econ.yale.edu/~nordhaus/homepage/homepage/documents/DICE_Manual_100413r1.pdf.
W. D. Nordhaus, "Projections and Uncertainties about Climate Change in an Era of Minimal Climate Policies," NBER Working Paper 22933, December 2016, revised September 2017.
The Economics of Climate Change: The Stern Review, Cambridge, England: Cambridge University Press, 2007; W. D. Nordhaus, "The 'Stern Review' on the Economics of Climate Change," NBER Working Paper 12741, December 2006; and "A Review of the Stern Review on the Economics of Climate Change," Journal of Economic Literature, 45, September 2007, pp. 686–702.
W. D. Nordhaus, "Revisiting the Social Cost of Carbon," Proceedings of the National Academy of Sciences, 114(7), 2017, pp. 1518–23.
W. D. Nordhaus, "The Economics of Hurricanes in the United States," NBER Working Paper 12813, December 2006, and Climate Change Economics, 2010, 1 (1), pp. 1–20.
W. D. Nordhaus and A. Moffat, "A Survey of Global Impacts of Climate Change: Replication, Survey Methods, and a Statistical Analysis," NBER Working Paper 23646, August 2017.
W. D. Nordhaus, "Evolution of Assessments of the Economics of Global Warming: Changes in the DICE Model, 1992–2017," NBER Working Paper 23319, April 2017.


